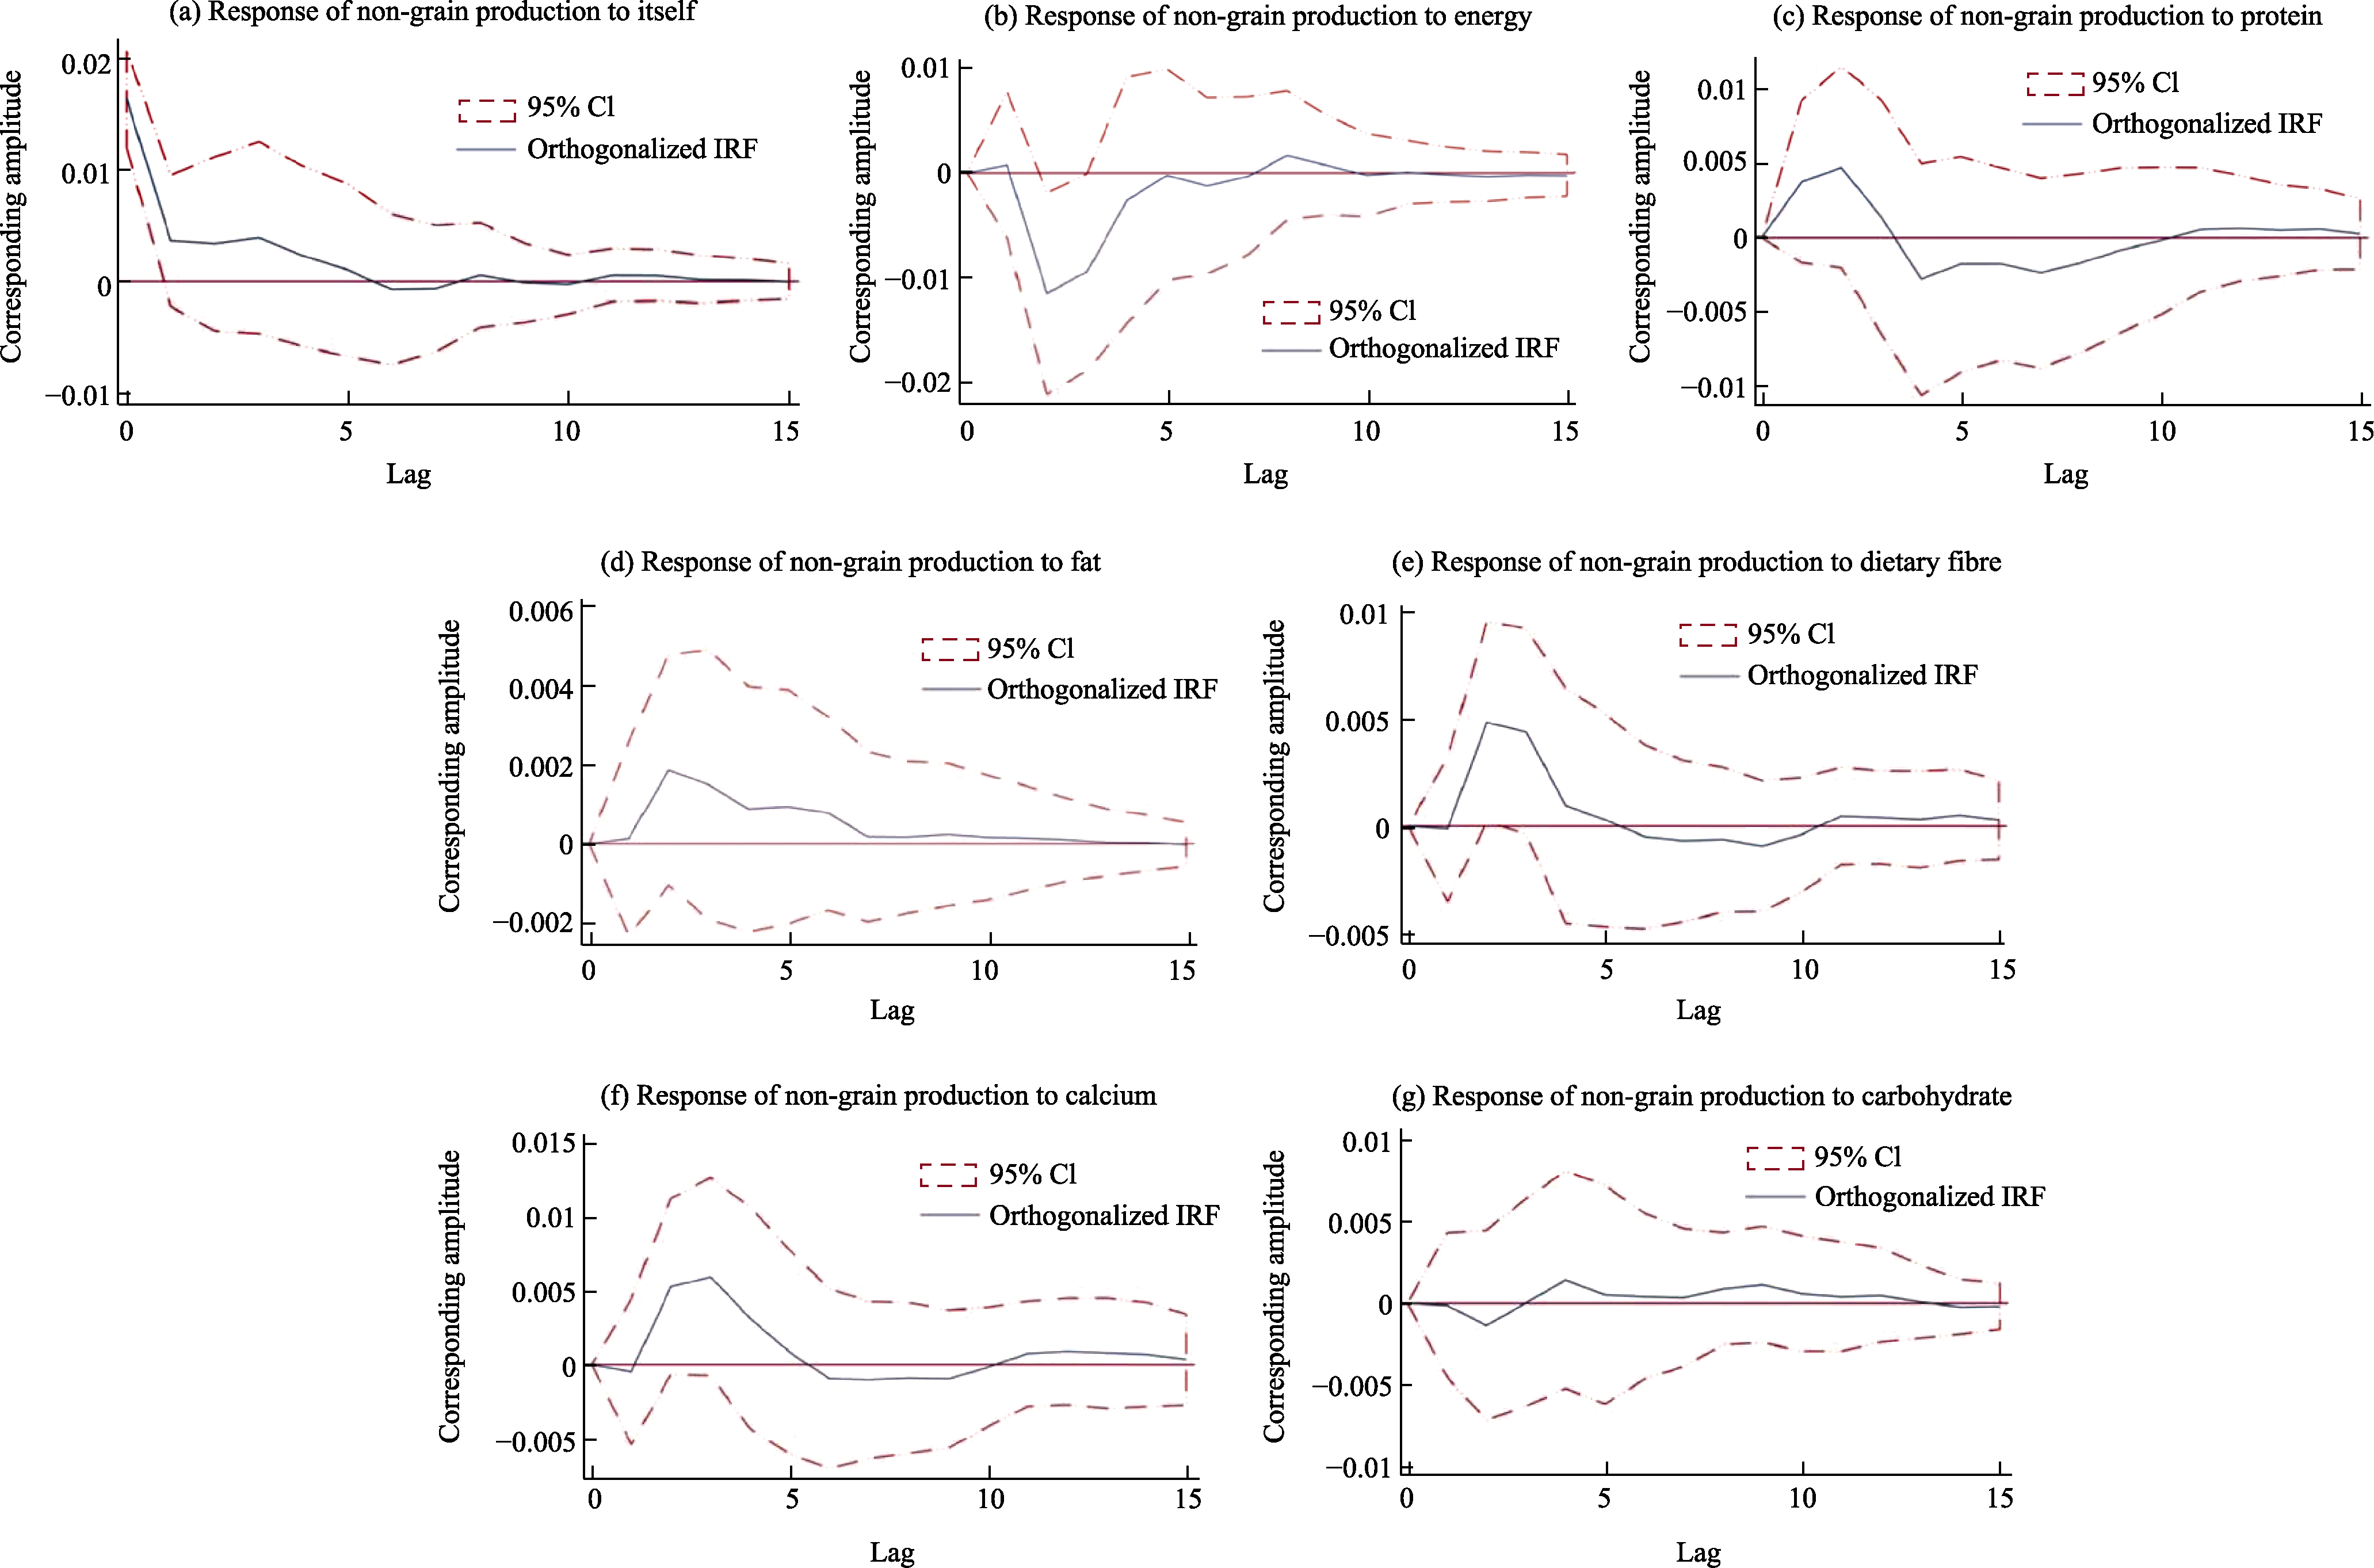
Fig. 6 Impulse responses of non-grain production to dietary nutrients
Note: In each graph, the horizontal coordinate is the number of lag periods, the vertical coordinate is the size of the response value, the solid line is the change trend of the response function, and the middle range of the dashed lines is the confidence interval. CI means confidence interval; IRF means impulse response function.
本文的其它图/表