×
模态框(Modal)标题
在这里添加一些文本
关闭
关闭
提交更改
取消
确定并提交
×
模态框(Modal)标题
×
期刊
文章
图表
检索
EN
中文
首页
关于期刊
期刊介绍
数据库收录
期刊荣誉
编委会
投稿指南
研究论文/综述
数据论文
版权协议
专辑与专题
专辑
虚拟专题
在线期刊
当期目录
优先出版
过刊浏览
推荐文章
按栏目浏览
阅读排行
下载排行
引用排行
E-mail Alert
RSS
勘误说明
期刊订阅
联系我们
EN
中文
图/表 详细信息
居民膳食结构升级对耕地非粮化的影响
陈倩茹, 吴曼玉, 曾宏琛, 罗世龙
资源与生态学报, 2023, 14(
6
): 1350-1360. DOI:
10.5814/j.issn.1674-764x.2023.06.022
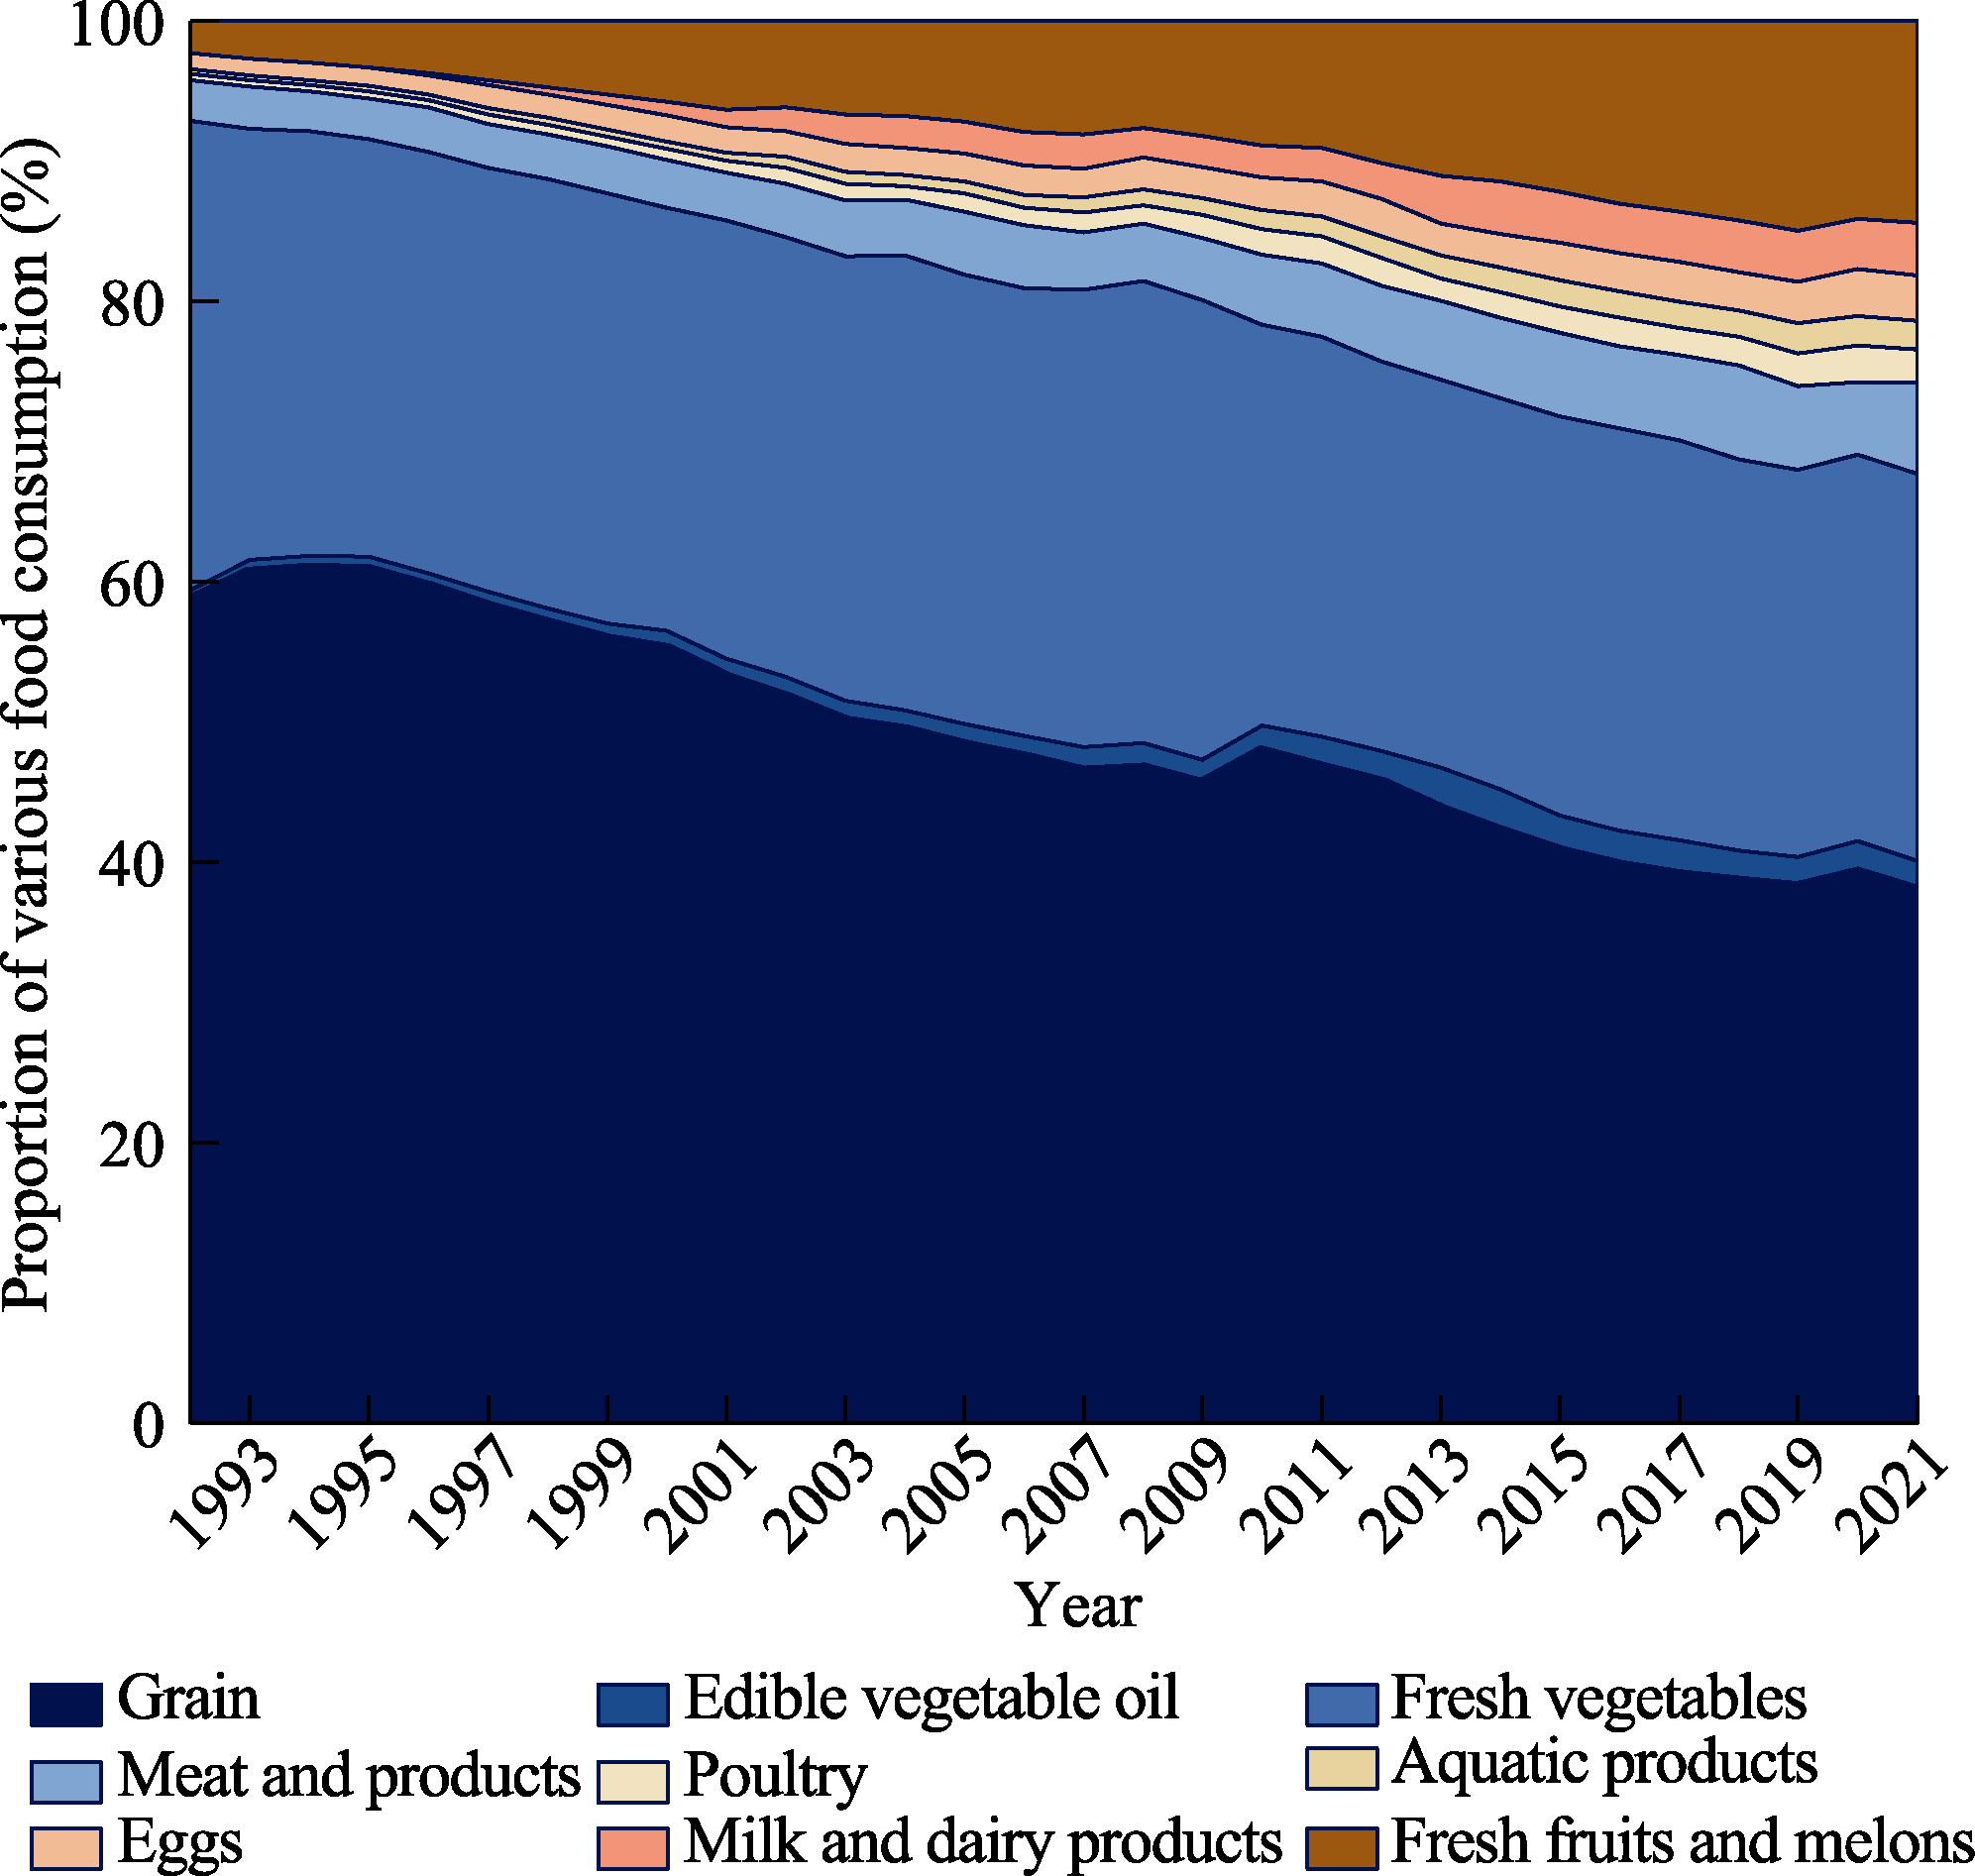
Fig. 2
Per capita food consumption structure of residents, 1992?2021
本文的其它图/表
Table 1
Dietary nutrient content of various foods
Table 2
Selection of variables and their meanings
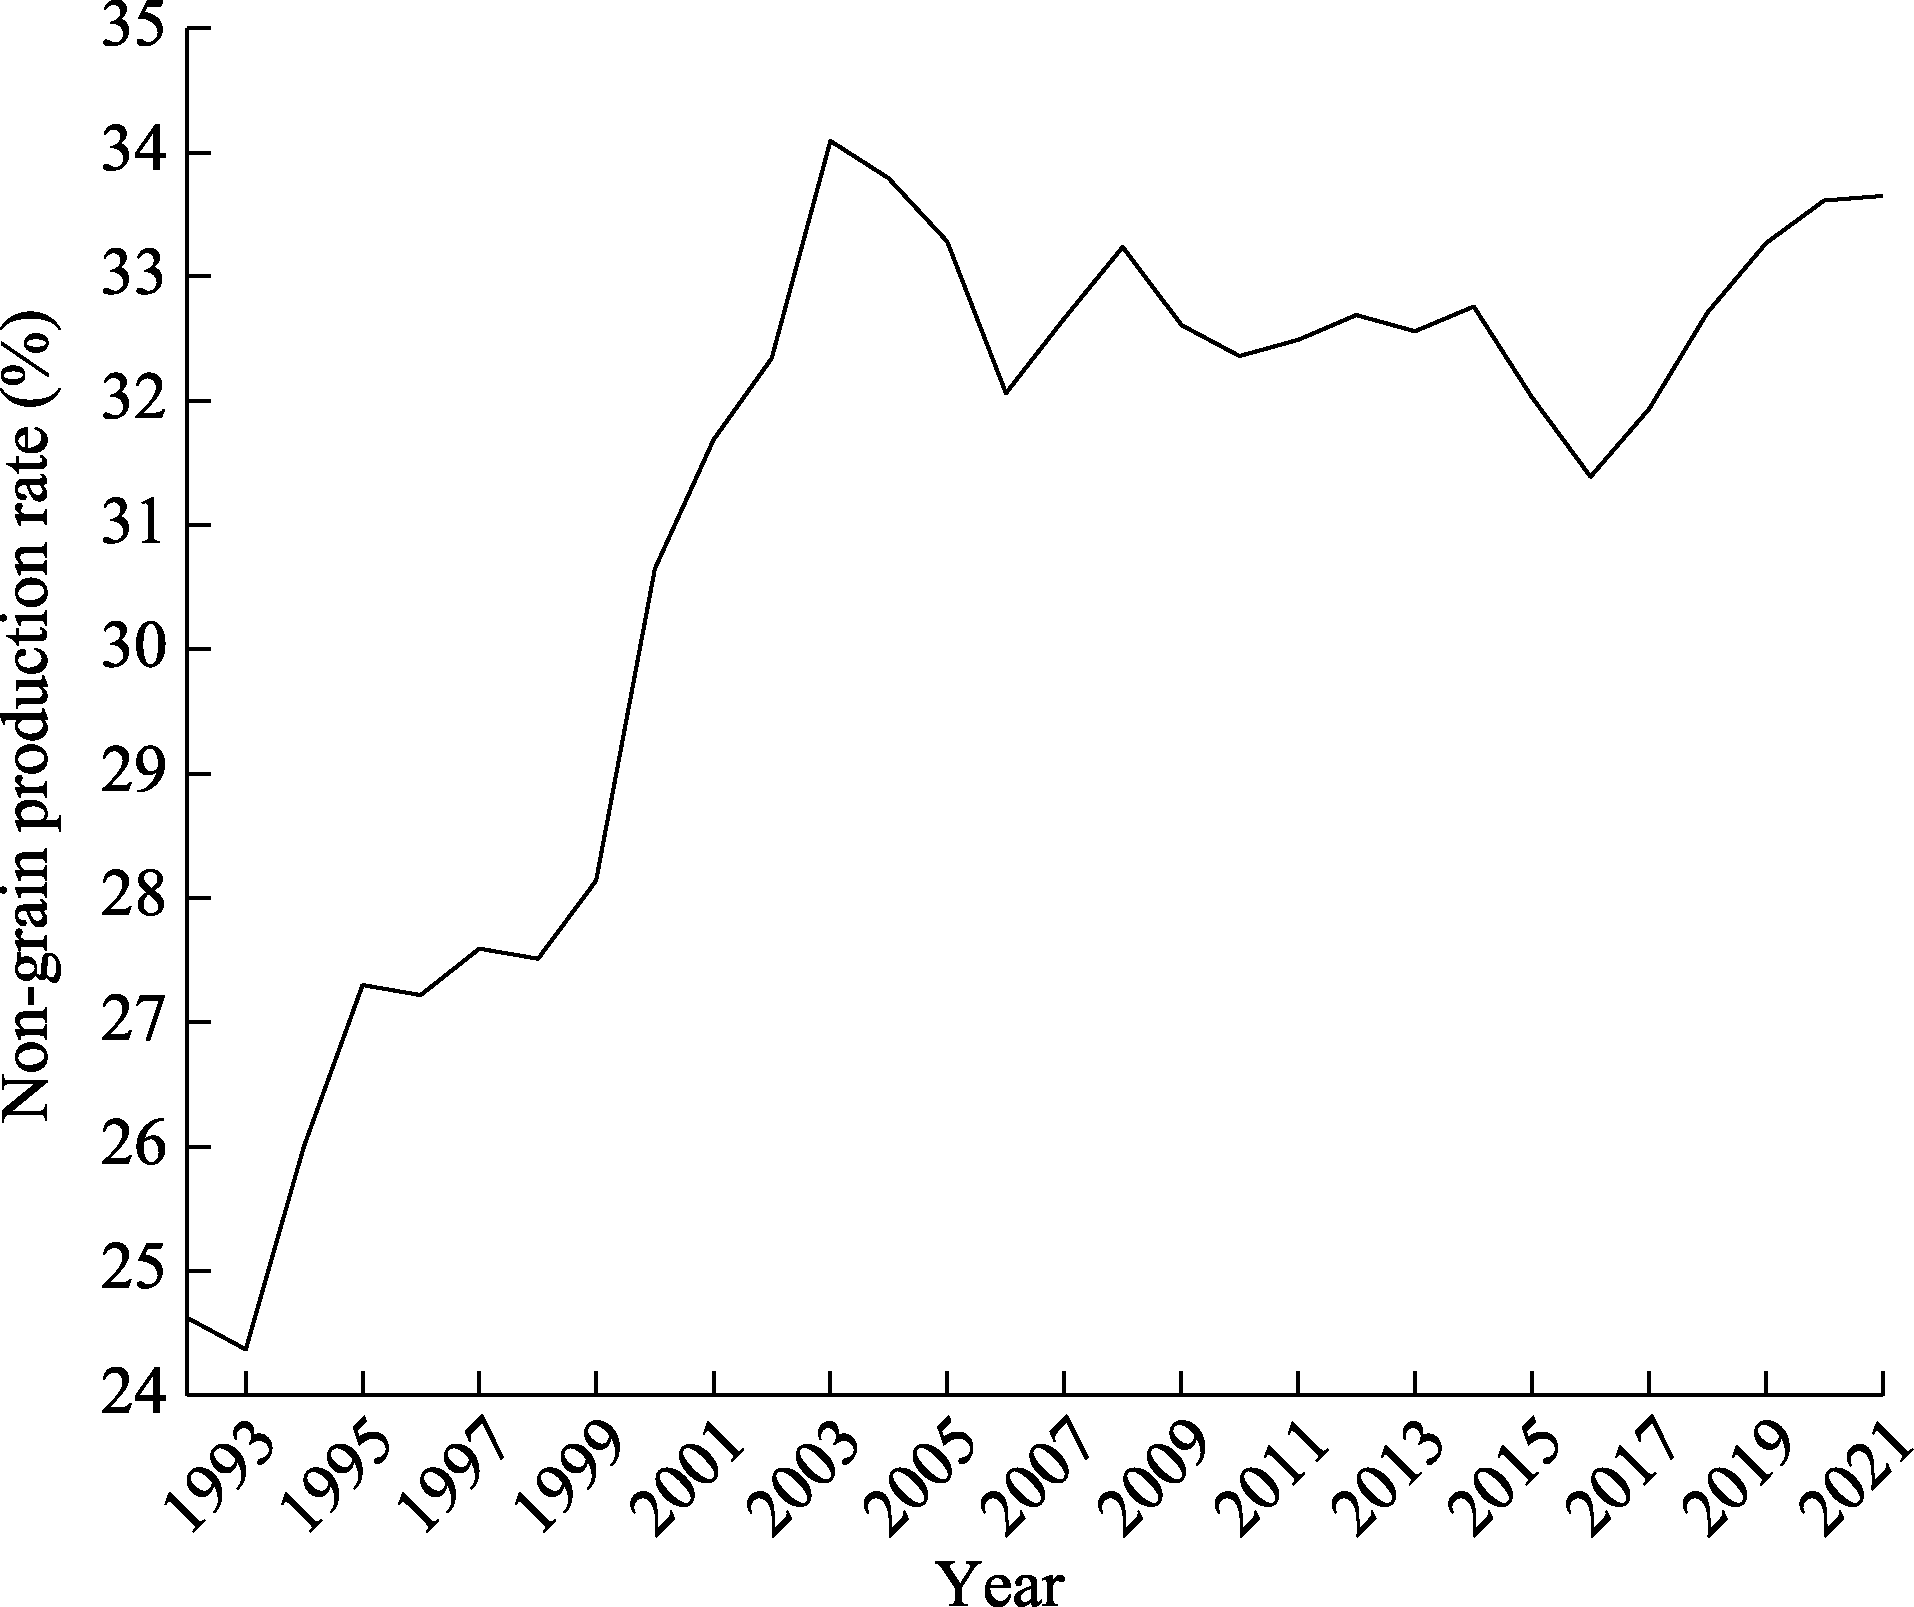
Fig. 1
Changes in the non-grain production rate from 1992 to 2021
Fig. 3
Changes in per capita daily consumption of protein, fat, and energy among Chinese residents during 1992?2021
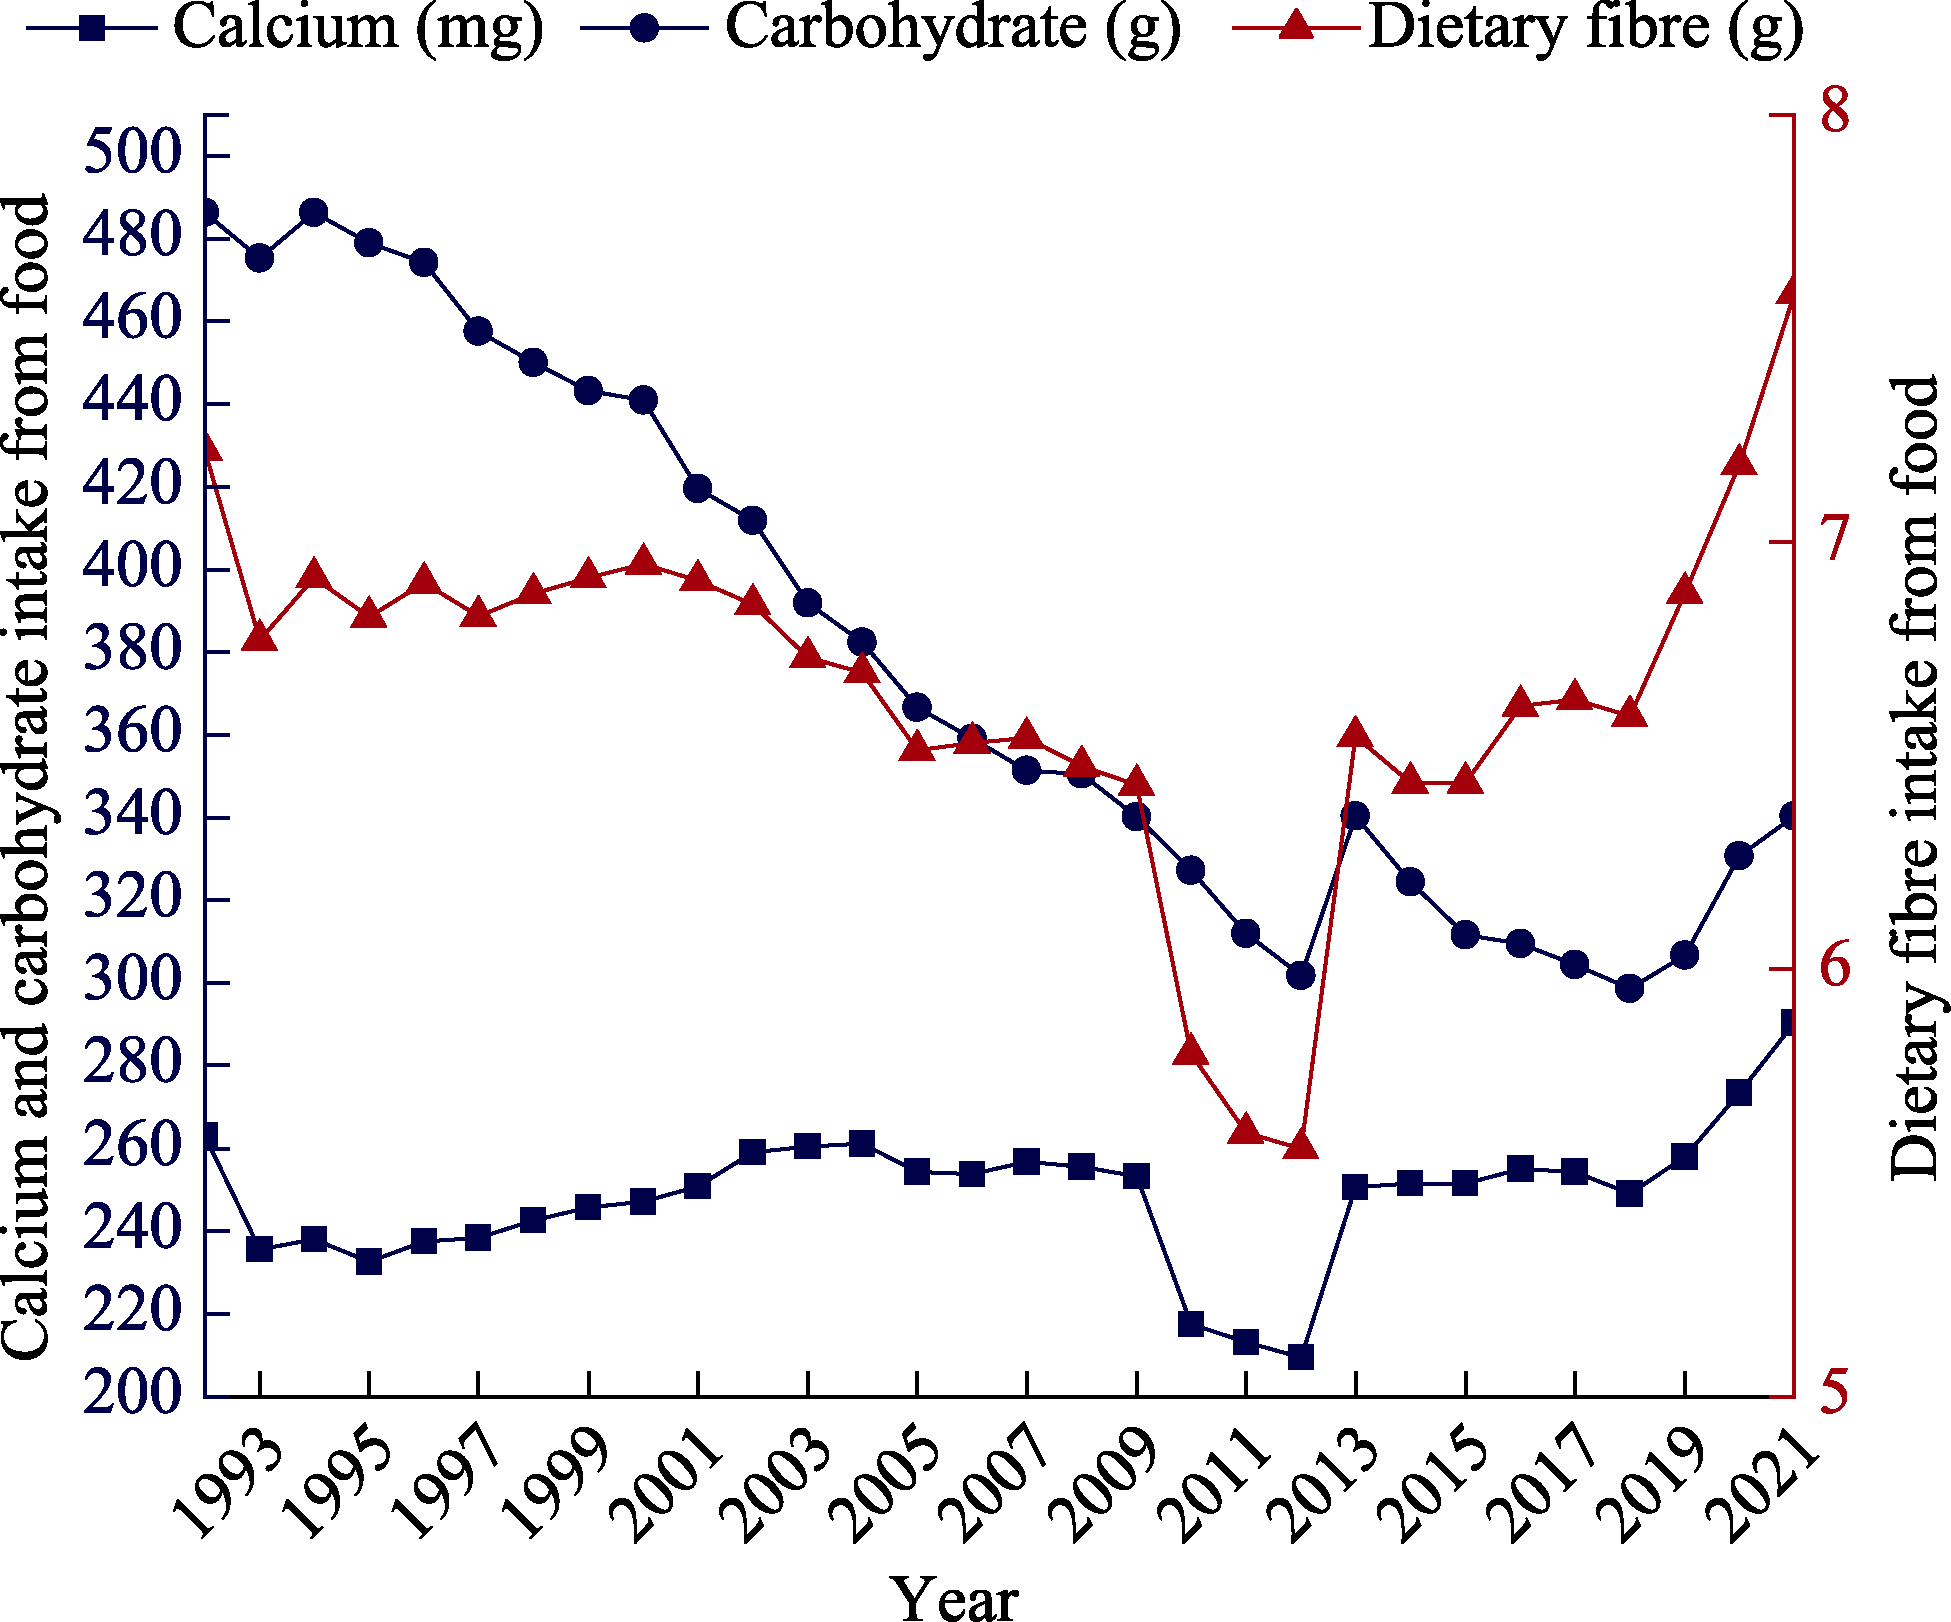
Fig. 4
Changes in per capita daily consumption of calcium, calbohydrate, and dietary fibre among Chinese residents during 1992?2021
Table 3
ADF unit root test
Table 4
Selecting the optimal lag order
Table 5
Johansen cointegration test results
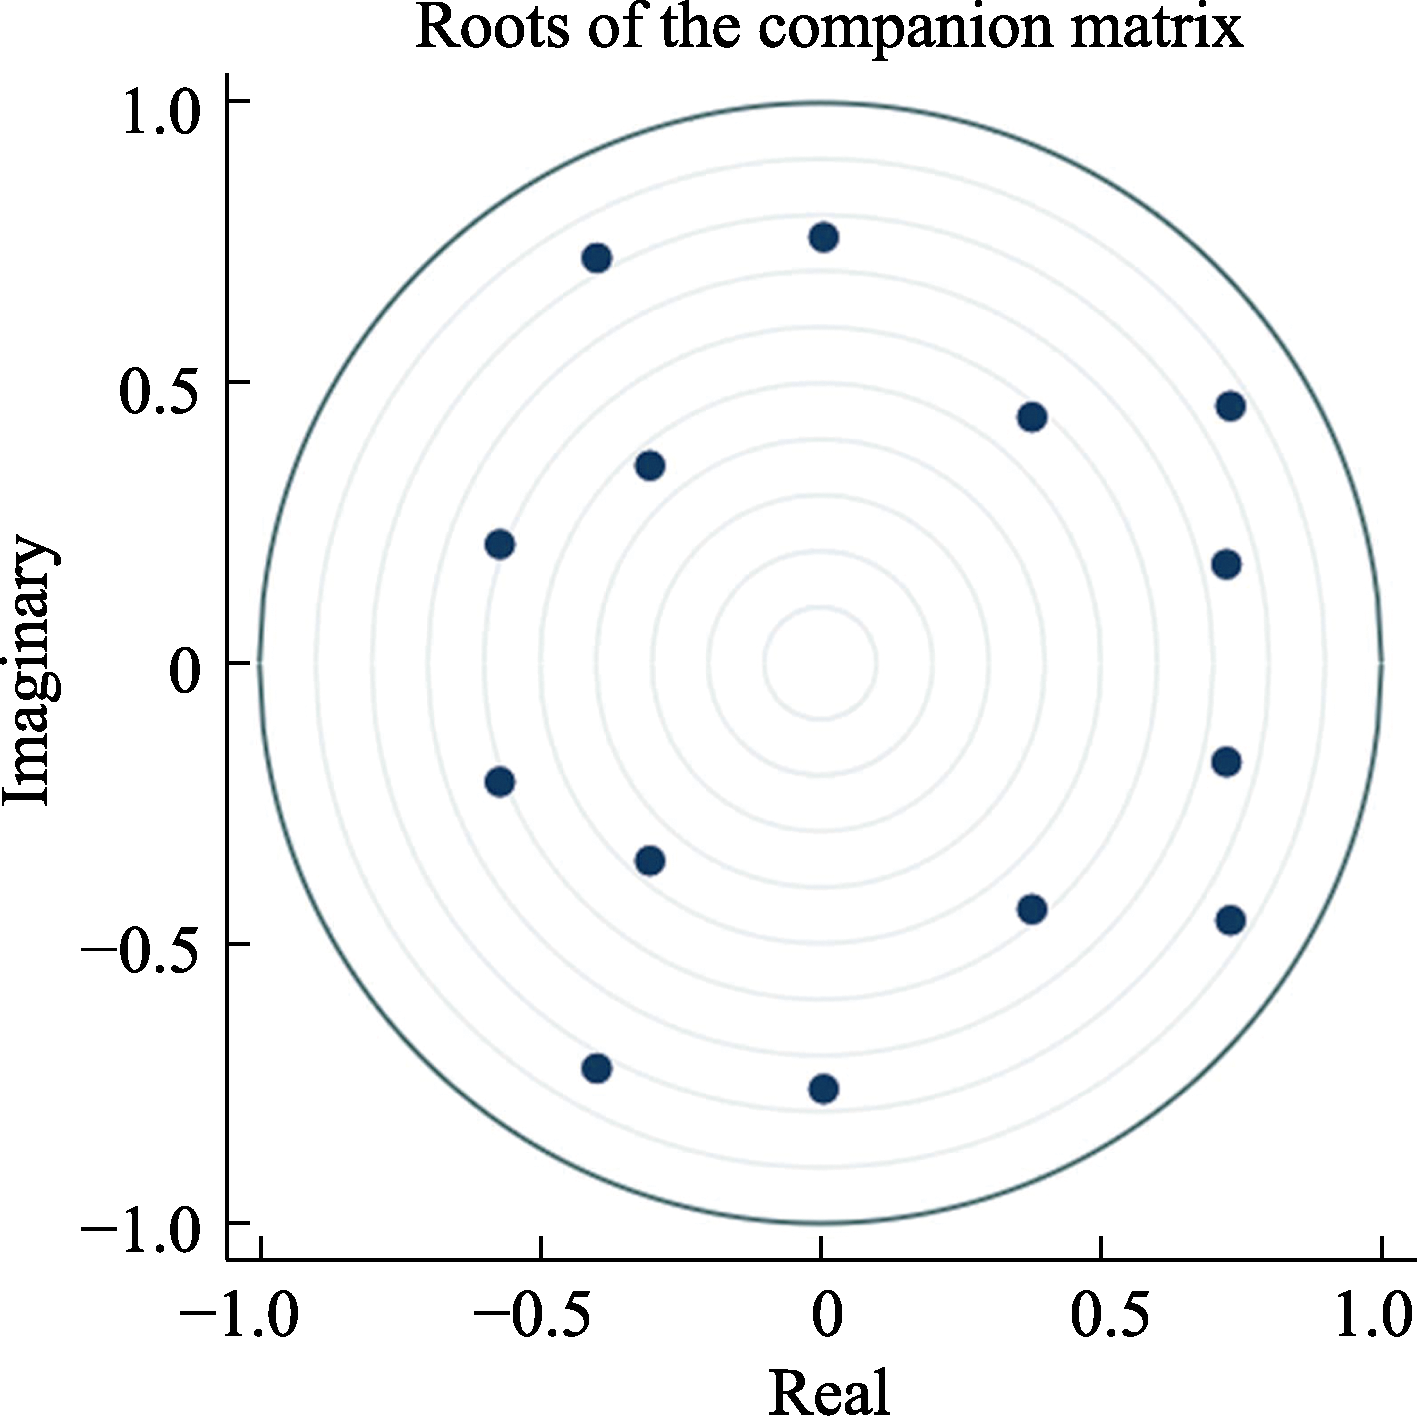
Fig. 5
AR stationarity test
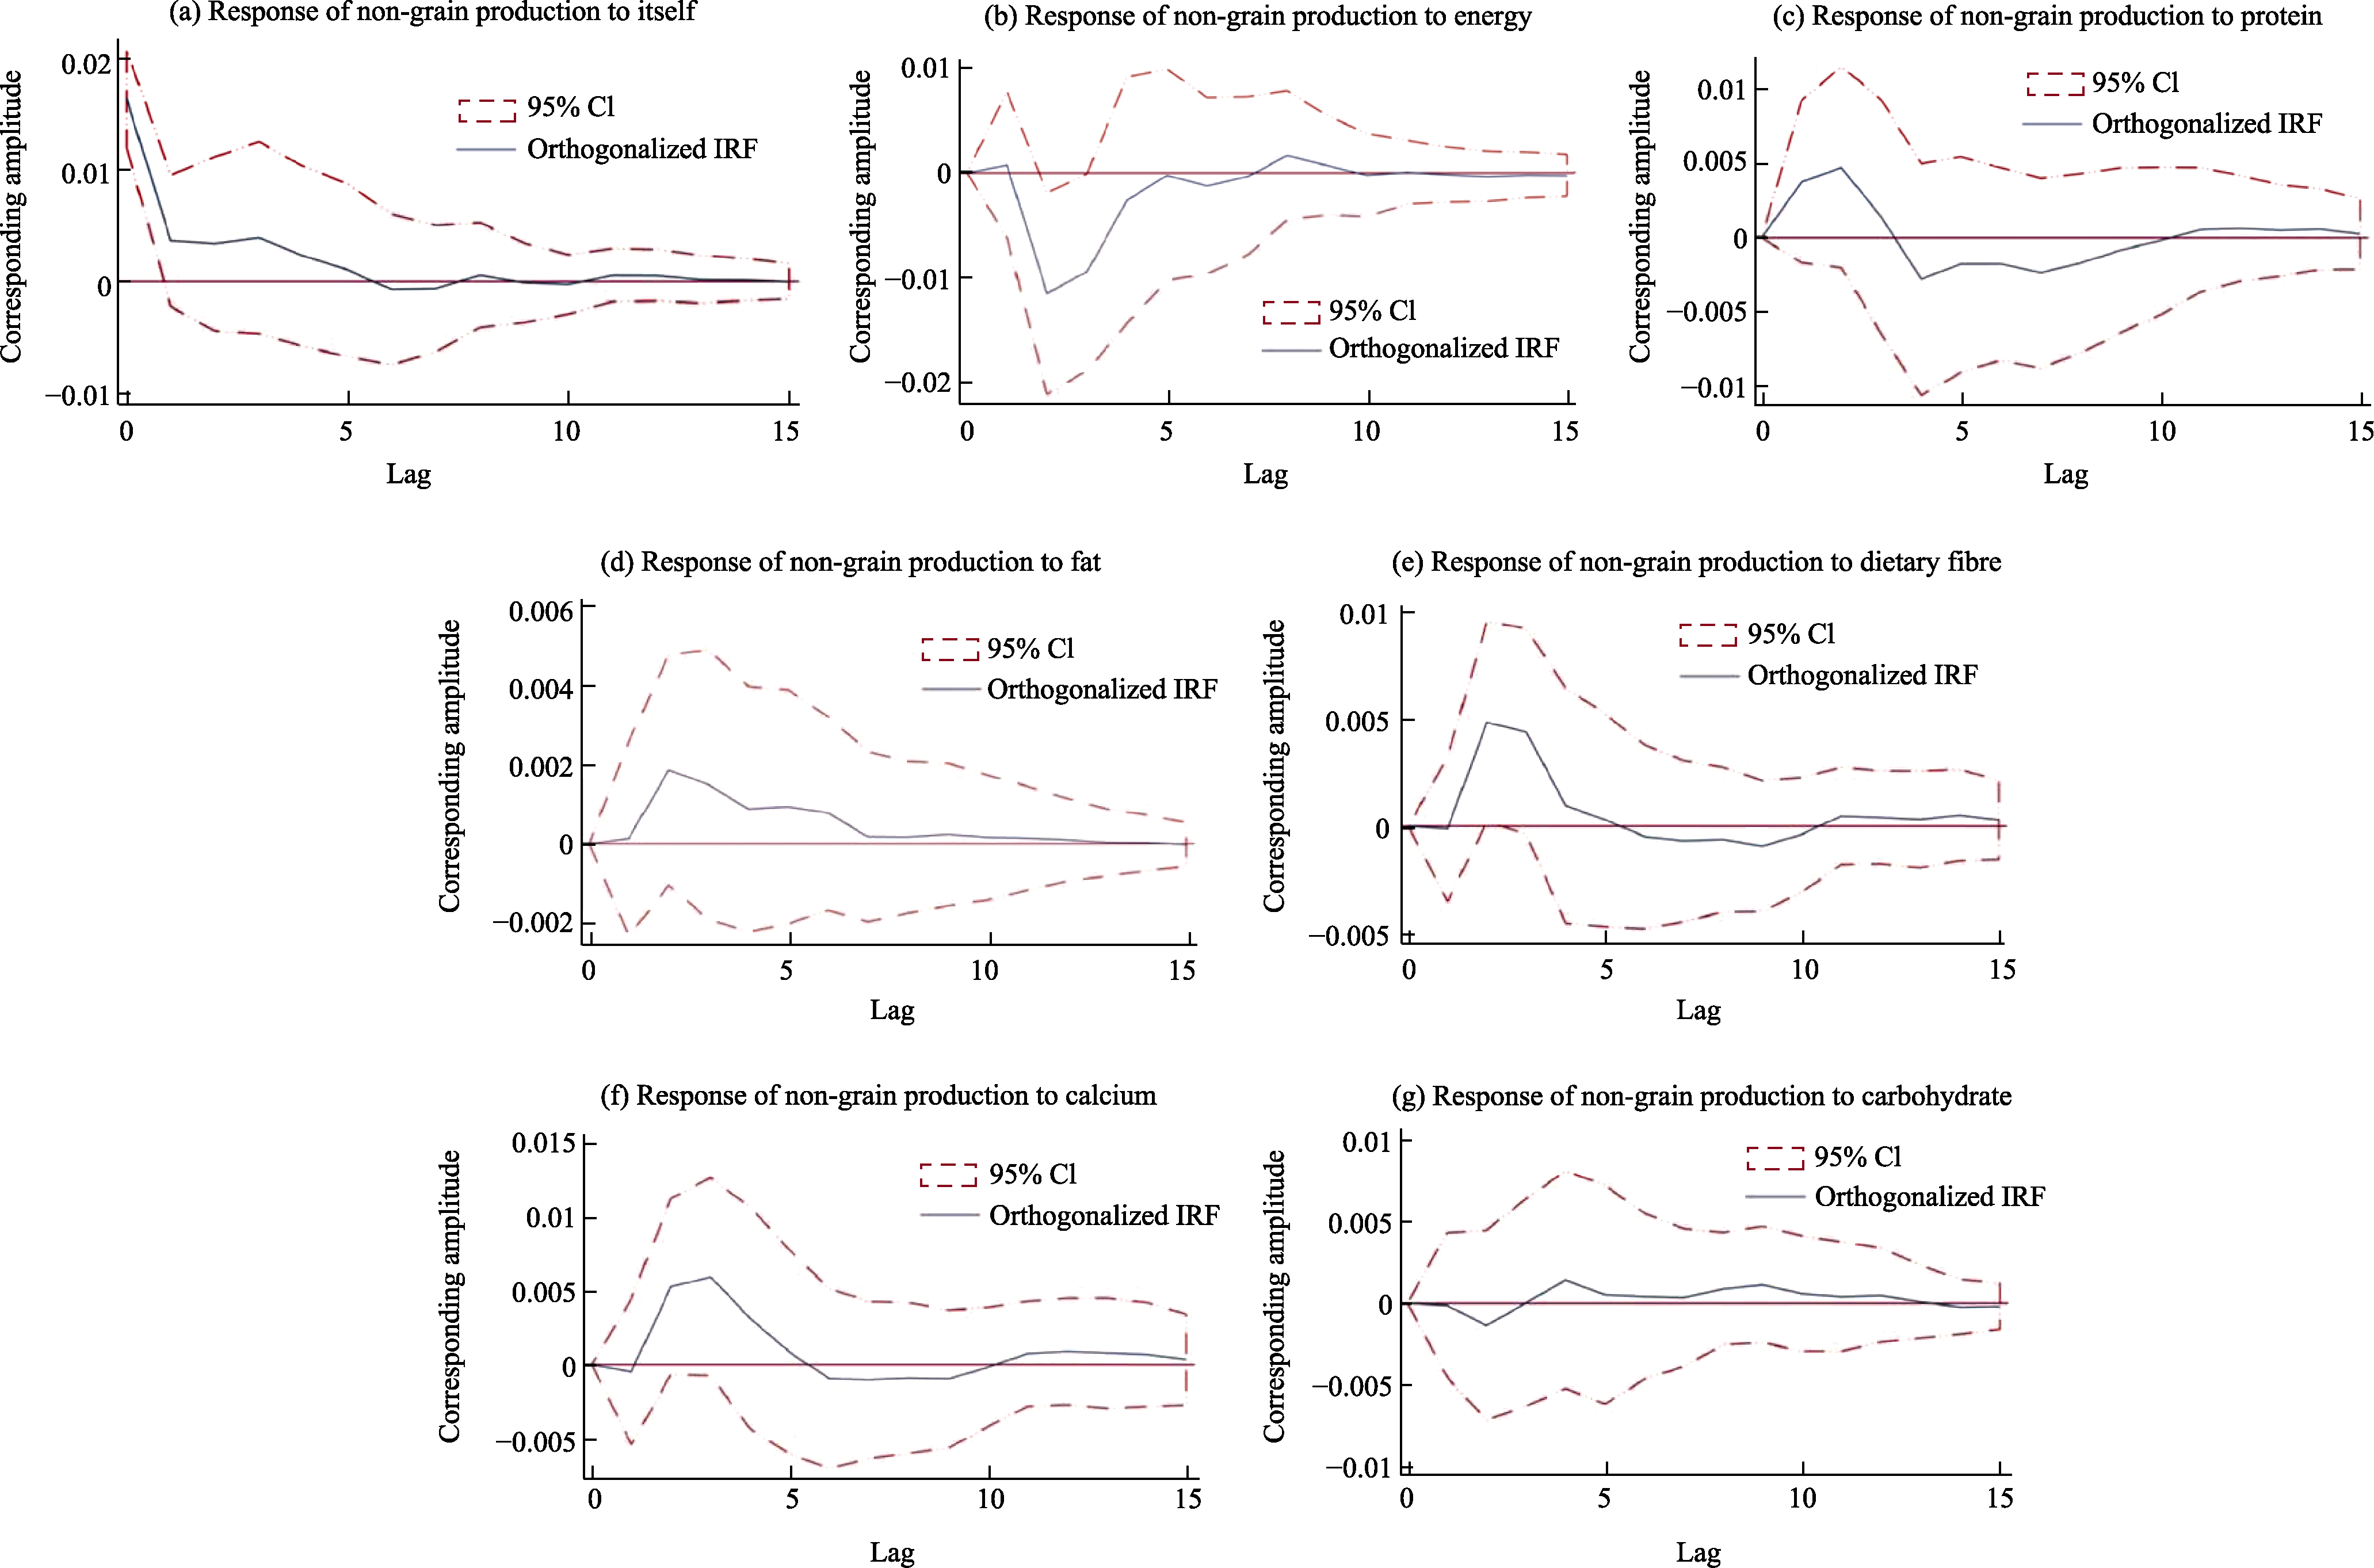
Fig. 6
Impulse responses of non-grain production to dietary nutrients
Note: In each graph, the horizontal coordinate is the number of lag periods, the vertical coordinate is the size of the response value, the solid line is the change trend of the response function, and the middle range of the dashed lines is the confidence interval. CI means confidence interval; IRF means impulse response function.
Table 6
Results of variance decomposition