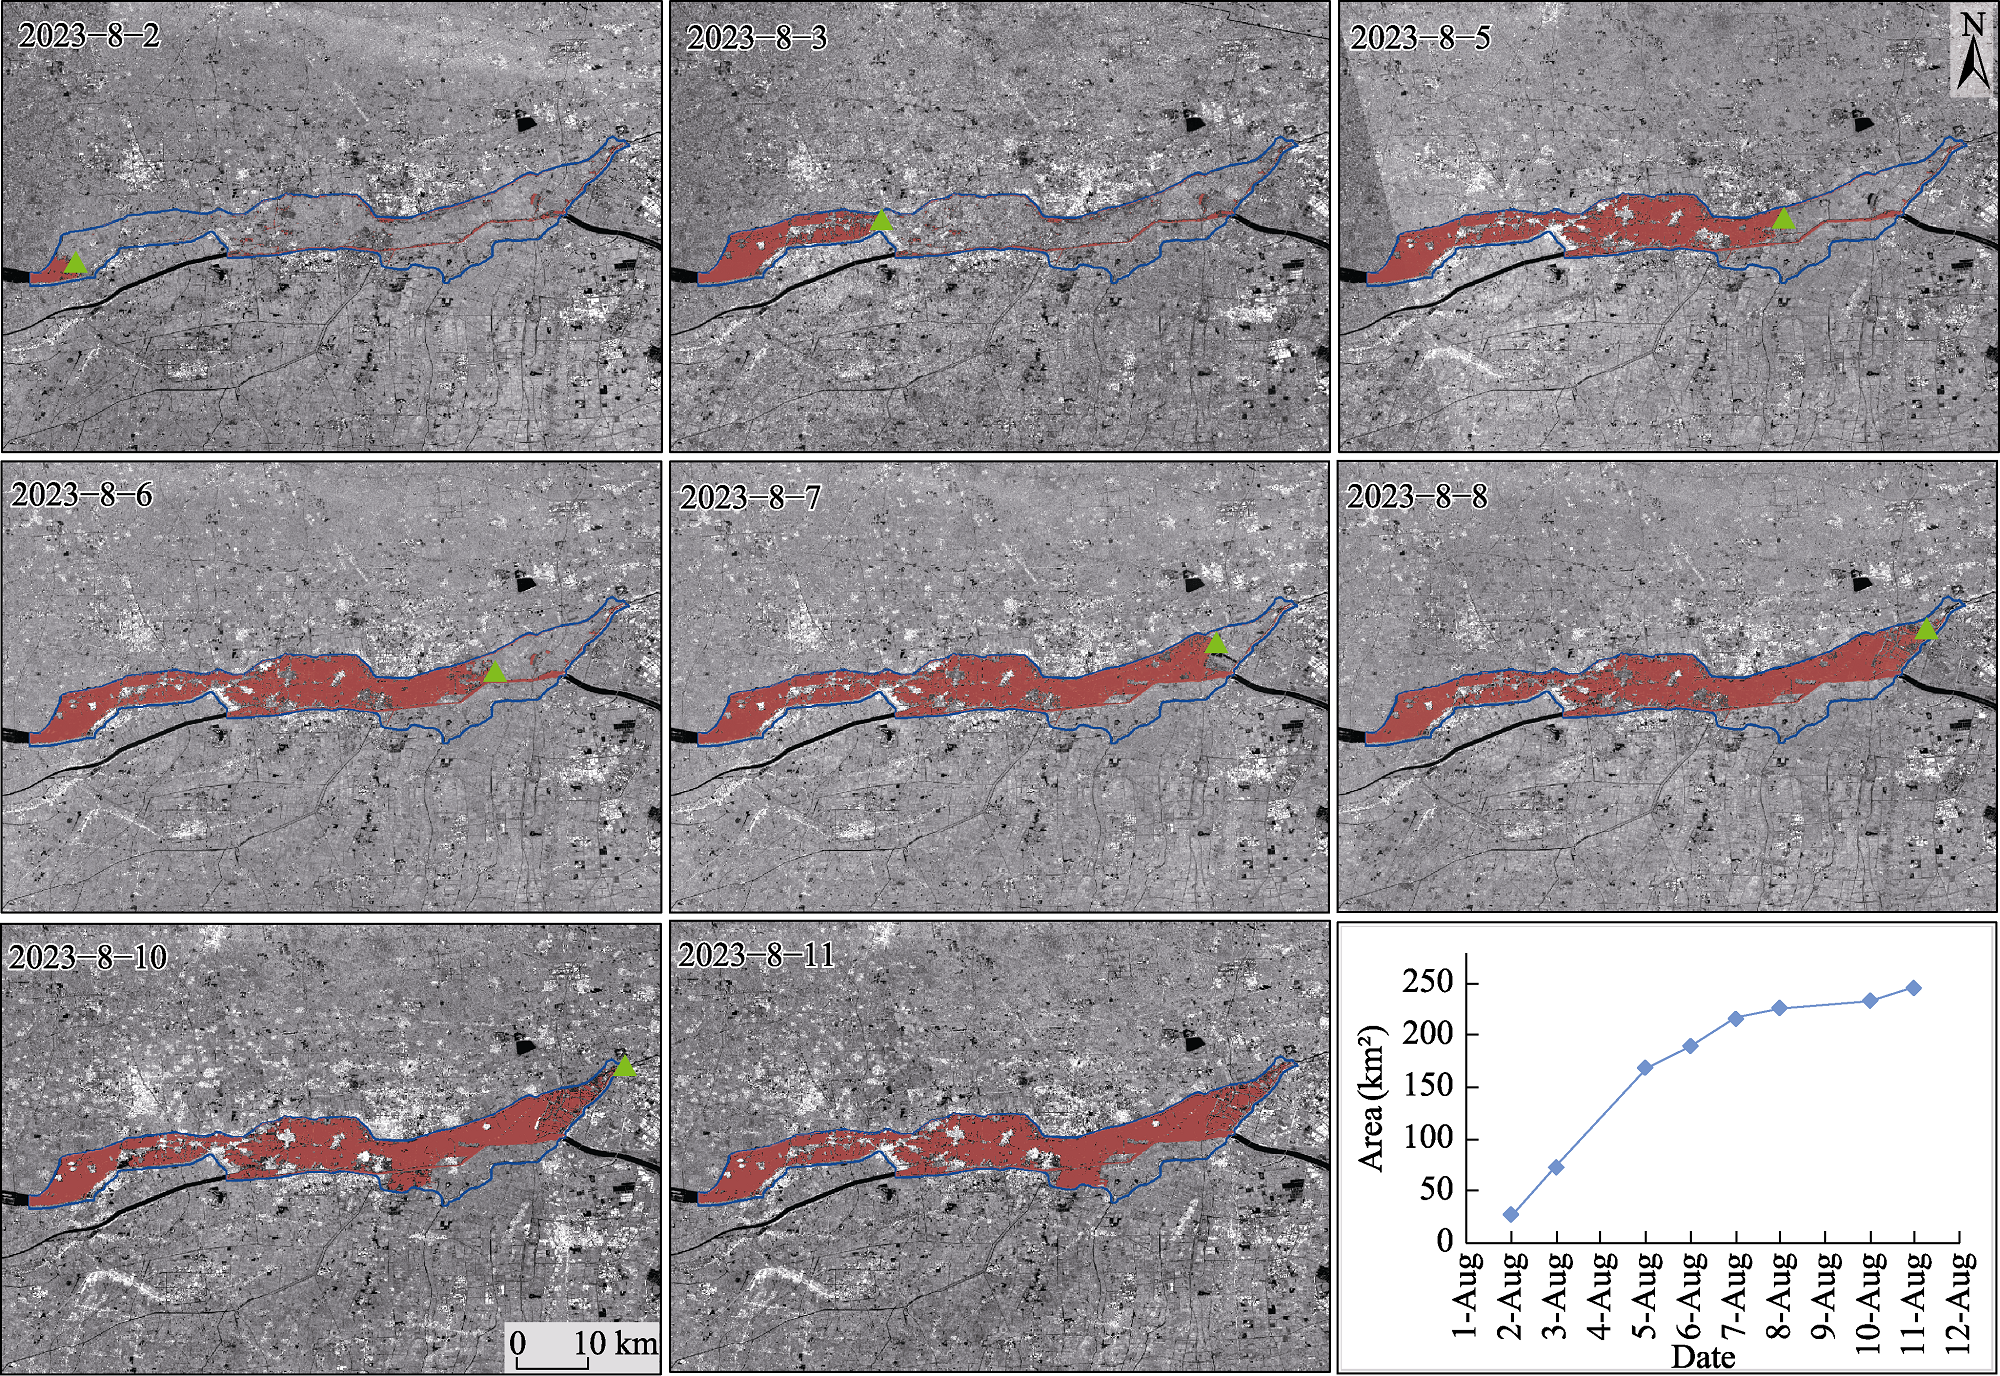
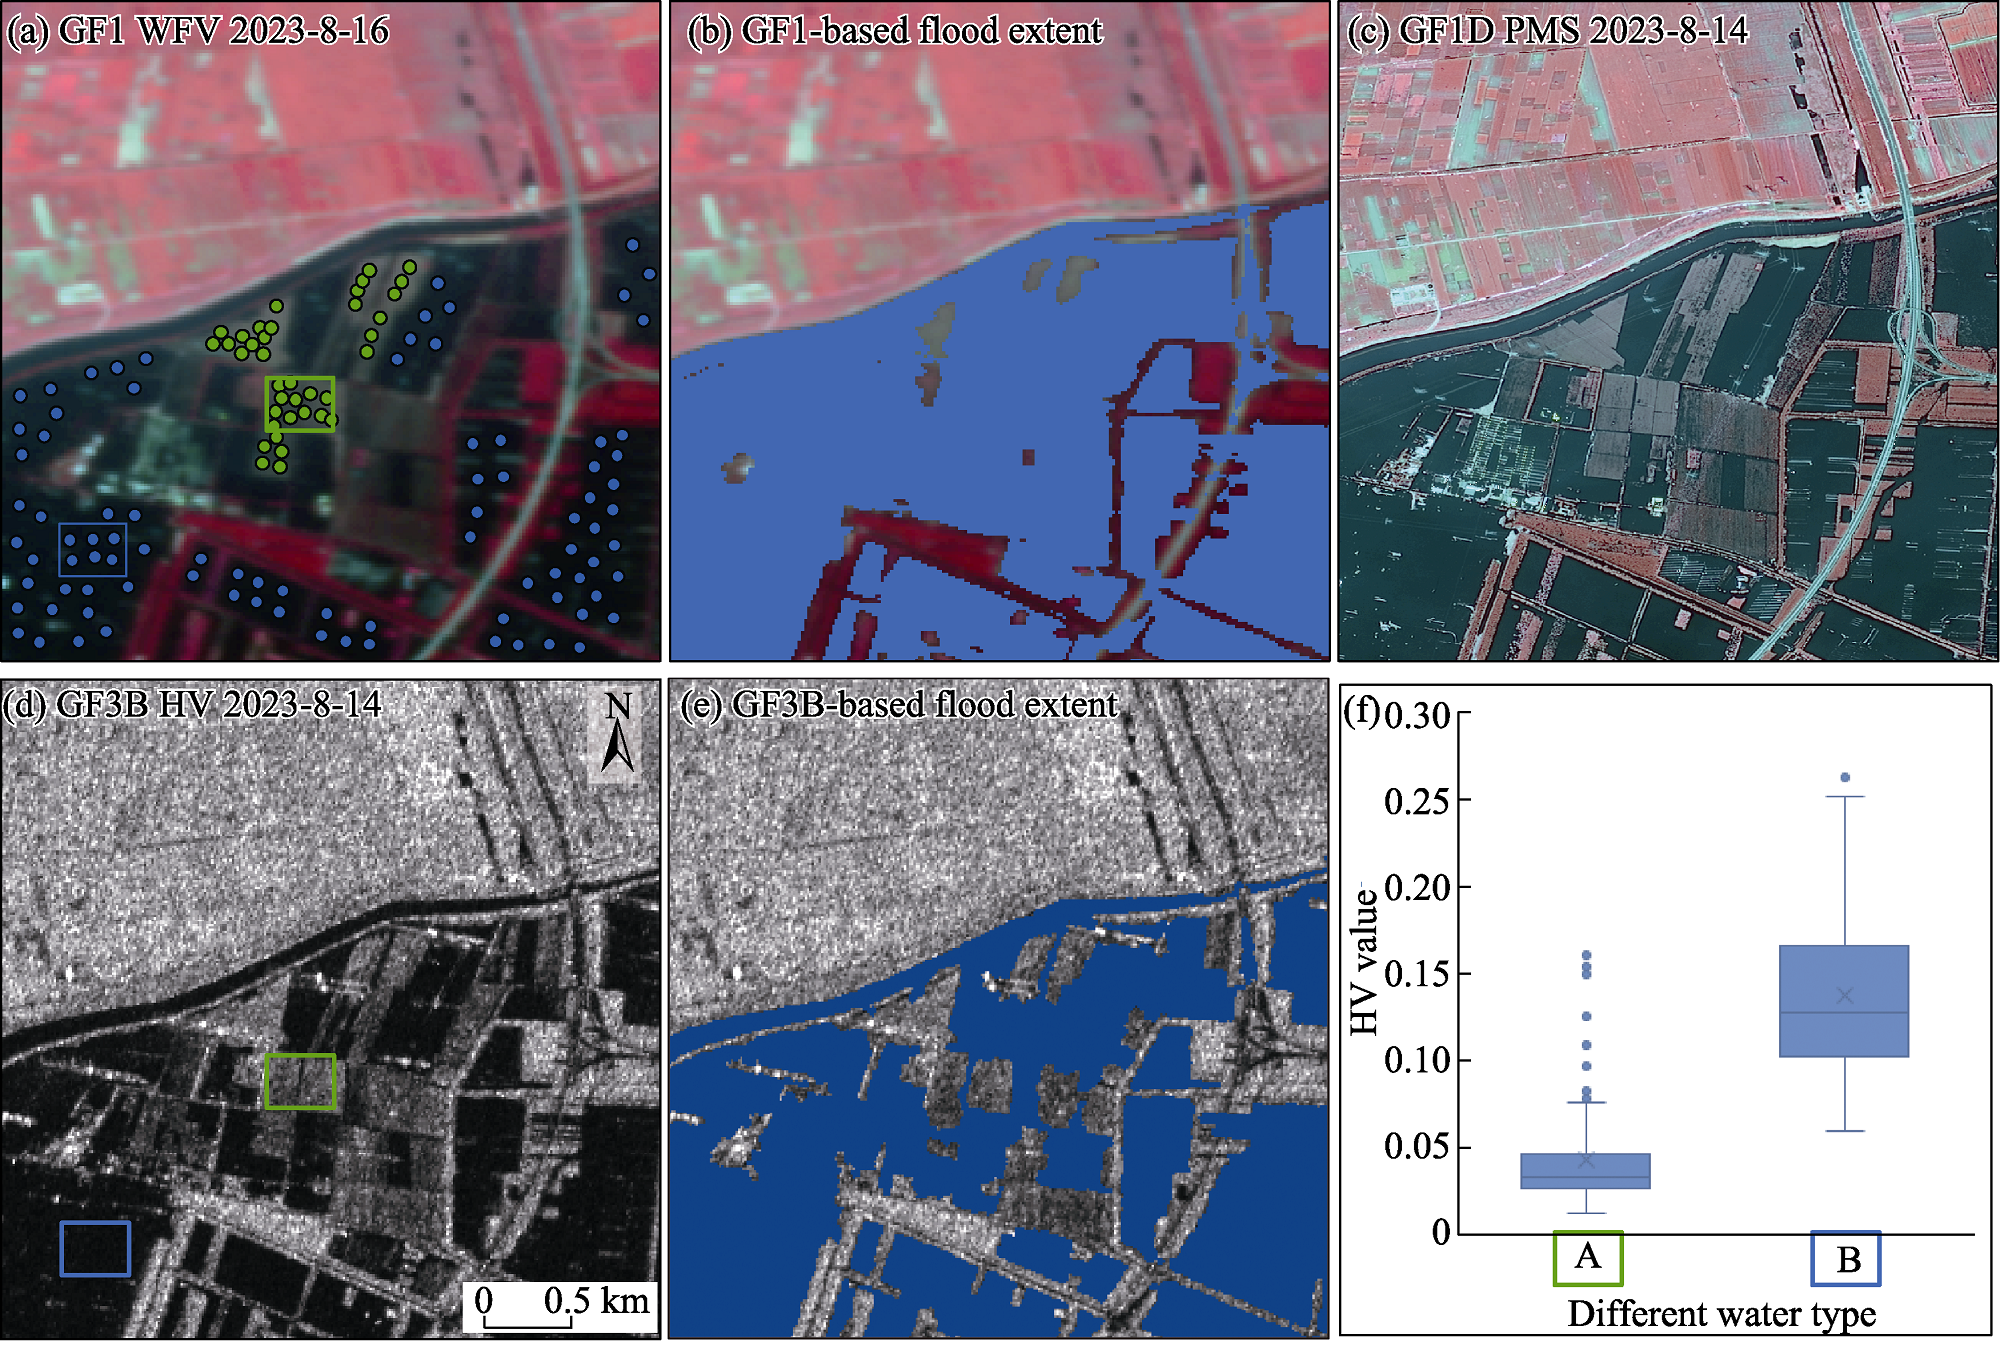
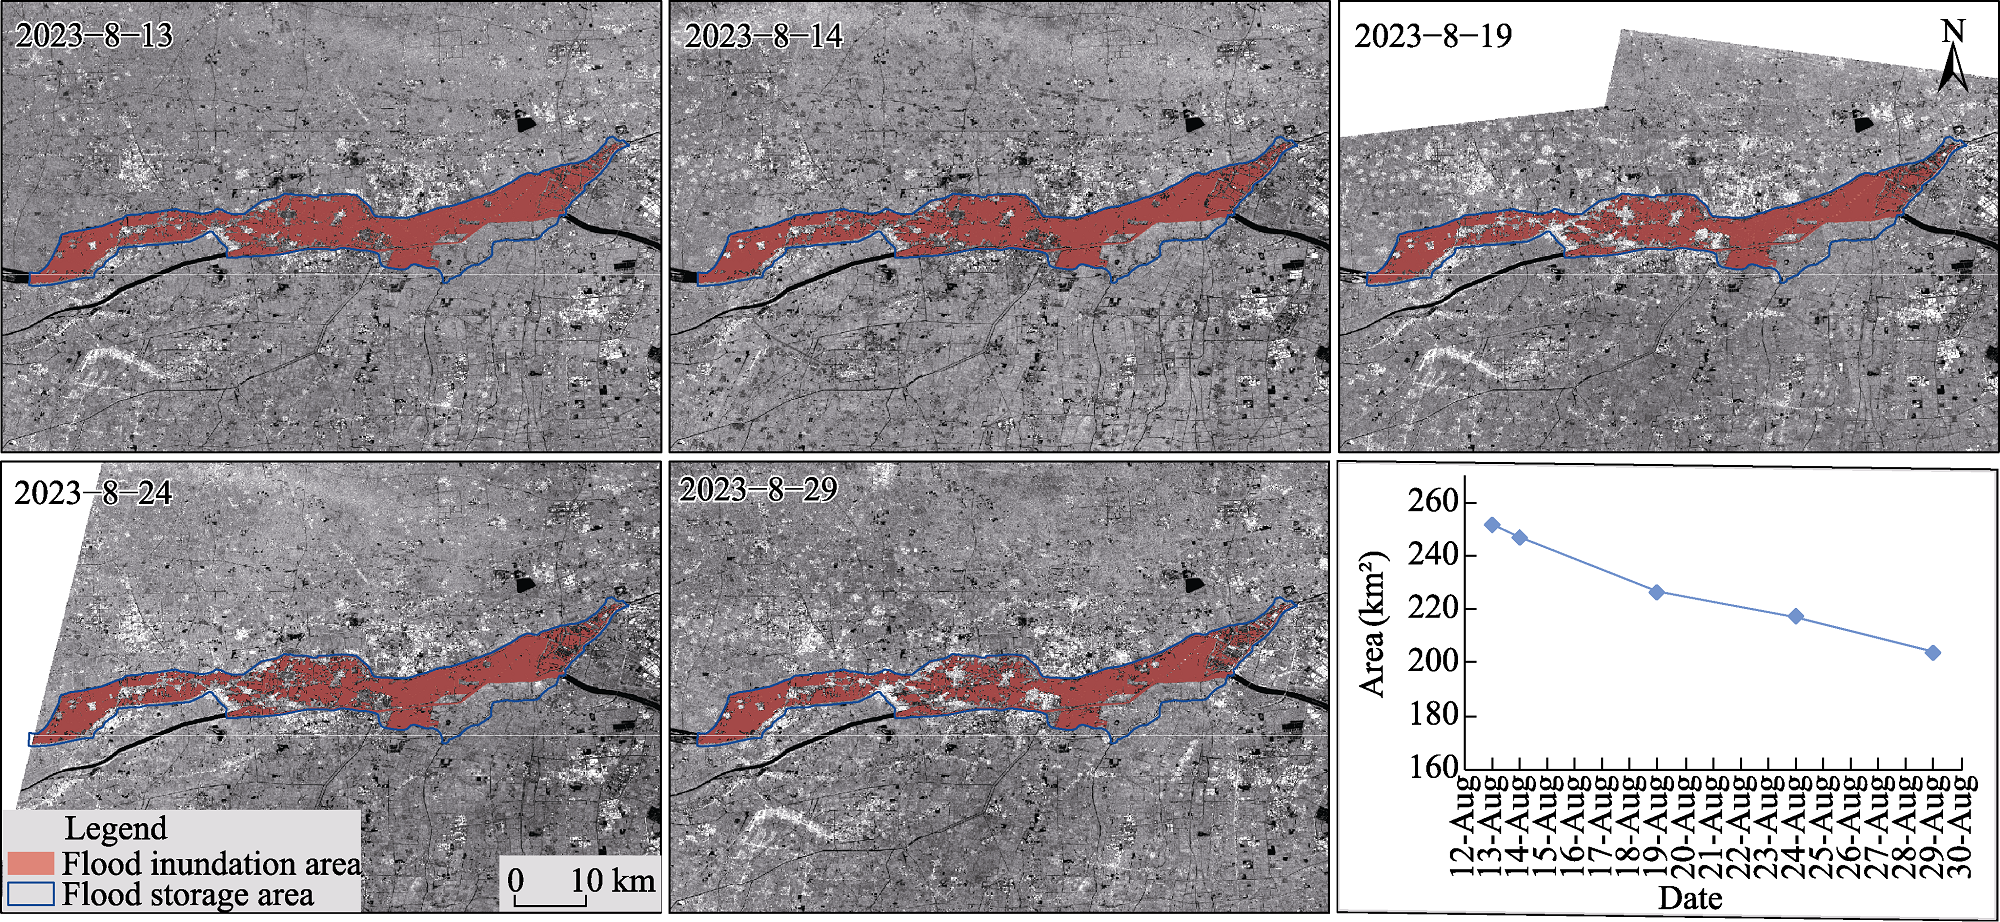
Fig. 5 Flood extent changes during the rapid expansion phase Note: The orange color in the figure images represents the flooded area, the blue border indicates the scope of the FDB, and the green triangles represent the positions of water intakes.
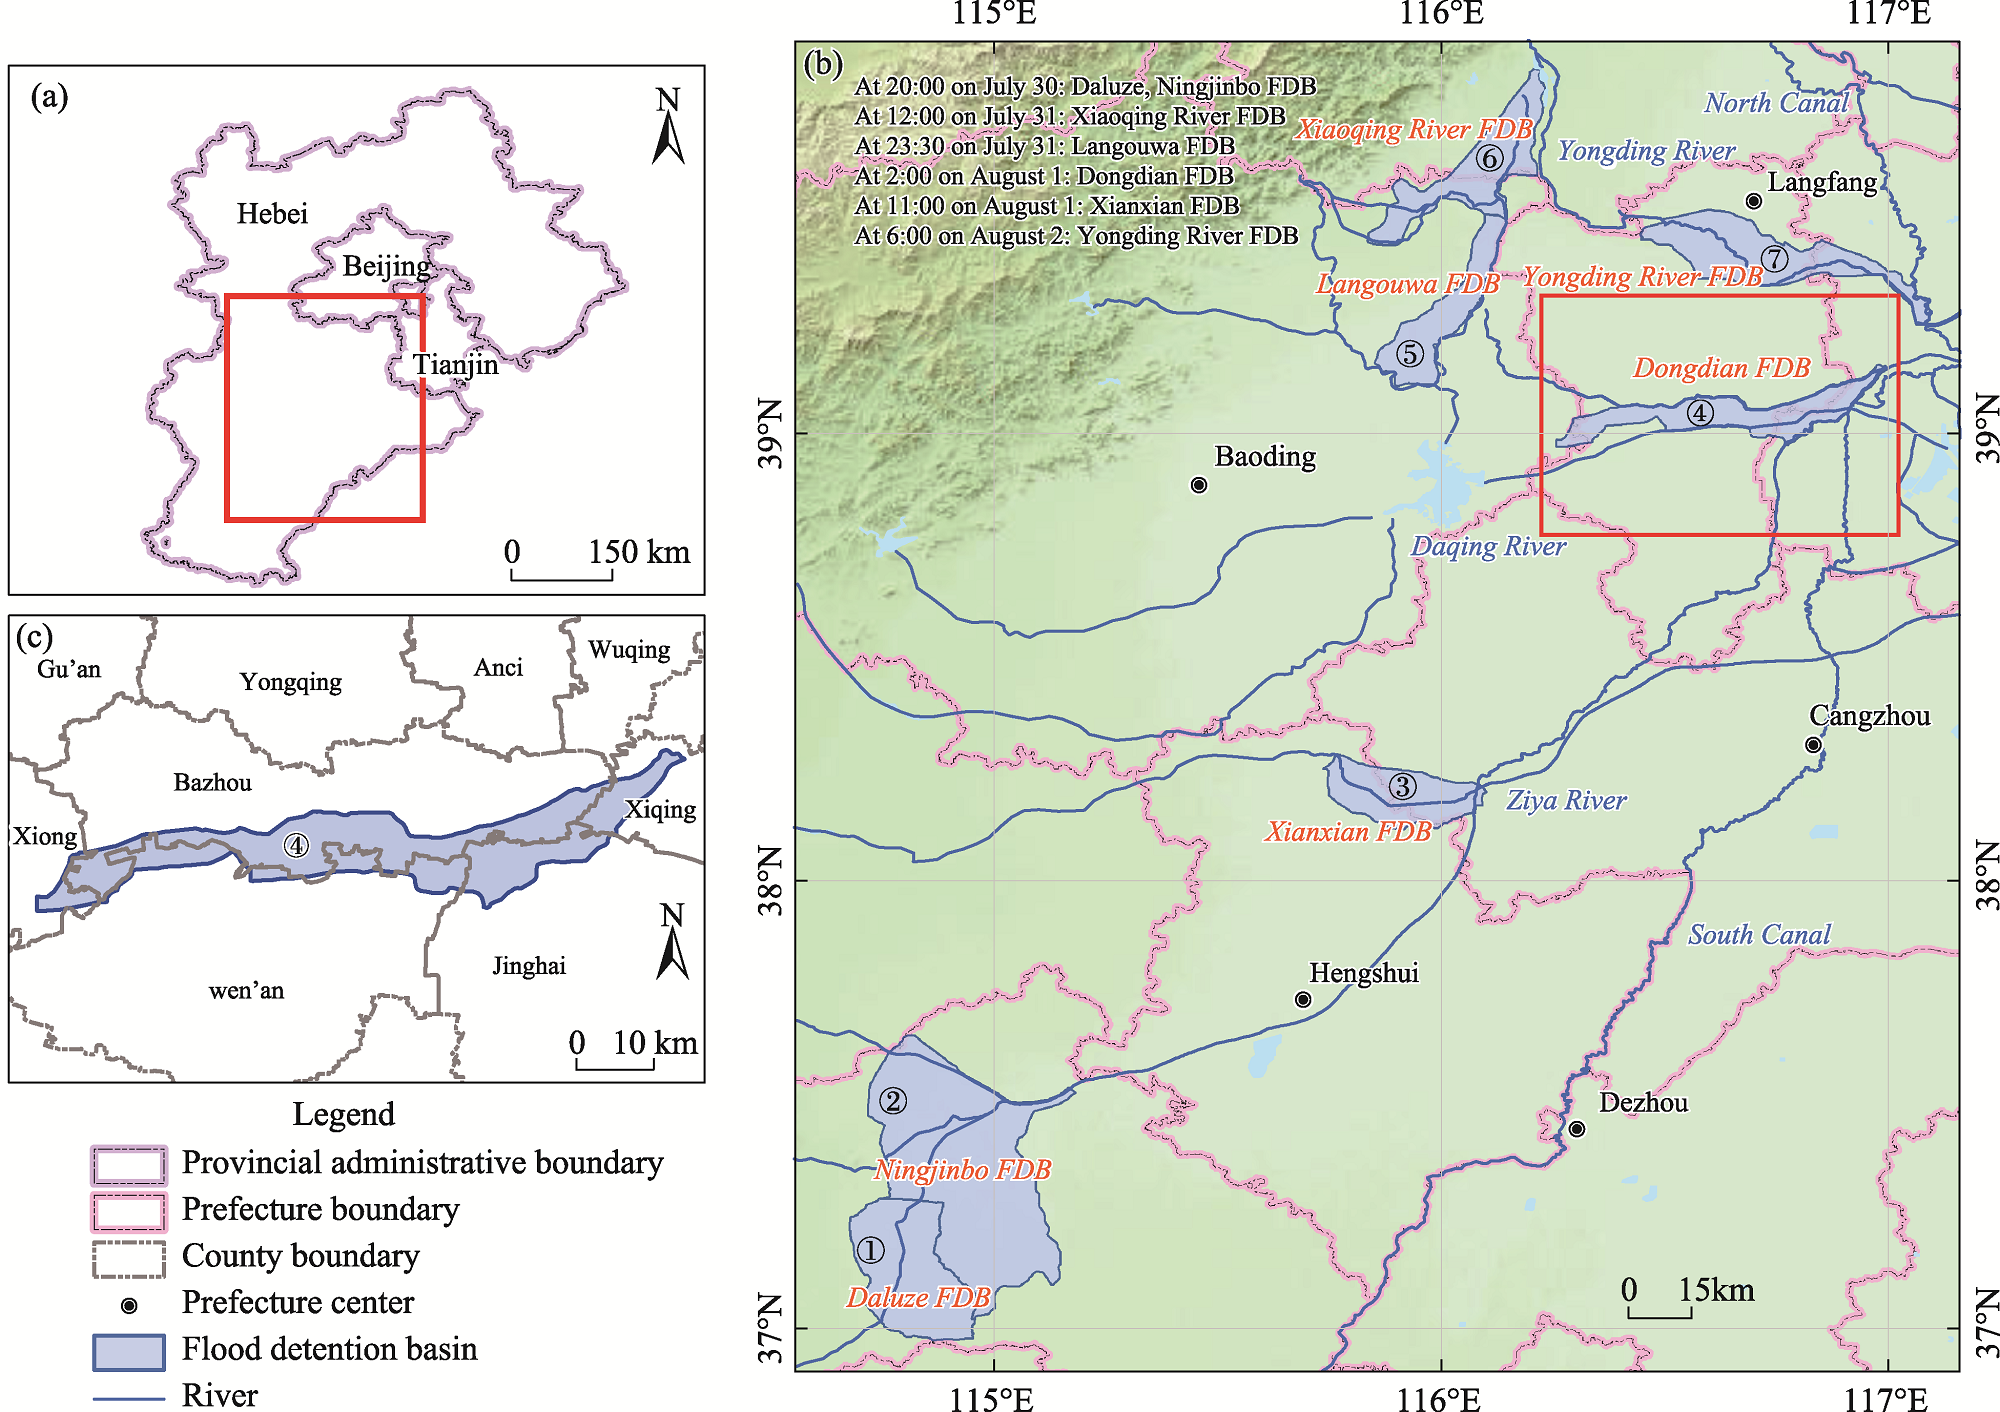
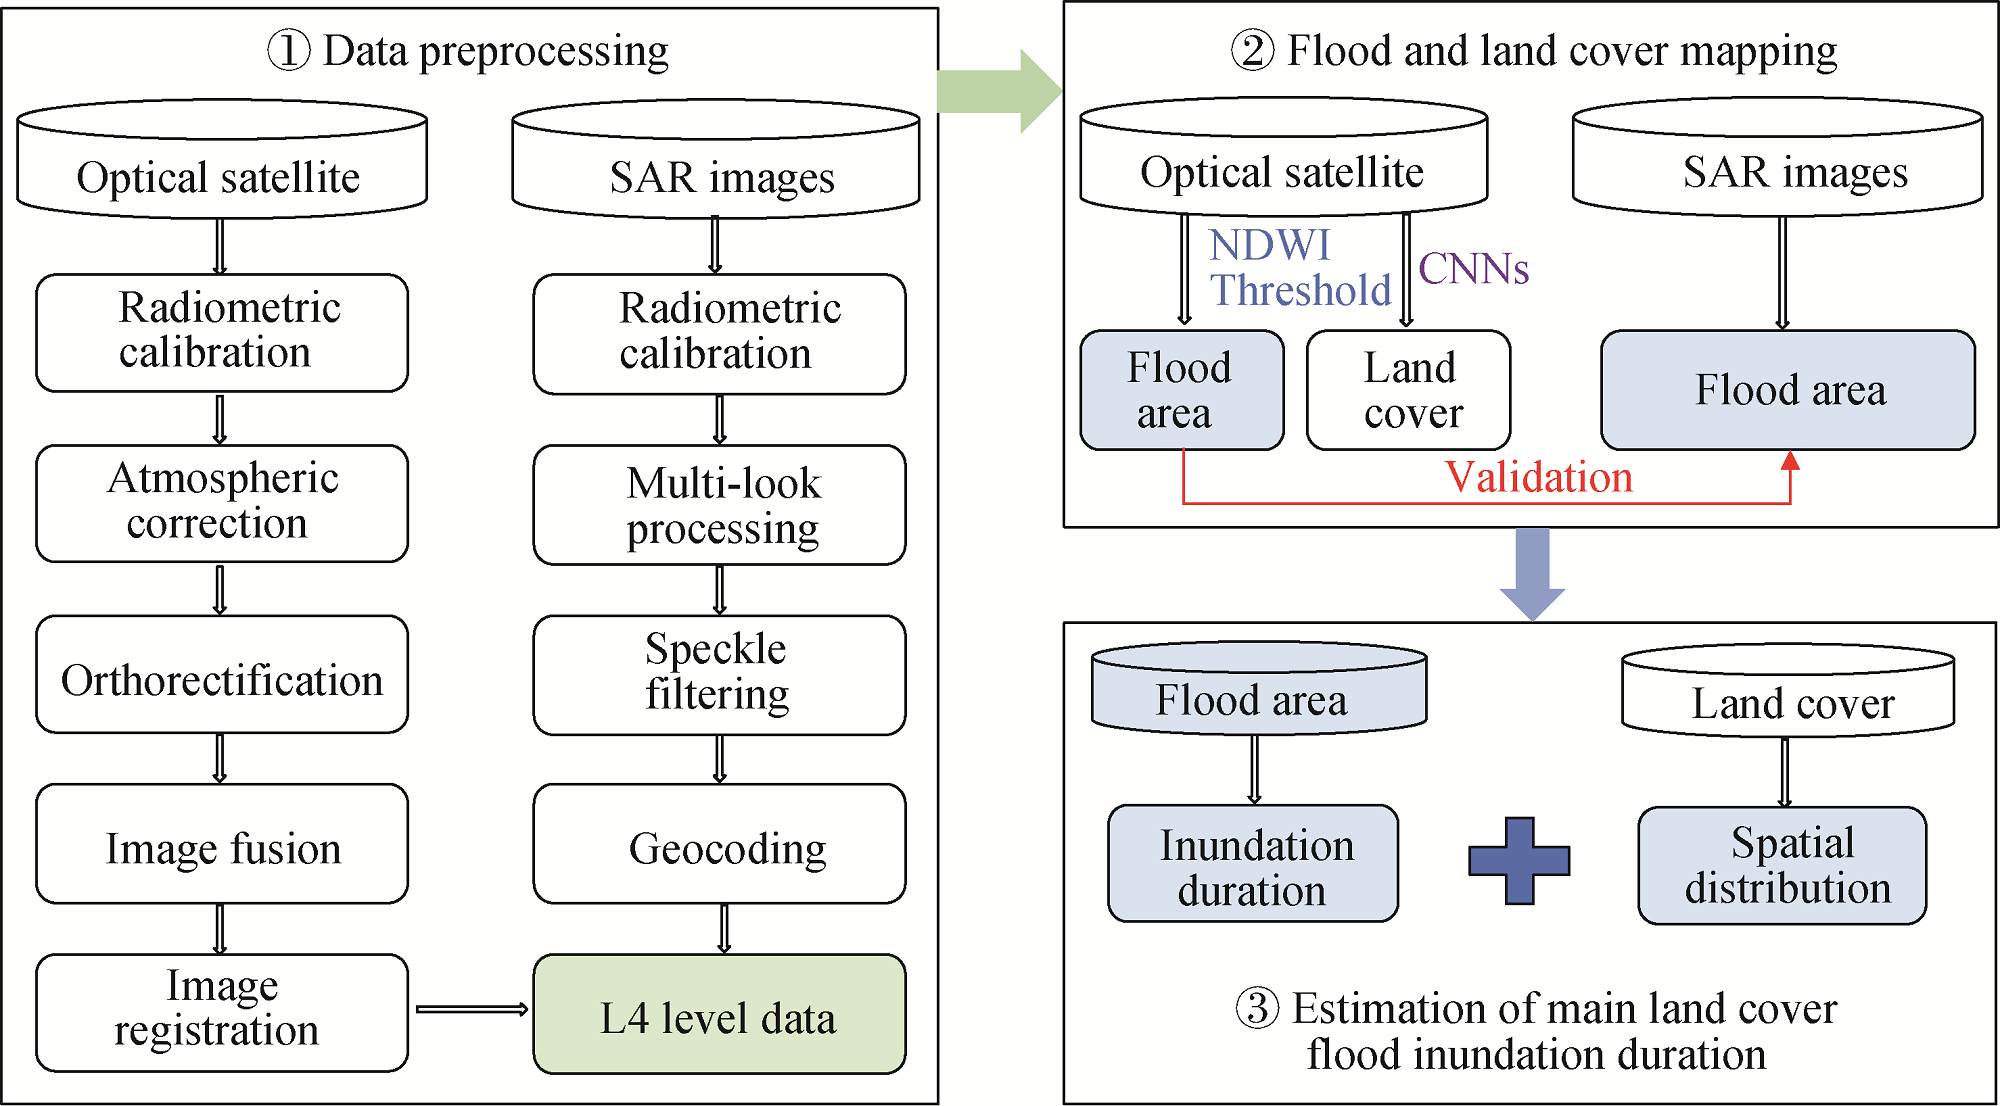
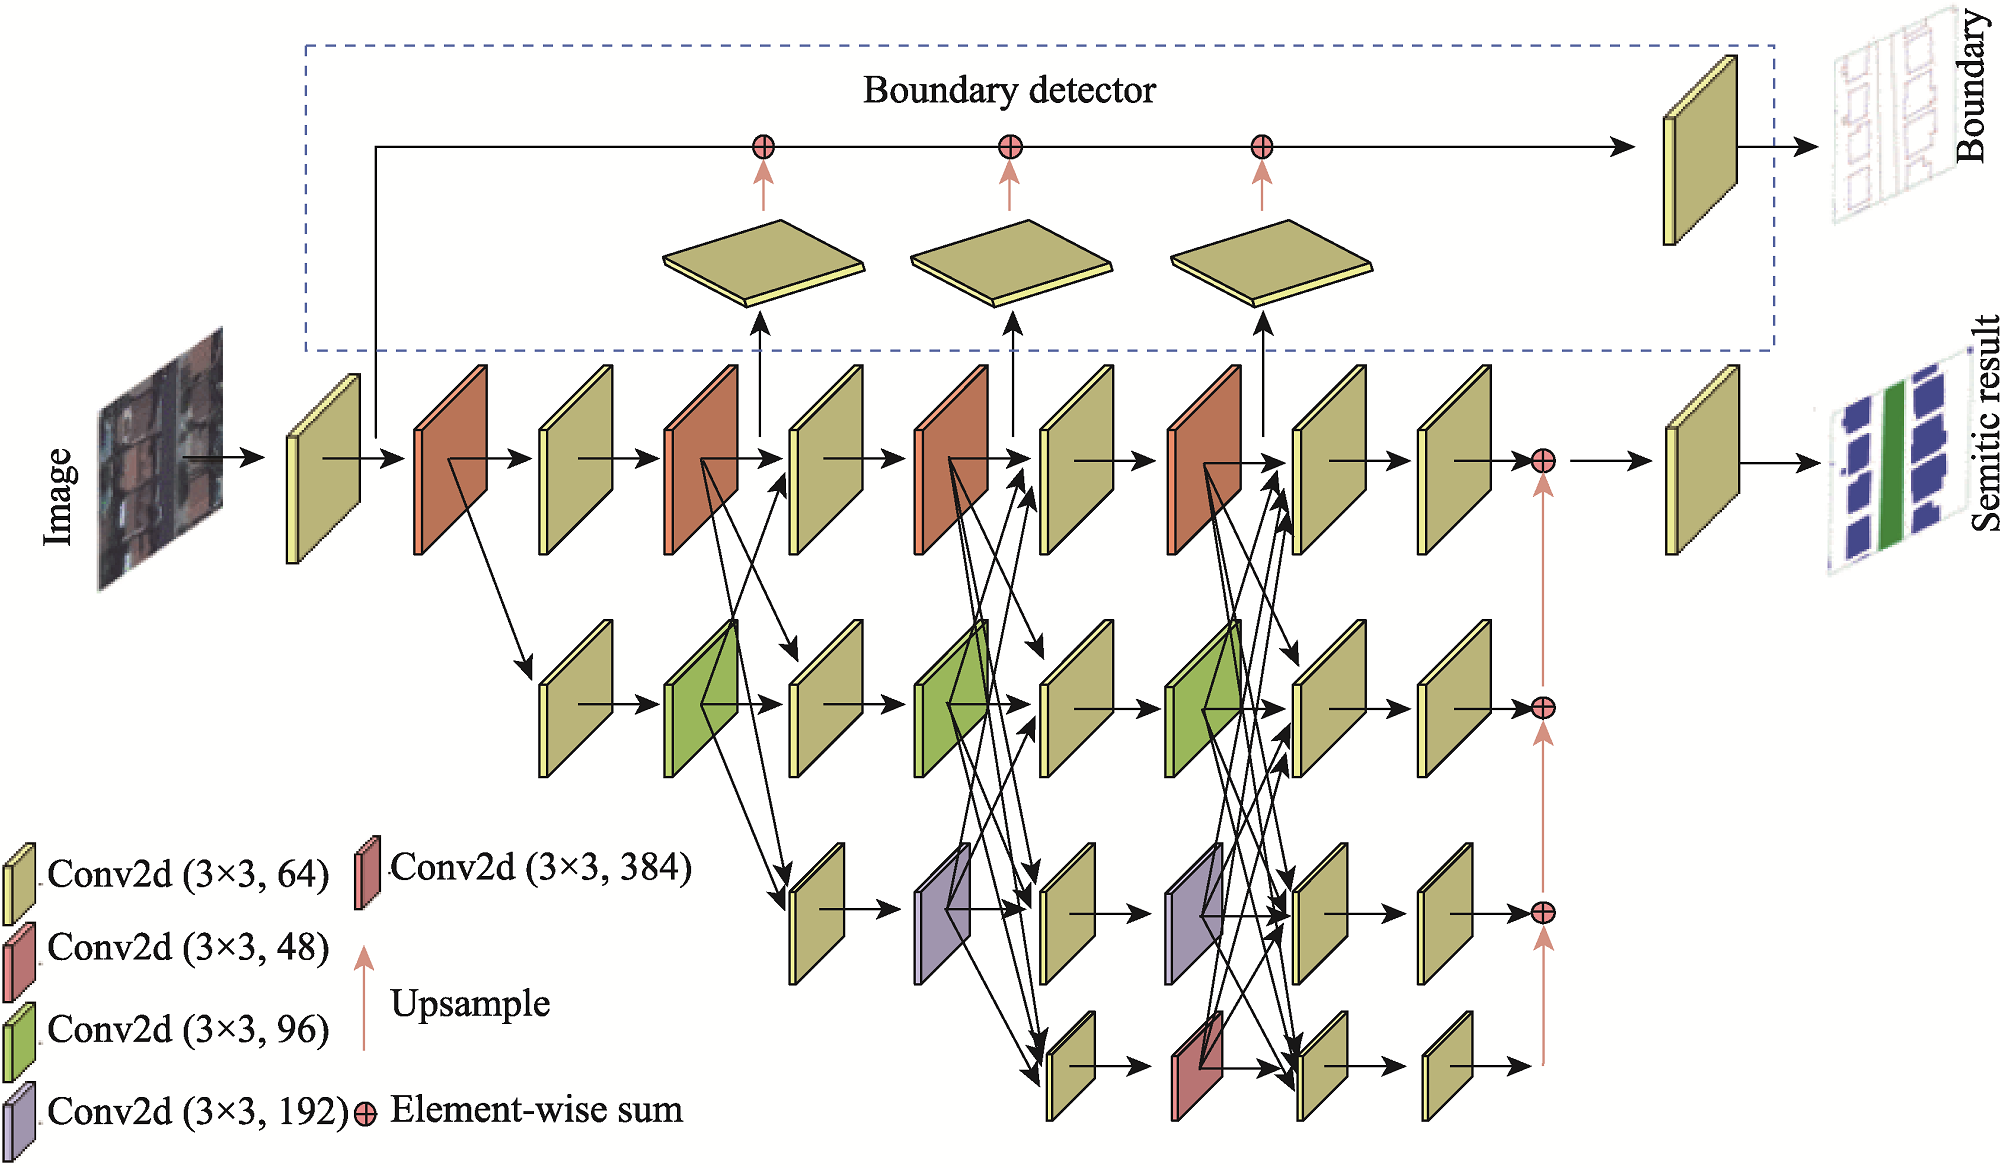
Other figure/table from this article