×
模态框(Modal)标题
在这里添加一些文本
Close
Close
Submit
Cancel
Confirm
×
模态框(Modal)标题
×
Journal
Article
Figure
Search
EN
中文
Home
About Journal
About Journal
Editorial Policies
Indexed in
Awards
Editorial Board
Guide for Authors
Research articles and review
Scientific data paper
Copyright Transfer Statement
Collections
Special Issue
Topics
Browse
Current Issue
Online First
Archive
Highlights
Archive by Subject
Most Viewed
Most Download
Most Cited
E-mail Alert
RSS
Corrigendum
Subscribe
Contact us
EN
中文
Figure/Table detail
Chinese Satellite-based Flood Mapping and Damage Assessment in Dongdian Flood Detention Basin, China
LIU Ming, JIN Shengyue, GU Changjun, LI Jingxin, LI Suju, LIU Longfei
Journal of Resources and Ecology
, 2024, 15(
5
): 1344-1357. DOI:
10.5814/j.issn.1674-764x.2024.05.021
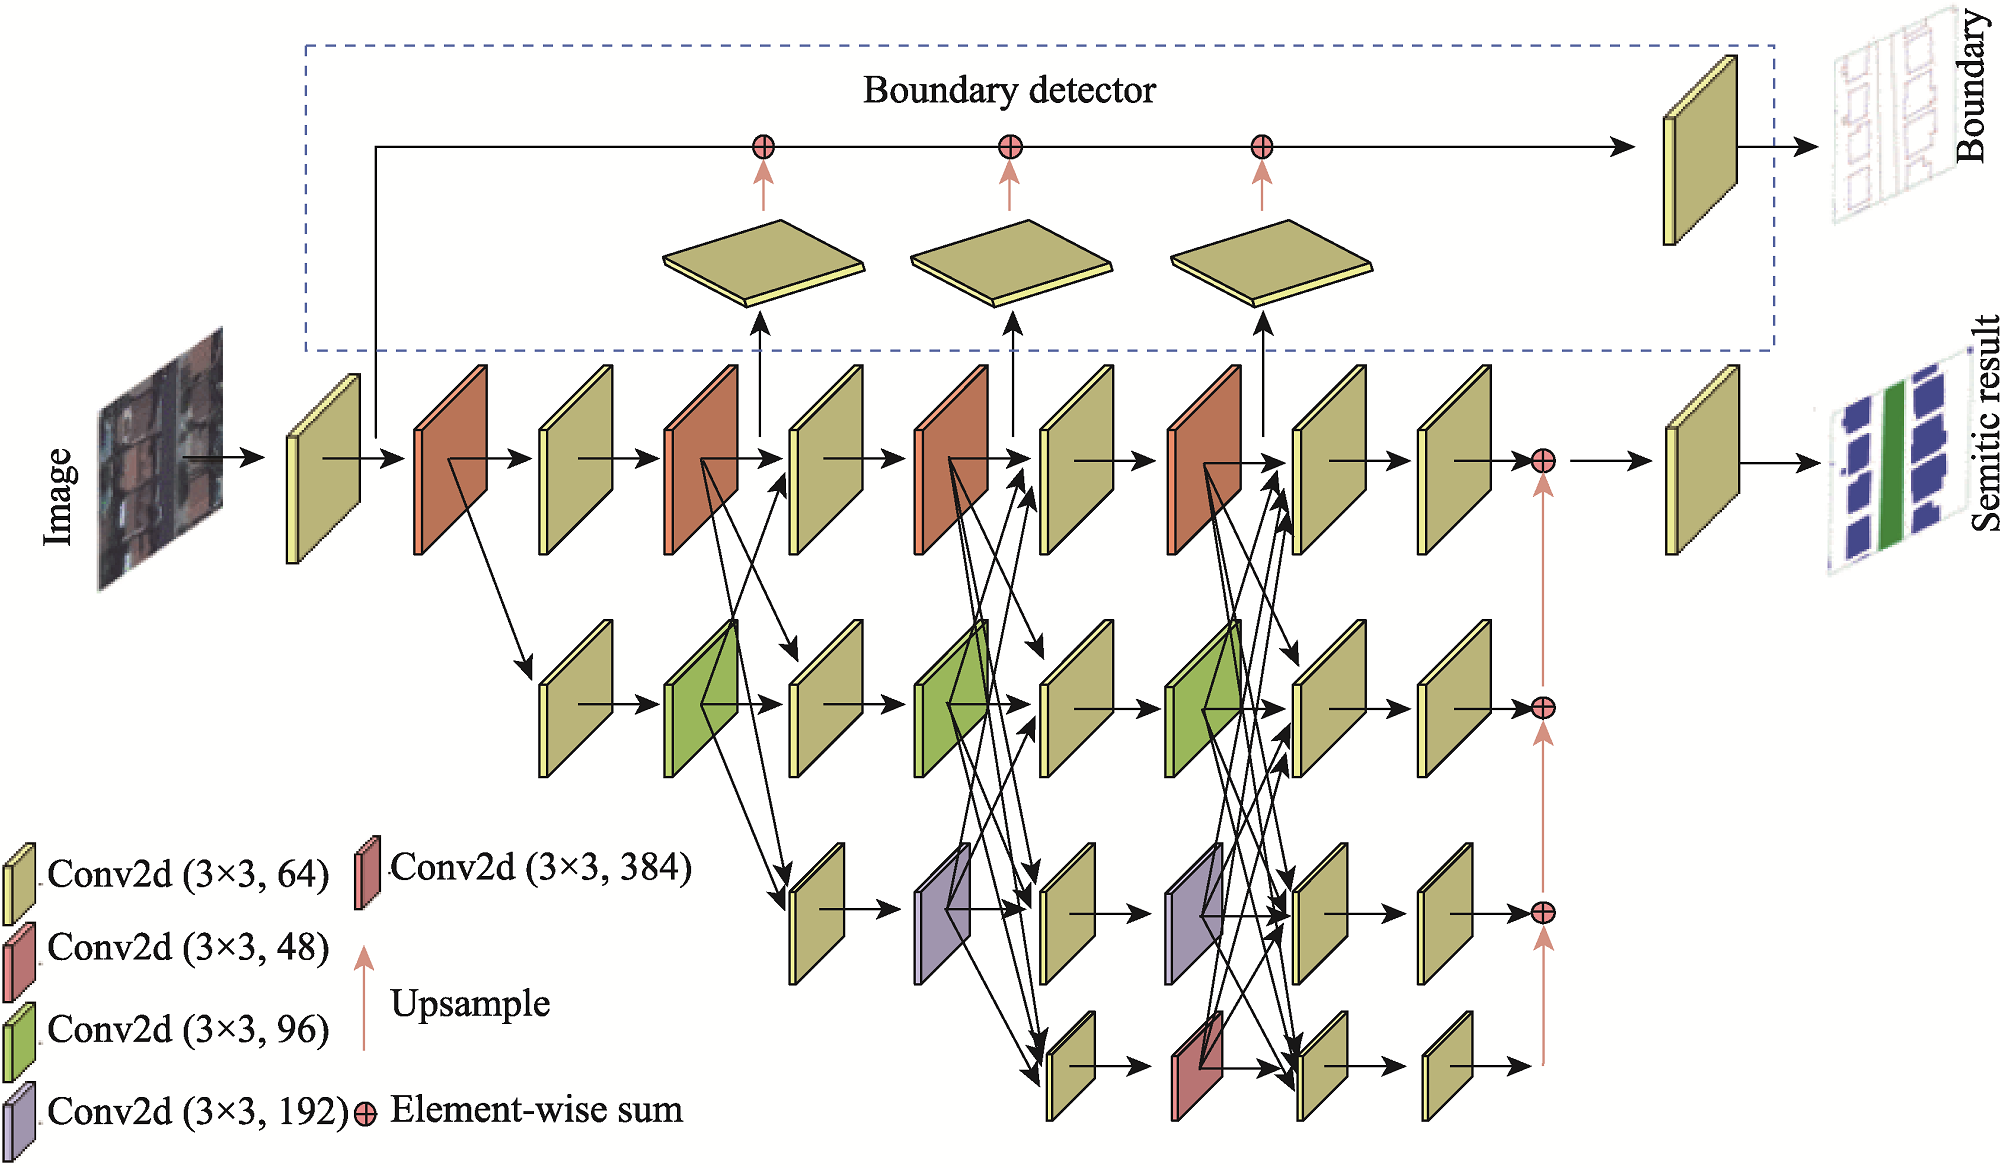
Fig. 3
Adaptive fine-grained segmentation network model for the building structure diagram
Other figure/table from this article
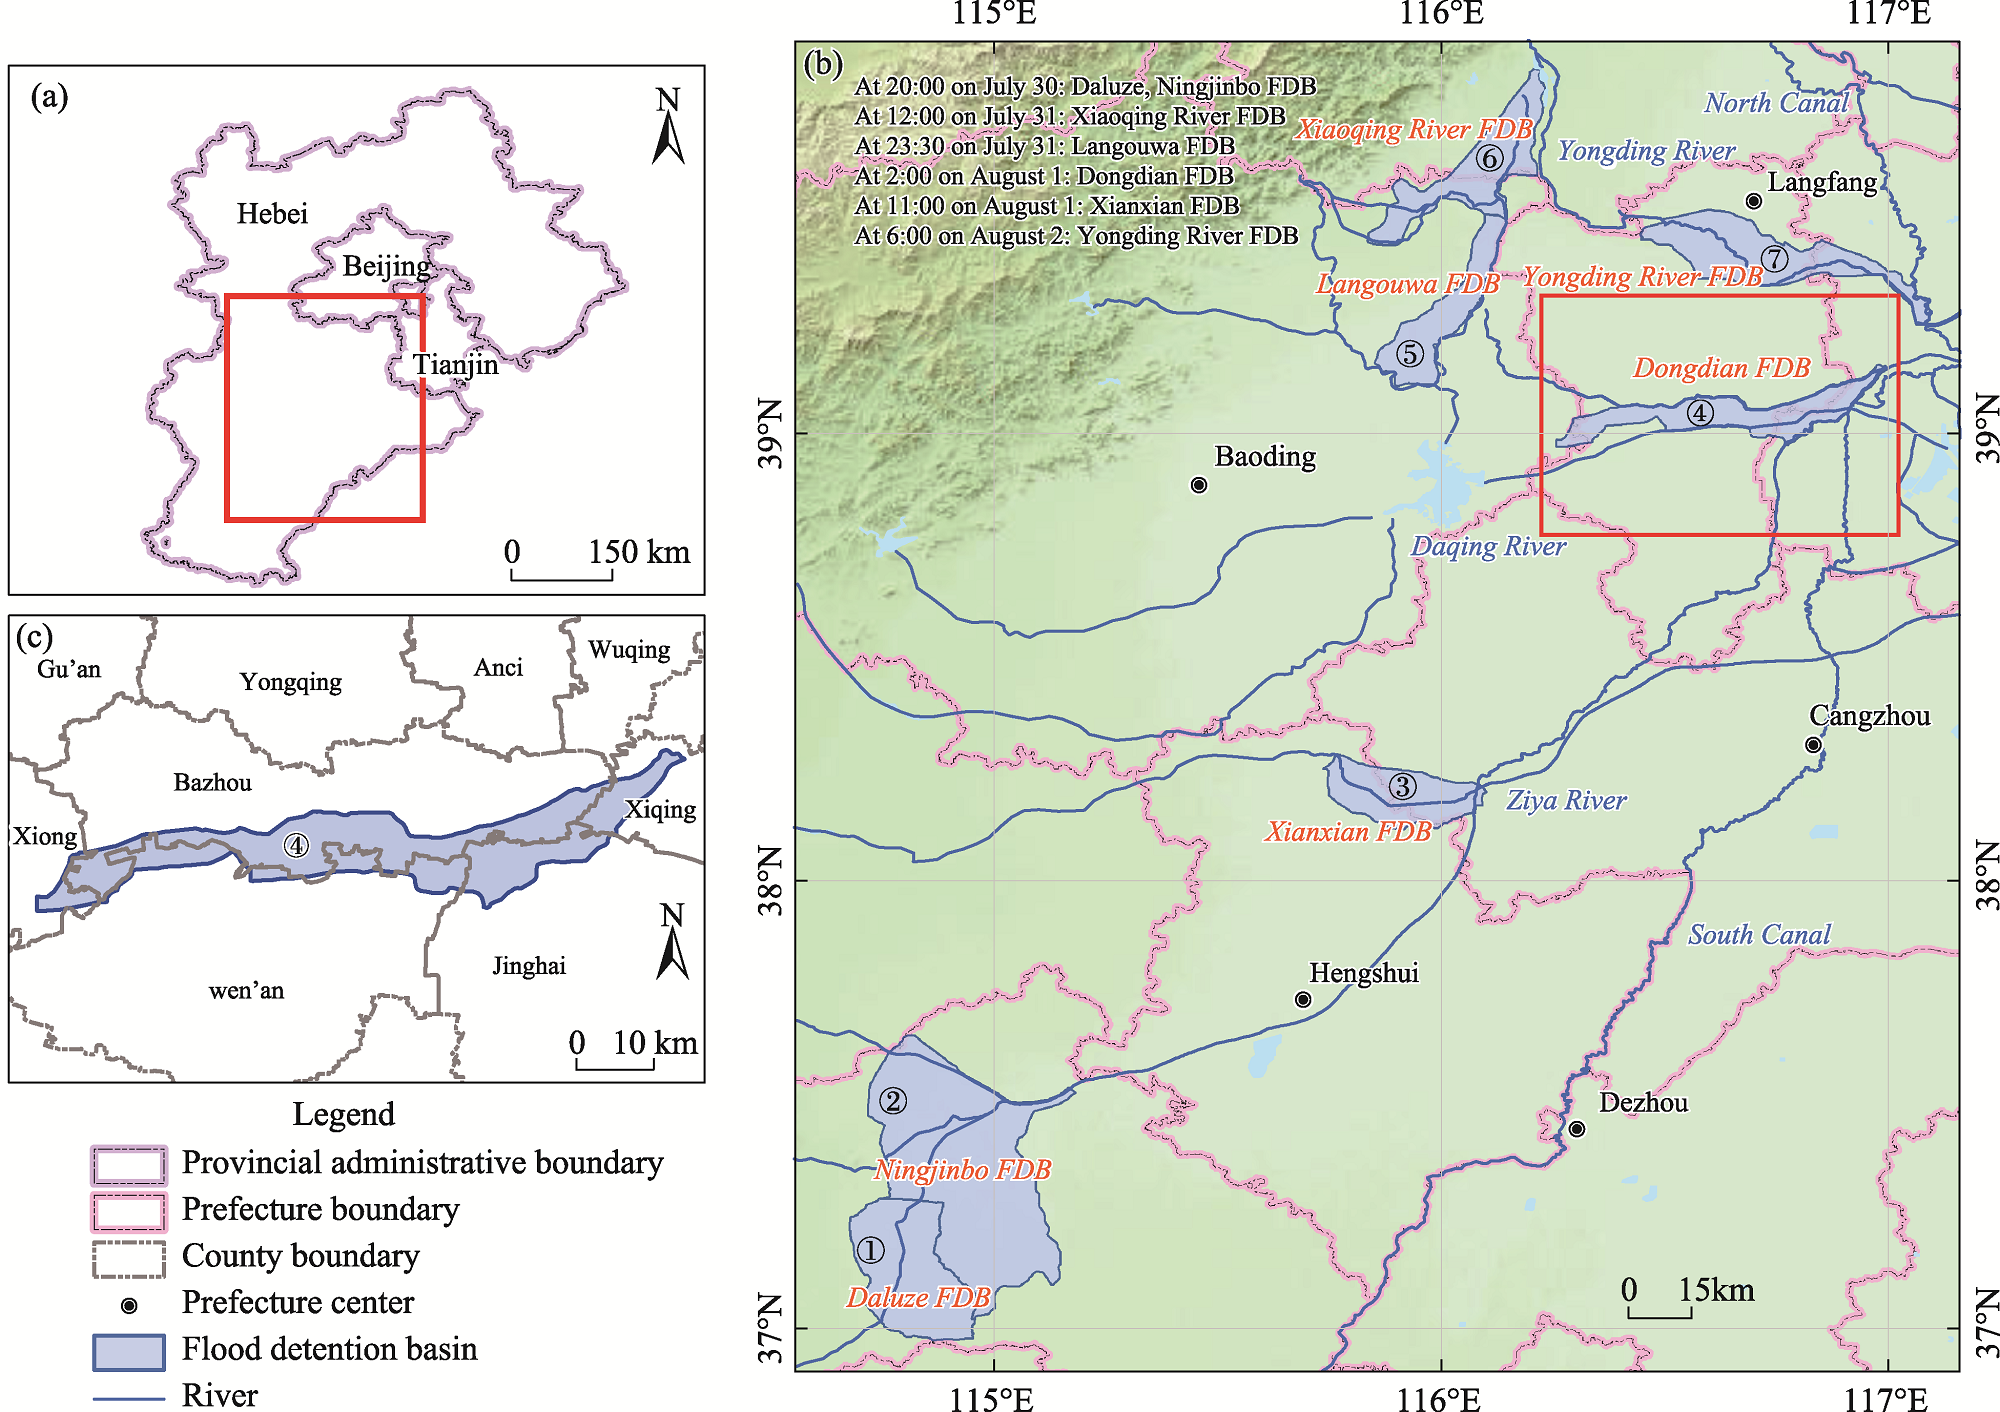
Fig. 1
(a) Map depicting the main flood-affected areas in this flooding event; (b) Location map and activation times of seven flood detention basins (FDBs), including ①Daluze, ②Ningjinbo, ③Xianxian, ④Dongdian, ⑤Langouwa, ⑥Xiaoqing River and ⑦Yongding River; (c) Location map of Dongdian FDB
Table 1
Satellite images during the flood disaster process
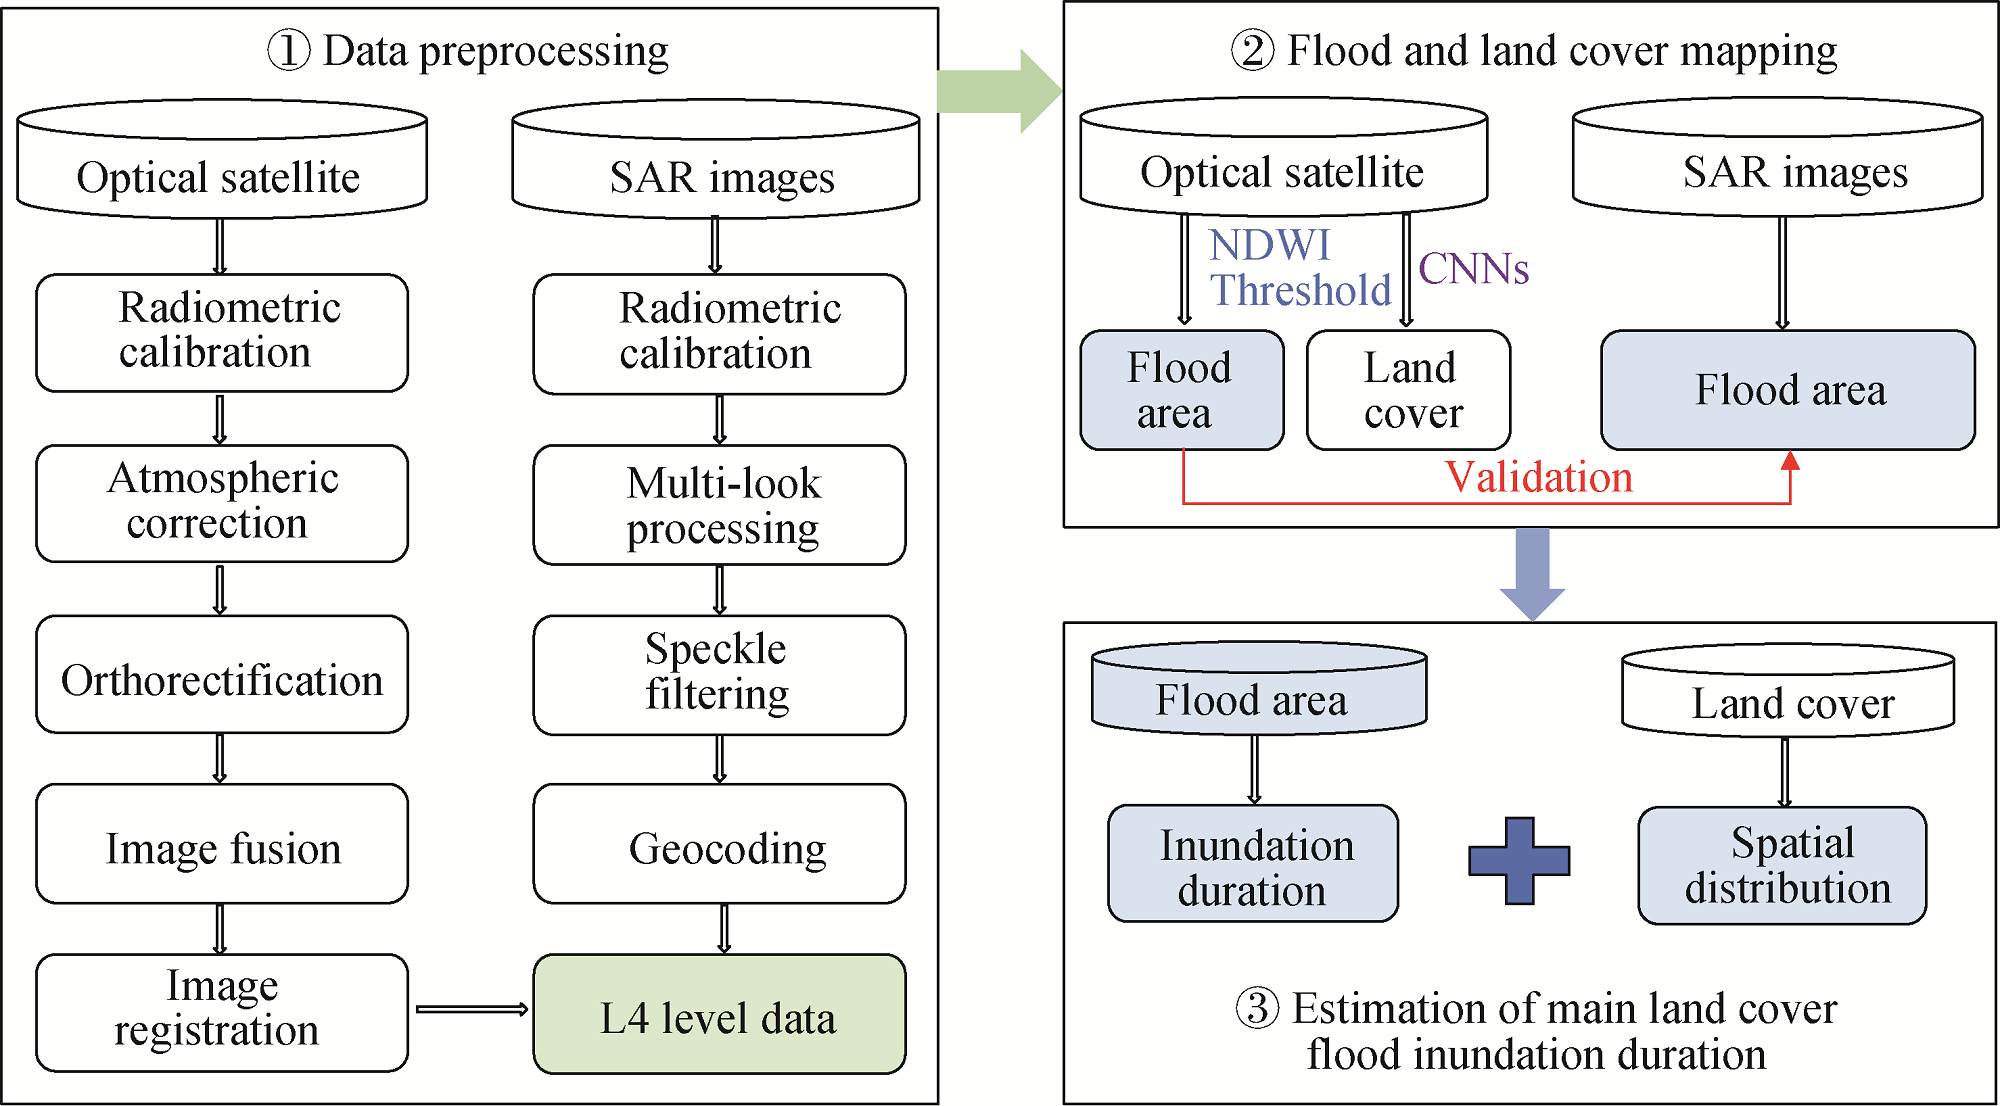
Fig. 2
Workflow diagram with data sources, analytical process, and output
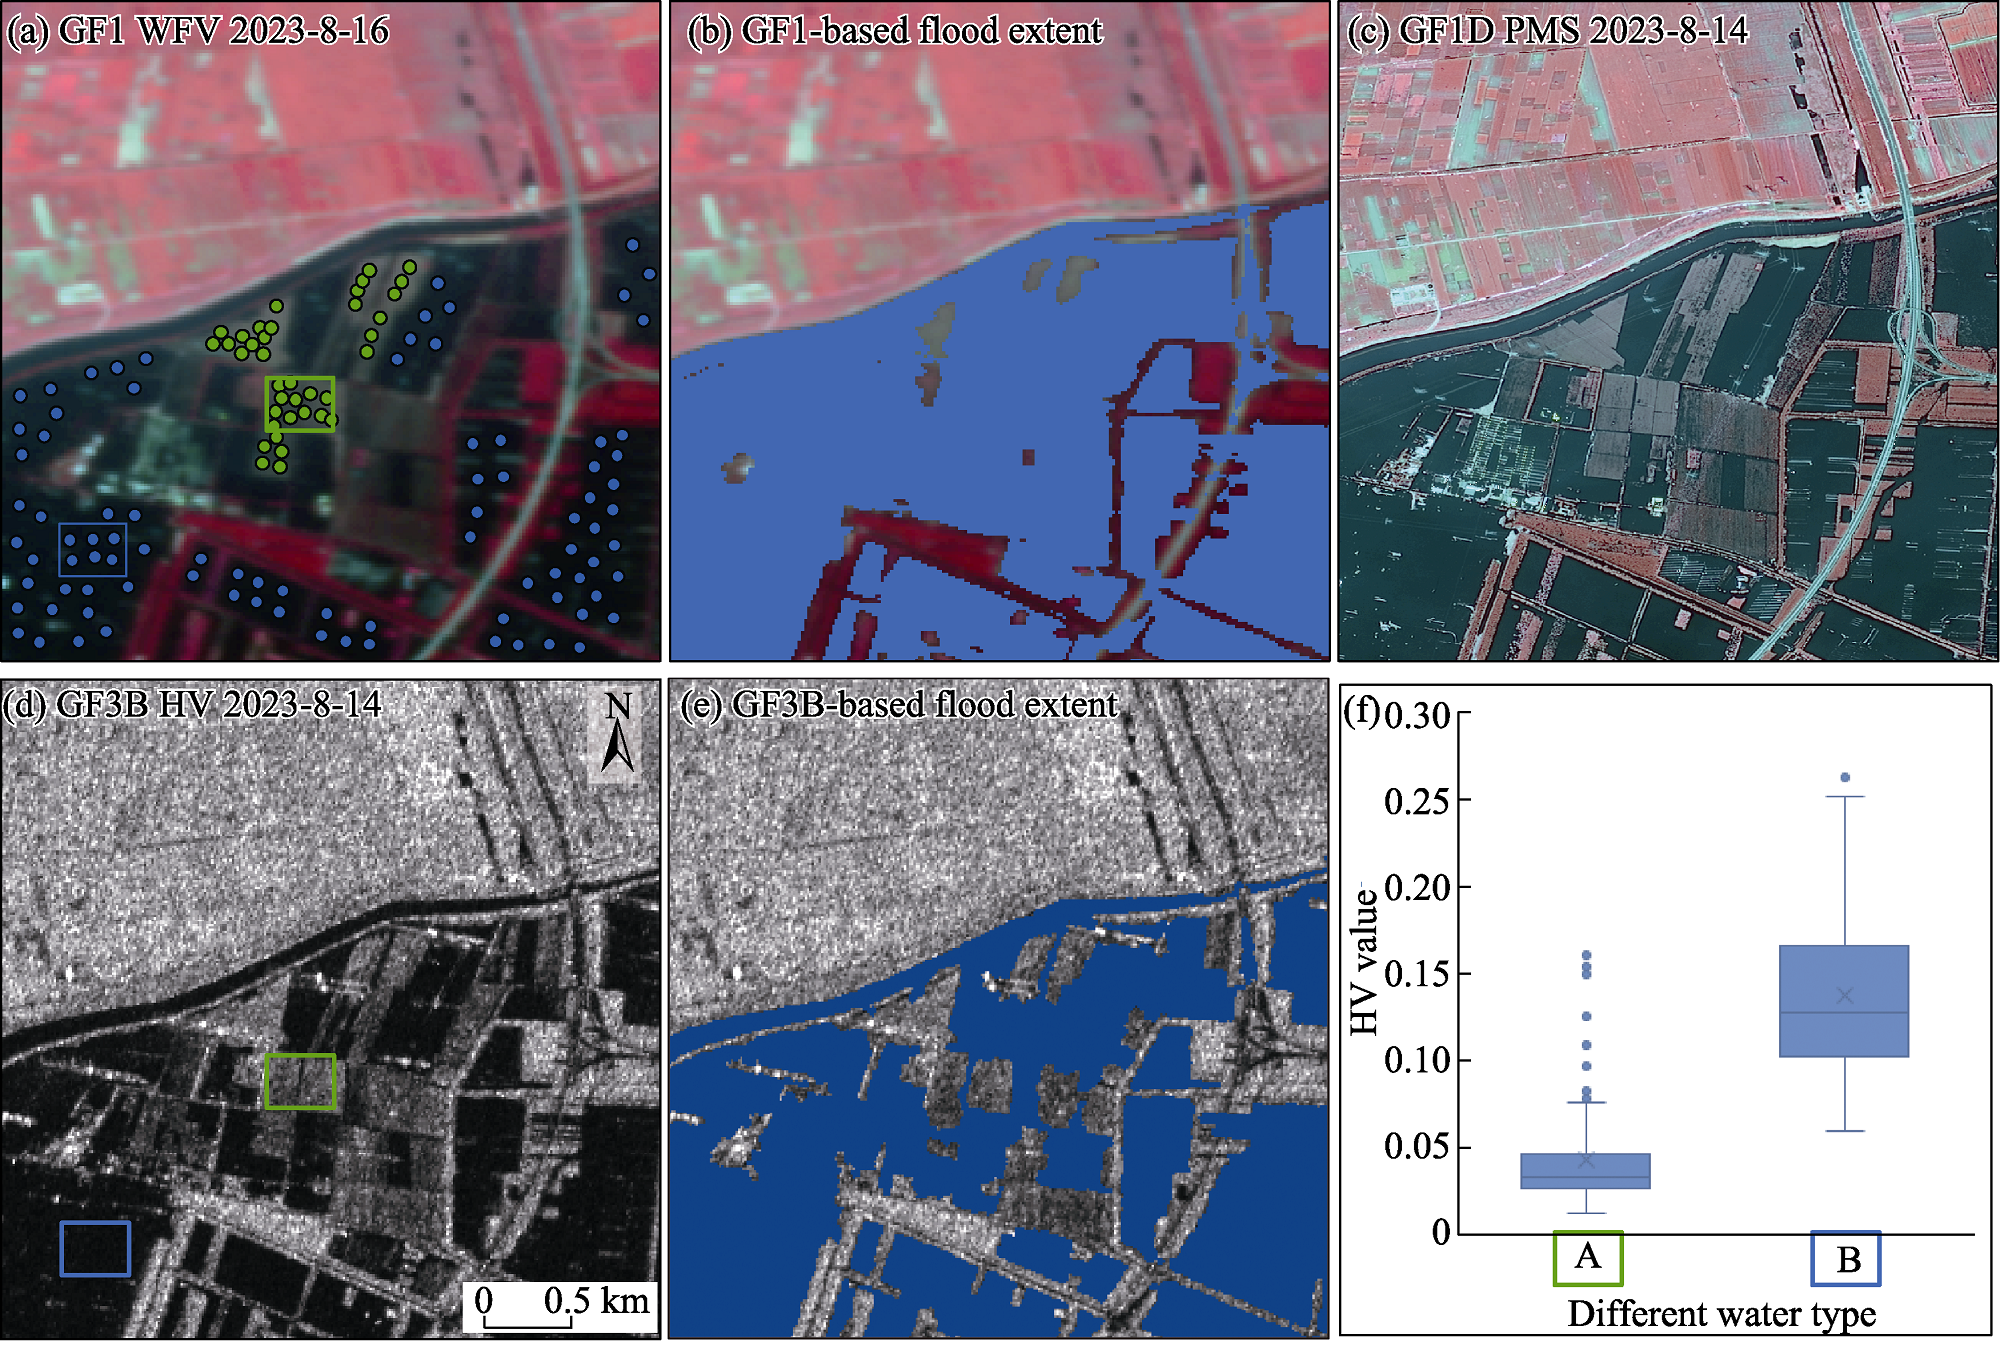
Fig. 4
Sample images from the results of the OTSU approach for the respective visual assessments
Note: The blue color indicates the extent of flooding that we mapped.
Table 2
Water area extraction results
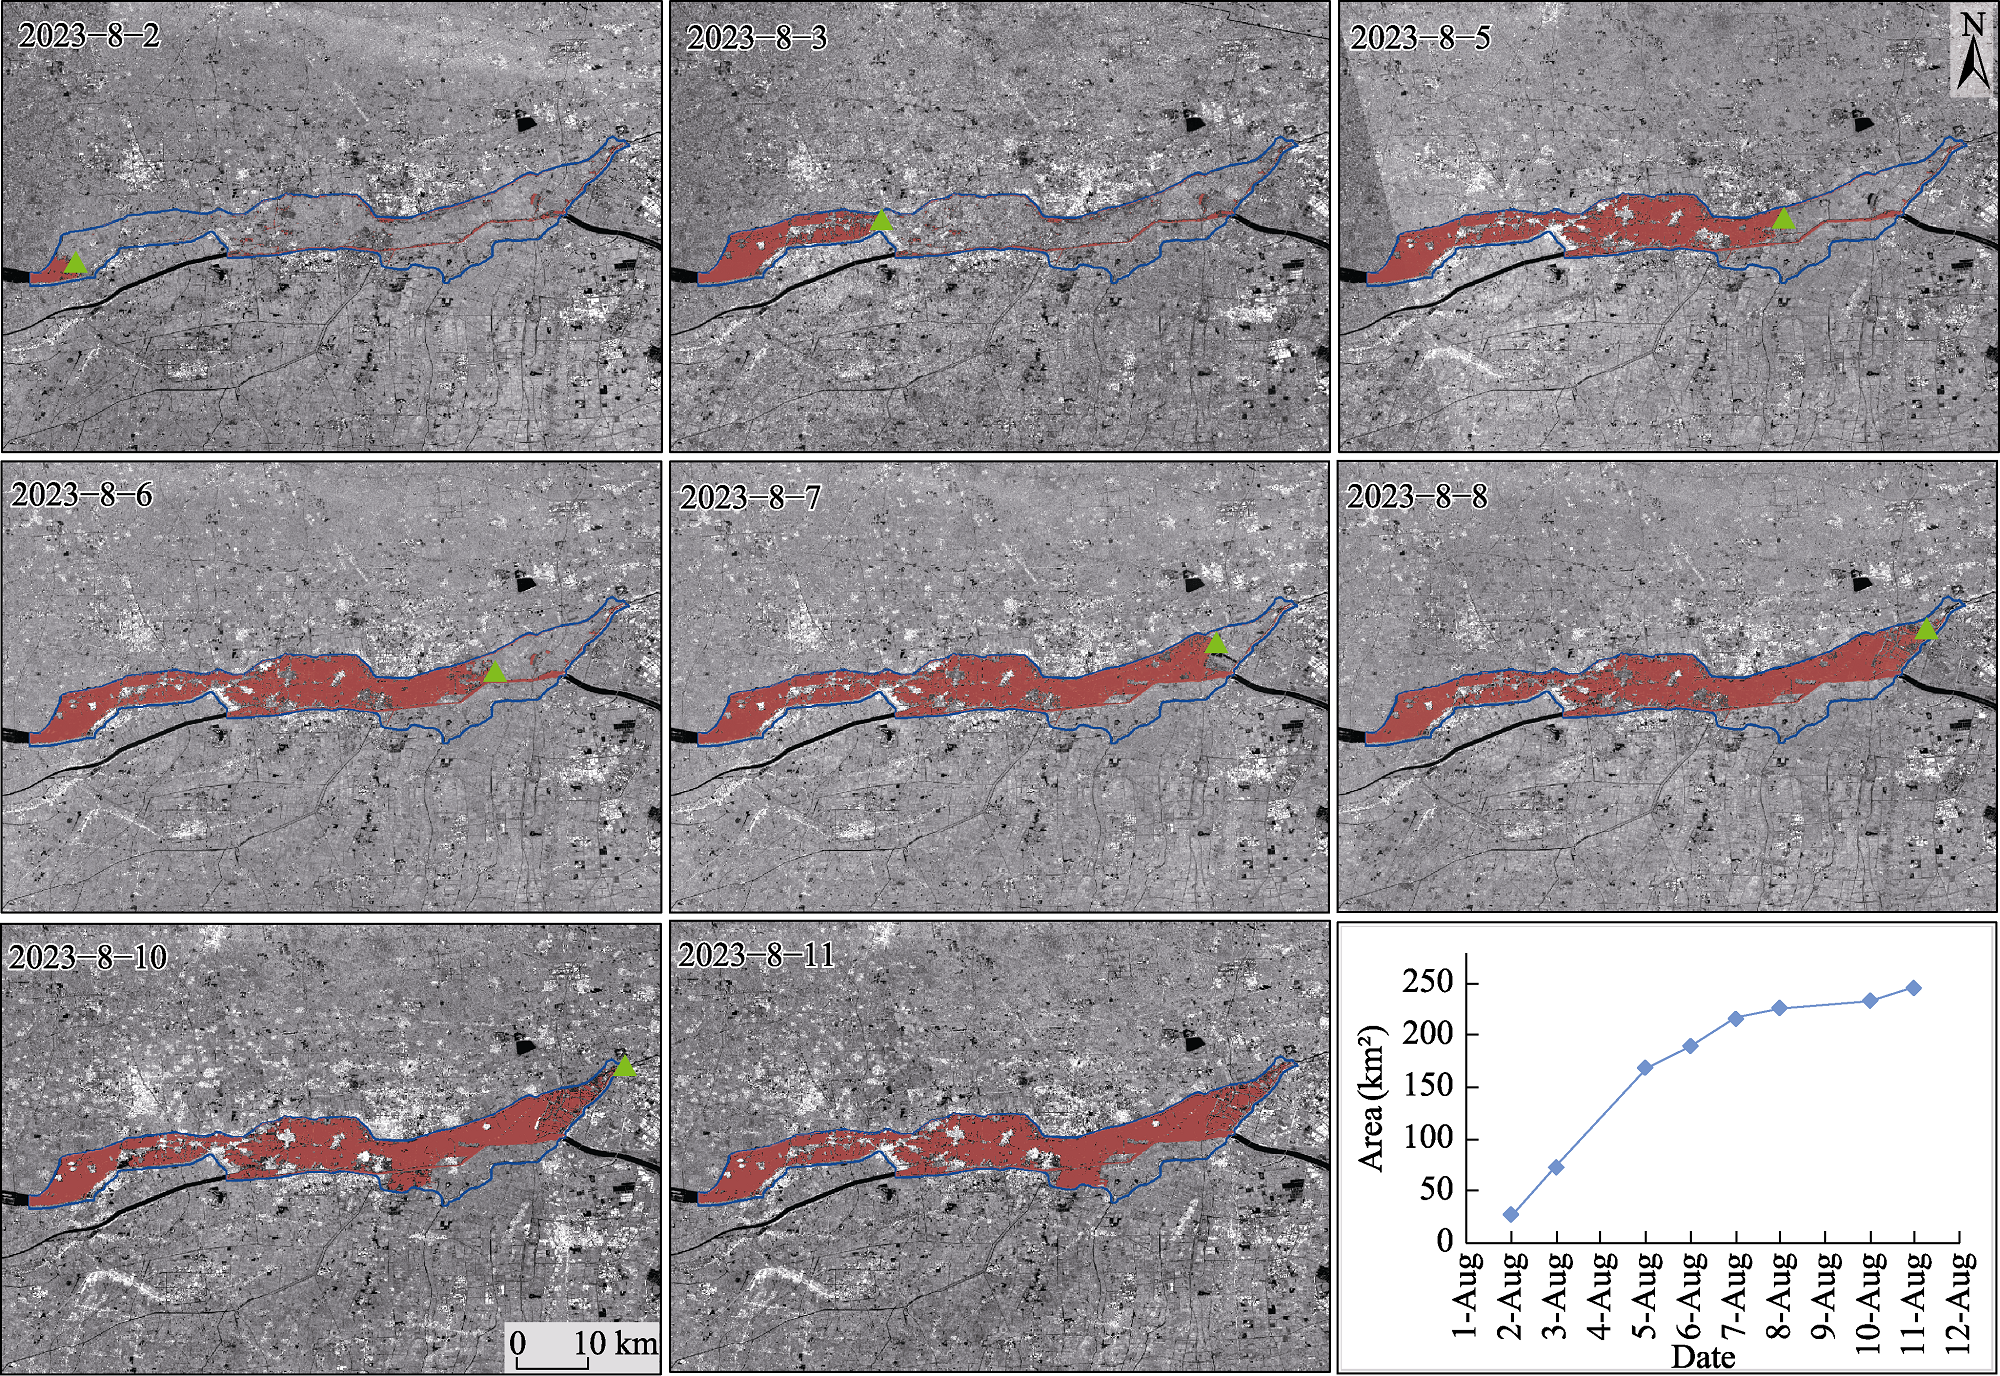
Fig. 5
Flood extent changes during the rapid expansion phase
Note: The orange color in the figure images represents the flooded area, the blue border indicates the scope of the FDB, and the green triangles represent the positions of water intakes.
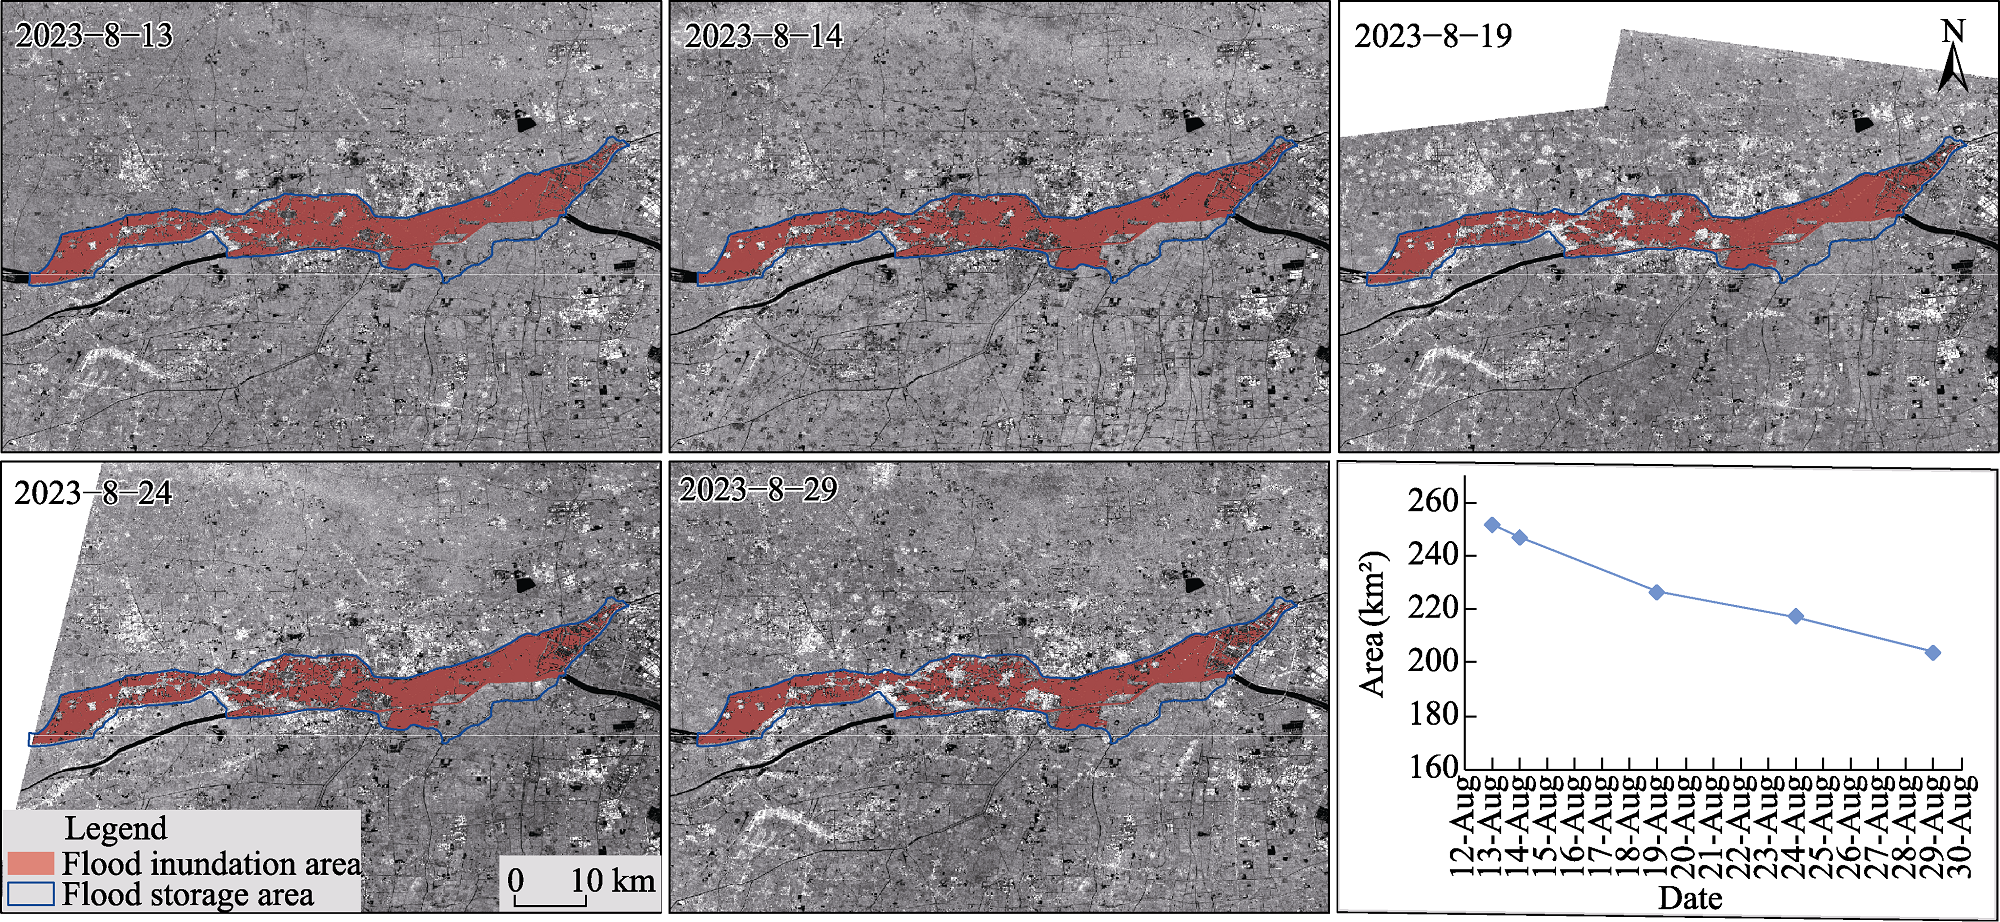
Fig. 6
Changes in flood extent during the flood recession phase
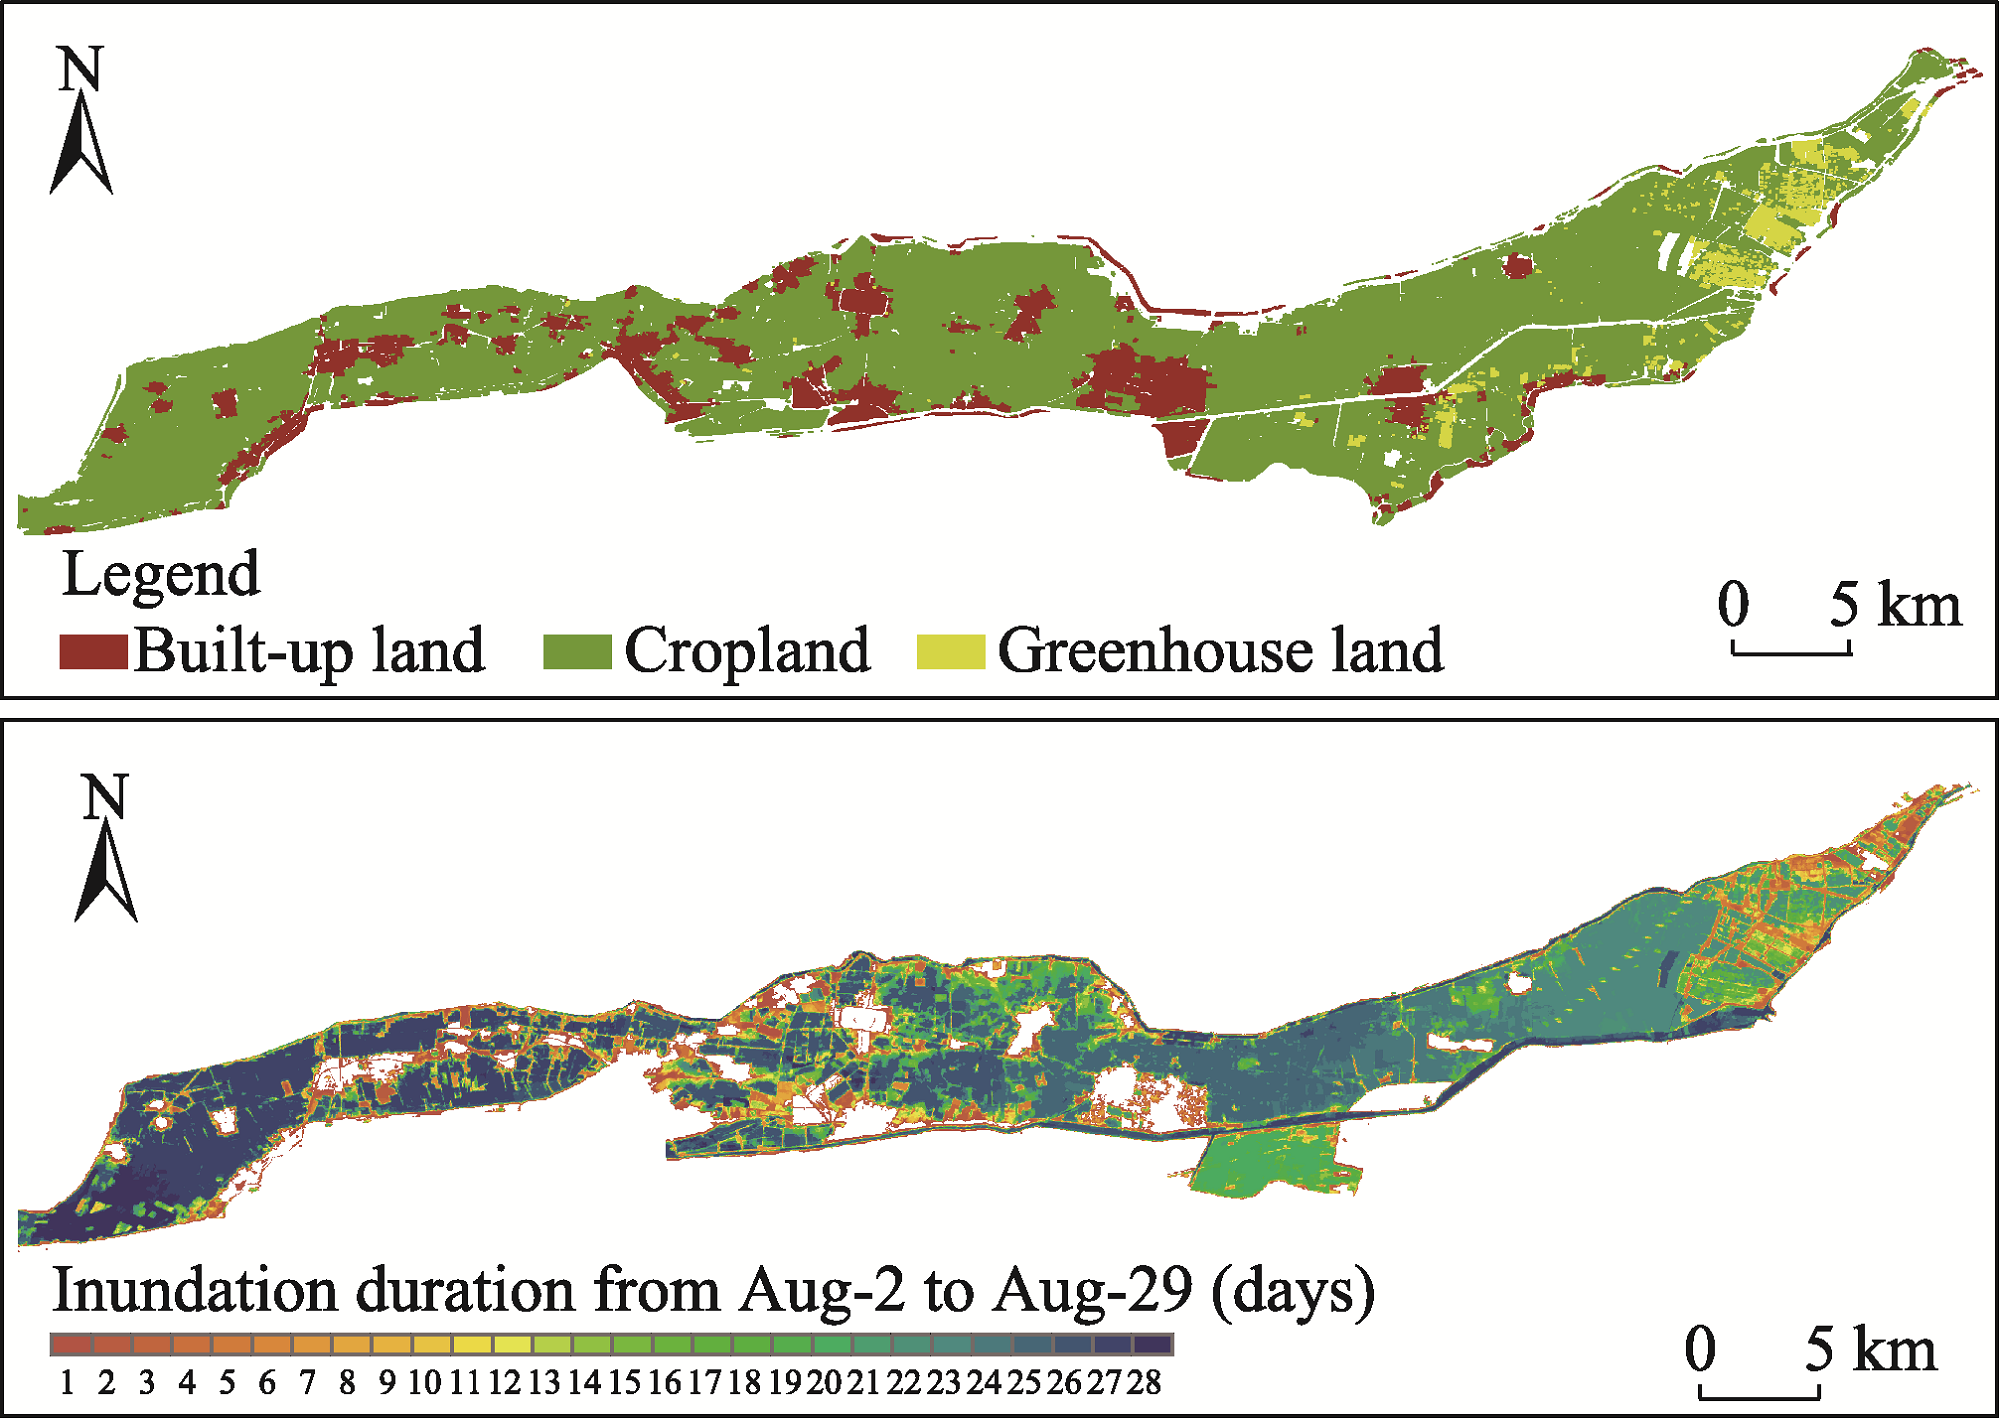
Fig. 7
Flood duration since the Dongdian FDB opened
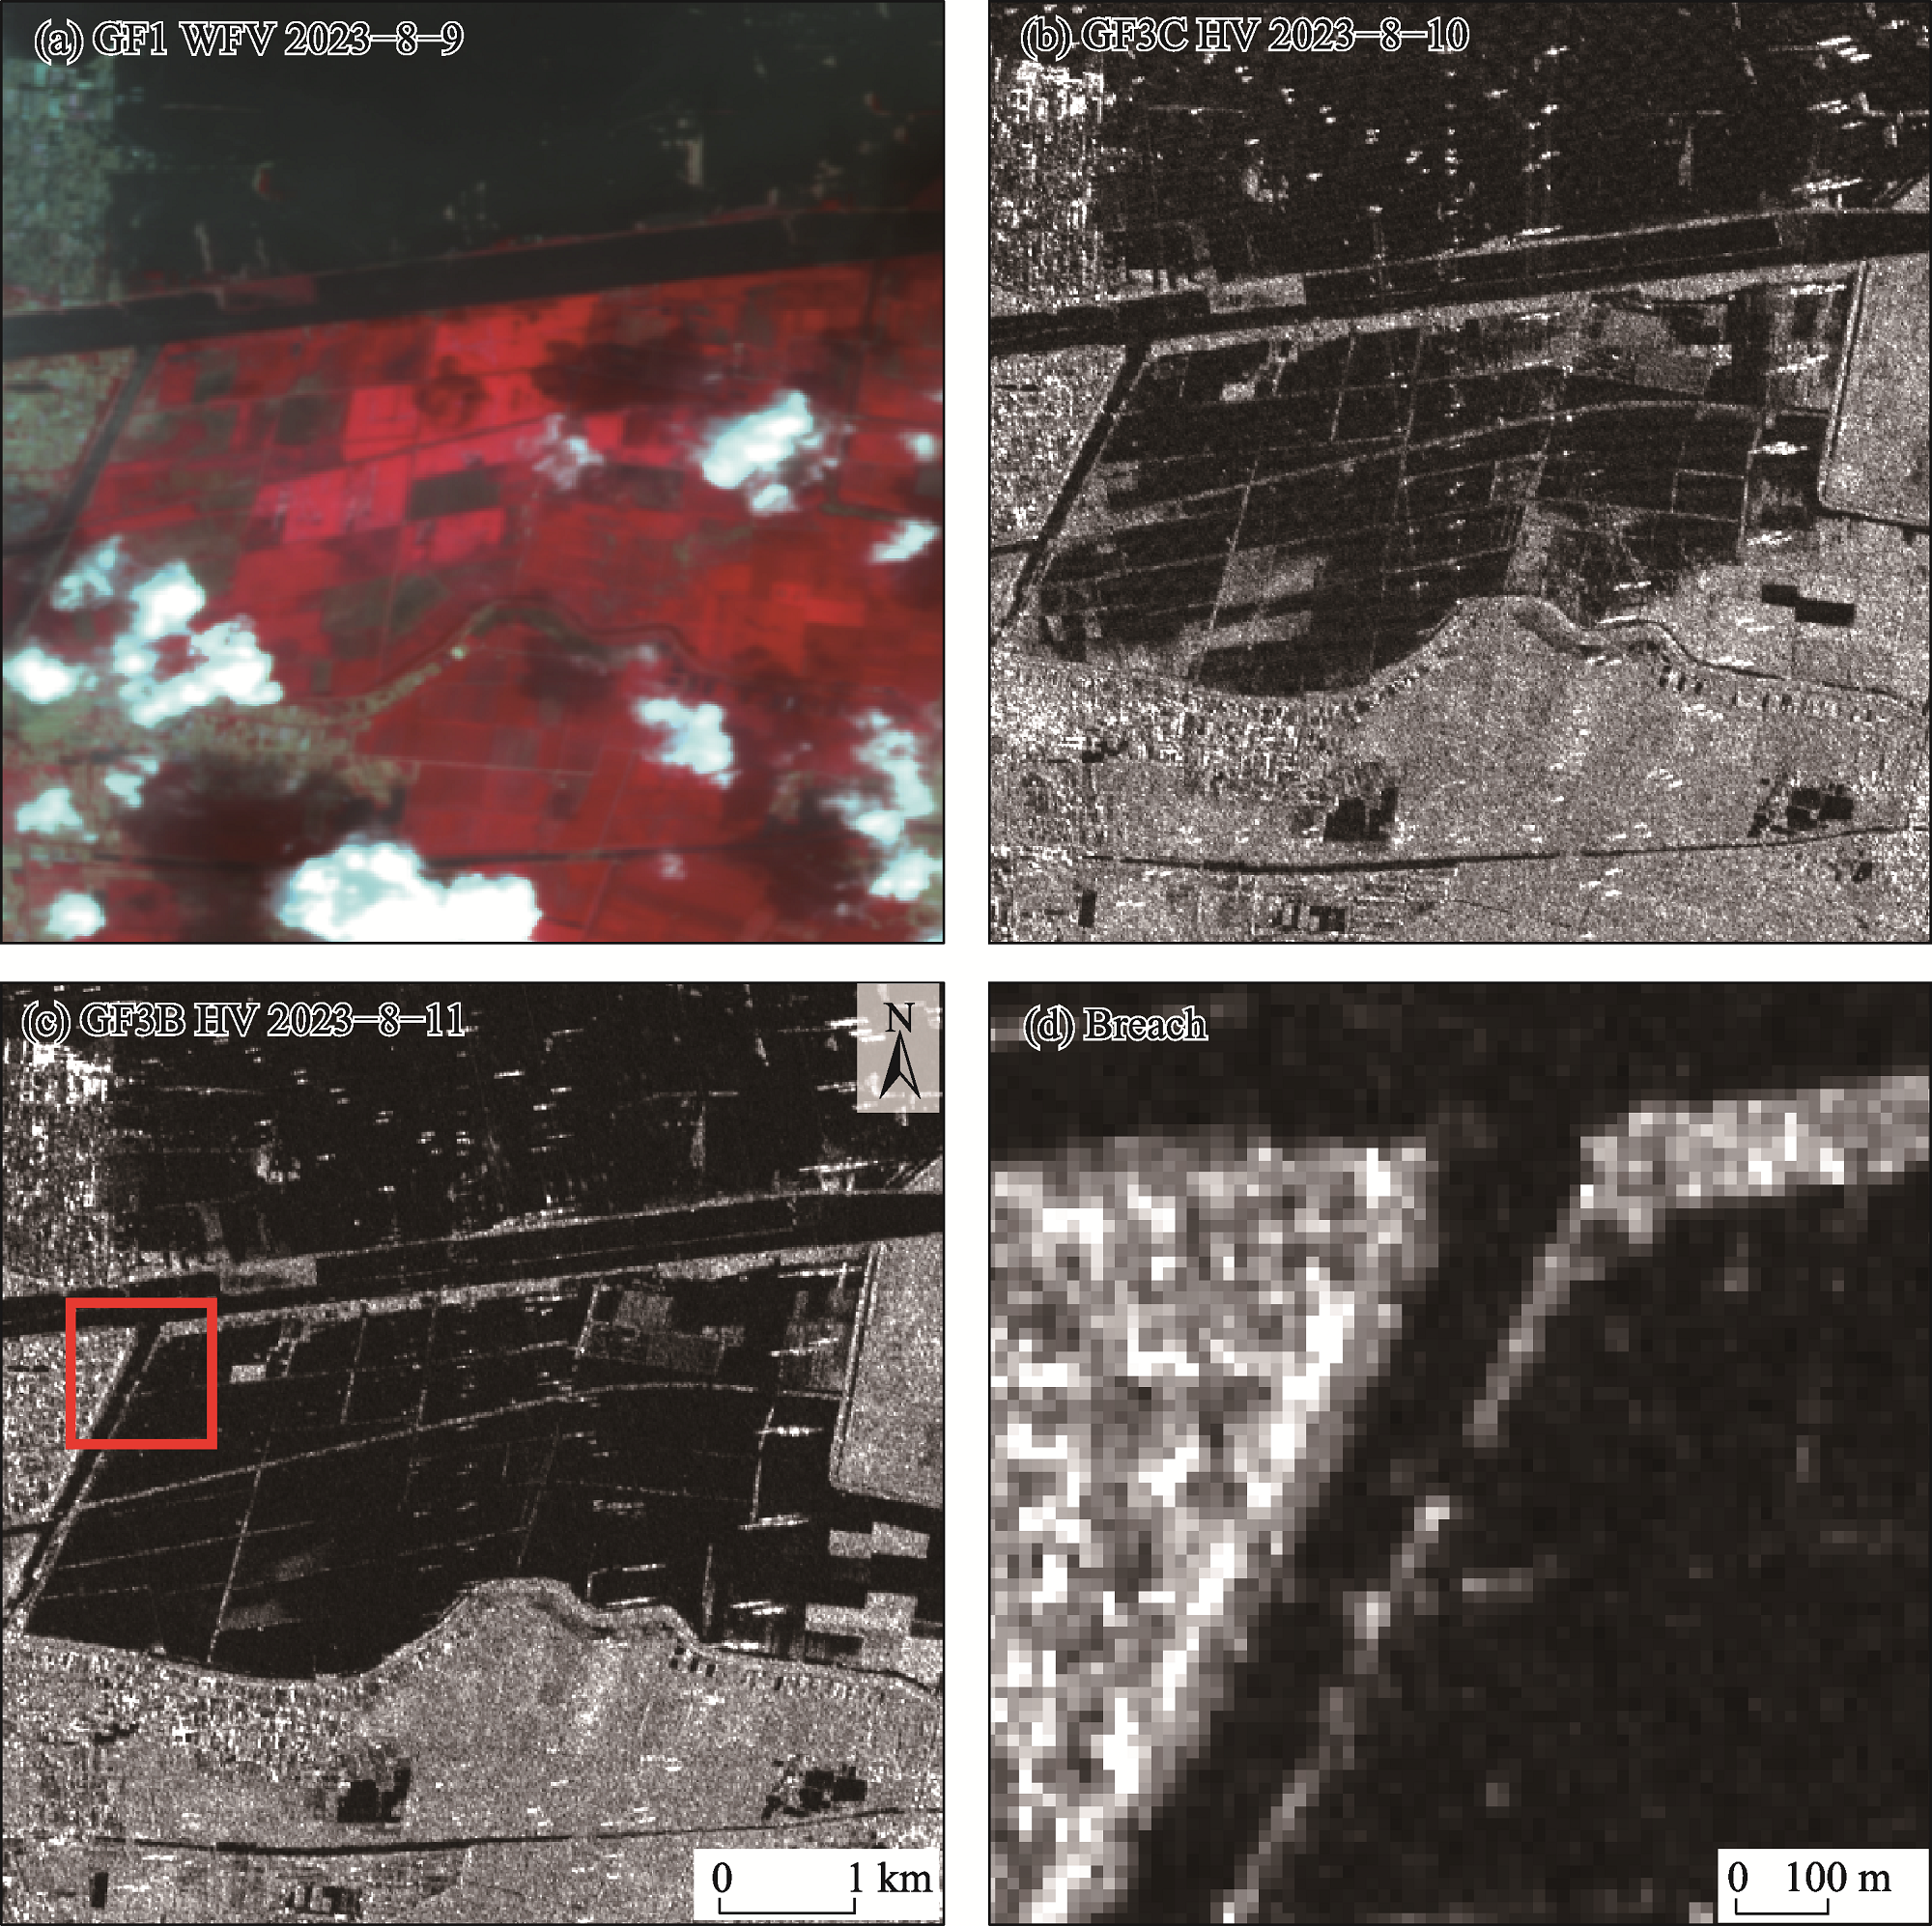
Fig. 8
A breach location was identified during the flood recession phase