Special Column: Ecotourism and Rural Revitalization

The Influence of TikTok User-Generated Content Short Videos on Tourists’ Willingness to Engage in Rural Tourism: The Mediating Role of Destination Image Perception

  • WANG Yang ,
  • YAN Wei ,
  • SUN Jingru ,
  • ZHOU Mi , *
Expand
  • College of Economic and Management, Shenyang Agricultural University, Shenyang 110866, China
* Corresponding author: ZHOU Mi, E-mail:

WANG Yang, E-mail:

Received date: 2024-11-02

  Accepted date: 2025-04-09

  Online published: 2025-08-05

Supported by

The Liaoning Provincial Social Science Planning Fund Project(L23CGL002)

Abstract

Rural tourism plays a crucial role in driving the sustainable development of rural economies. With the rise of the digital economy, user-generated content (UGC) videos on platforms such as TikTok have become a significant factor influencing consumer decision-making, creating new opportunities for the growth of rural tourism. Using the TikTok app as the research platform, this study examines the relationship between UGC short videos, tourists’ intentions to engage in rural tourism, and their perception of destination image. Specifically, it explores the impact of UGC short videos on tourists’ willingness to participate in rural tourism and the mediating role of destination image perception. The findings indicate that UGC short videos positively influence tourists’ willingness to engage in rural tourism. Destination image perception mediates this relationship, shaping tourists’ decisions through cognitive and emotional image perceptions. Based on these findings, this paper recommends rural tourism destination managers enhance promotional strategies and improve destination image perception through UGC short video content.

Cite this article

WANG Yang , YAN Wei , SUN Jingru , ZHOU Mi . The Influence of TikTok User-Generated Content Short Videos on Tourists’ Willingness to Engage in Rural Tourism: The Mediating Role of Destination Image Perception[J]. Journal of Resources and Ecology, 2025 , 16(4) : 1185 -1195 . DOI: 10.5814/j.issn.1674-764x.2025.04.021

1 Introduction

As an innovative model of rural economic development, rural tourism has demonstrated significant industrial value in the digital economy era. Its evolving paradigm provides crucial momentum for implementing rural revitalization strategies and serves as a key spatial mediator in restructuring urban-rural dynamics. With advancements in internet technology and the widespread adoption of mobile devices, social media platforms have experienced exponential user growth, establishing the technological prerequisites for transforming rural tourism communication models. Within this context, user-generated content (UGC) short-video platforms, exemplified by TikTok, are reshaping the spatial narrative of rural tourism through their immediacy, interactivity, and high communicative efficiency. Research suggests that UGC short videos exhibit adaptability to mobile scenarios, multimodal interaction, fragmented dissemination, and high-density visual symbolism (Song and Li, 2019). This new mode of communication transcends the temporal and spatial limitations of traditional tourism marketing. Through content creation, sharing, and interactive engagement, users not only digitally encode tourism experiences but also establish emotional connections and cultural identities within virtual communities (Wang et al., 2022). This participatory communication mechanism, driven by digital media, effectively enhances rural tourism in three key dimensions: increasing destination visibility in the communicative dimension, revitalizing rural cultural heritage in the cultural dimension, and extending the tourism consumption value chain in the industrial dimension. Ultimately, this process fosters a positive synergy between digital technology and rural development.
A deeper understanding of tourists’ travel intentions allows for precise insights into their needs across multiple dimensions, providing a robust scientific foundation for the tourism industry to implement personalized development, optimize services, and formulate targeted strategic plans that drive sustainable sectoral growth (Pearce and Li, 2005; Ruan et al., 2024). Numerous studies have demonstrated that social media marketing significantly shapes potential tourists’ travel intentions (Qin and Lin, 2023). TikTok UGC short videos featuring diverse content formats—including natural landscapes, local cuisine, and folk cultural activities—offer tourists comprehensive travel information. These videos visually showcase destinations and authentically convey tourists’ emotional experiences and reviews (Kong et al., 2021). Through engaging presentations and extensive reach, TikTok short videos significantly influence tourists’ perceptions of destination image across cognitive and emotional dimensions (Zhu et al., 2021). When tourists perceive a destination as rich in tourism resources, well-equipped with high-quality facilities, and exuding a positive emotional appeal, their likelihood of developing travel intentions increases substantially (Tigre et al., 2015). This underscores the profound impact of destination image perception on travel intentions.
Existing research has established a relatively comprehensive theoretical framework for understanding the relationships among UGC short videos, destination image perception, and rural tourism behavior. These findings provide a critical knowledge base for this study. However, while previous studies have examined the correlations between UGC short videos, rural tourism intention, and destination image perception, most have focused on two-variable relationships, with limited exploration of the internal mechanisms linking all three factors. To address this gap, this study selects the TikTok app as the research platform. It proposes hypotheses regarding the relationships among UGC short videos, rural tourism intention, and destination image perception. The objective is to uncover the underlying mechanisms through which UGC short videos influence tourists’ willingness to engage in rural tourism, specifically focusing on the mediating role of destination image perception. By elucidating the interconnectedness of these three elements, this study contributes new perspectives to academic discourse in this field. Additionally, it offers practical guidance for rural tourism destinations to leverage the TikTok platform for precision marketing, optimize tourism environments and infrastructure, preserve and revitalize rural cultural heritage, and ultimately shape destination images that align with tourist expectations.

2 Theoretical basis and hypothesis

2.1 Concept definitions

2.1.1 UGC

The term UGC was introduced by the network publishing and new media industry in 2005. It is also known as user- created content or consumer-generated media. UGC emerged with the development of the Internet and the advent of Web 2.0 (Zhao and Zhu, 2009). It encompasses various forms of personalized content—including text, images, audio, and video—that are created, edited, or otherwise generated by Internet users in a Web 2.0 environment (Wang et al., 2020). This study examines one specific form of UGC—short video content—and its influence on tourists’ willingness to engage in rural tourism.

2.1.2 Rural tourism willingness

Rural tourism involves leveraging local customs, landscapes, and cultural experiences to attract tourists for leisure, sightseeing, experiential activities, and educational purposes (Liu, 2006). Tourism consumption behavior is driven by tourism intention, which is a critical factor influencing actual travel behavior. For this study, rural tourism intention is defined as the tendency of potential tourists to visit a rural destination in the future (Qin and Lin, 2023).

2.1.3 Destination image

Destination image refers to the comprehensive perception and evaluation that tourists have of a particular travel destination. It represents an intangible asset that enhances both the internal and external appeal of a location (Tan et al., 2021). Because potential tourists often have limited firsthand experience with a destination, the perceived image plays a crucial role in shaping their travel decisions, sometimes even more than the existing tourism resources available (Crompton, 1979). In this study, destination image is defined as the comprehensive perception that potential tourists form about a travel destination.

2.2 Stimulus-organism-response (SOR) theory

The SOR theory, proposed by Mehrabian and Russell in 1974, explores the relationship between environmental stimuli and the cognitive and behavioral responses of organisms. In this framework, external environmental factors that influence an individual are referred to as stimulus (S) variables, the individual’s internal feelings are organic (O), and the behavioral decisions made after integrating S factors and internal feelings constitute response (R) variables. The SOR model is a feedback mechanism in which external stimuli and effective information processing generate behavioral responses (Cheng et al., 2023). As research on user behavior has expanded, the contextual applications of the SOR model, as well as the interpretation of the O and R components, have evolved. For example, Li (2023) examined how short video content influences users’ cognitive and emotional states on video-sharing platforms, ultimately driving purchase intentions.
The SOR theory provides a clear theoretical framework for this study. It offers insights into how Douyin UGC short videos influence tourists’ rural tourism intentions by shaping their perceptions of destination images. First, regarding S, Douyin UGC short videos serve as a source of informational stimuli, encompassing a wide range of rural tourism-related content, such as natural landscapes, local cuisine, cultural festivals, and testimonials from other tourists. These elements act as external stimuli, capturing potential tourists’ attention and generating interest in rural tourism destinations. Second, regarding the O, tourists process and interpret the information in Douyin UGC short videos based on their personal characteristics, hobbies, and past experiences. Through this process, they gradually develop cognitive and emotional perceptions of rural tourism destinations. This psychological transformation reflects the internal R of the O to external stimuli. Finally, regarding R, tourists’ positive or negative perceptions of rural tourism destinations influence their travel intentions and behaviors. A favorable perception formed through Douyin UGC short videos increases the likelihood of tourists developing an intention to visit rural areas and making travel-related decisions. From a mediation perspective, the SOR theory effectively explains the role of destination image perception as a mediator between Douyin UGC short videos and tourists’ rural tourism intentions. Douyin UGC short videos initially influence tourists’ cognitive and emotional states, shaping their perception of rural tourism destinations and affecting their travel intentions. Therefore, the SOR theory provides comprehensive and systematic theoretical support for analyzing the impact of Douyin UGC short videos on tourists’ rural tourism intentions, allowing for an in-depth exploration of this complex influence mechanism.

2.3 Research hypothesis

UNESCO defines information sources as individuals obtaining information to fulfill their informational needs. According to the theory of information source characteristics, three key dimensions—professionalism, credibility, and attractiveness—influence audiences by shaping their perceptions through psychological processes such as internalization, compliance, and identification (Kelman, 2017). Expanding on professionalism, credibility, and attractiveness, Meng et al. (2020) introduced two additional dimensions: interactivity and skill. In this study, professionalism, credibility, and attractiveness are collectively called characteristics of information derived from UGC sources. TikTok UGC short videos are categorized into two primary dimensions: information and interactivity. The SOR theoretical model is a feedback framework in which external stimuli trigger behavioral responses through effective information processing (Cheng et al., 2023). The model comprises three core elements: Stimulus, organism and response (Figure 1). As research on user behavior continues to expand, the contextual applications of the SOR theory and its interpretations of the O and R components are also evolving. Based on the SOR model, Li (2023) examined how short video platforms influence users’ cognitive and emotional states after exposure to video content, ultimately driving purchase intentions.
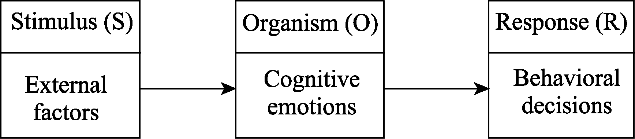
Figure 1 The stimulus-organism-response theoretical model
Scholars have demonstrated that UGC on Xiaohongshu positively impacts consumers’ purchase intentions (Xing et al., 2023). Similarly, Kong et al. (2021) found that the quality of social media information significantly enhances tourists’ willingness to engage in rural tourism. Specifically, higher-quality information strengthens tourists’ motivation to visit rural destinations. Furthermore, Wei and Tang (2016) established that interactivity in UGC positively influences purchase intentions. Accordingly, this study proposes the following hypotheses:
H1: TikTok UGC short videos positively influence rural tourism willingness.
H1a: The informational content in TikTok UGC short videos positively influences rural tourism willingness.
H1b: The interactivity of TikTok UGC short videos positively influences rural tourism willingness.
Research has shown that UGC influences tourists’ cognitive and affective images of destinations, with a particularly strong impact on their mental image (Ayeh et al., 2013; Huang et al., 2018). Deng and Guan (2022) further demonstrated that the availability of short mobile videos enhances tourists’ perceptions of a destination’s image. Specifically, the greater availability of mobile short videos facilitates the construction of a stronger and more favorable destination image. Based on these findings, this study proposes the following hypotheses:
H2: TikTok UGC short videos positively influence destination image perception.
H2a: The informational content in TikTok UGC short videos positively influences cognitive destination image perception.
H2b: The informational content in TikTok UGC short videos positively influences emotional destination image perception.
H2c: The interactivity of TikTok UGC short videos positively influences cognitive destination image perception.
H2d: The interactivity of TikTok UGC short videos positively influences emotional destination image perception.
Both cognitive and emotional perceptions of a tourist can significantly influence visitors’ behavioral intentions (Zhang et al., 2016). In a study on the impact of different exhibition promotions on city image and tourism willingness, Zhou (2020) categorized city image into basic environmental image, humanistic environmental image, and emotional image. The study found that all three dimensions significantly and positively influenced tourism willingness among potential tourists. Similarly, through exploratory factor analysis, Liu (2013) incorporated human environment and environmental factors into the cognitive image category. Based on these findings, the following hypotheses are proposed:
H3: Destination image perception positively influences rural tourism willingness.
H3a: Cognitive destination image perception positively influences rural tourism intention.
H3b: Emotional destination image perception positively influences rural tourism willingness.
The mediating role of destination image perception in shaping tourists’ willingness to travel has been a key area of academic inquiry. Zhu et al. (2021) found that negative online word-of-mouth adversely affects travel intentions and indirectly influences them through destination image perception. Similarly, Tan et al. (2021) analyzed online travelogues and identified cognitive and emotional images of Dalian city, demonstrating how an online reputation— written in the form of UGC—shapes travel intentions. Drawing on this research, this study believes that destination image perception mediates the impact of UGC short videos on tourism willingness. Numerous studies confirm a relationship between UGC short videos and destination image perception, indicating that stronger perceptions of a destination’s image correlate with greater rural tourism willingness. Therefore, the following hypotheses are proposed:
H4: Destination image perception mediates the relationship between TikTok UGC short videos and rural tourism willingness.
H4a: Cognitive image perception mediates the relationship between TikTok UGC short video information and rural tourism willingness.
H4b: Cognitive image perception mediates the relationship between TikTok UGC short video interactivity and rural tourism willingness.
H4c: Emotional image perception mediates the relationship between TikTok UGC short video and rural tourism willingness.
H4d: Emotional image perception mediates the relationship between TikTok UGC short video and rural tourism willingness. Based on these hypotheses and drawing from the research of Ohanian (1990) and other scholars, 18 measurement items were designed to assess the corresponding variables of each hypothesis (Table 1).
Table 1 Variable measurement scales
Variable Number Measure the item Item source
Informativeness A1 I think the information on rural tourism is reliable Ohanian (1990);
Yang and Shen (2017)
A2 I believe the publisher of the rural tourism information is credible
I have experience in rural tourism
A3 I think the publisher of the rural tourism information is trustworthy
A4 The rural tourism information is appealing to me
Interactivity B1 Based on the video content, I can interact with the publishers and the fans Wei and Tang (2016)
B2 I can do my best
People interested in rural tourism destinations can communicate with each other
B3 I can obtain the information I need from it
The information about rural tourist destinations is useful
Cognitive image C1 The rural tourist destination has good transportation and infrastructure Beerli and Martin (2004);
Li and Wang (2023)
C2 The rural tourist destination has reasonably priced tickets
C3 The residents of the rural tourist destination are kind, friendly, and simple
Visiting a rural tourist destination relaxes me
Emotional image D1 Going to a rural tourist destination makes me happy Liu (2013);
Stylidis et al. (2017)
D2 Traveling to a rural tourist destination makes me feel excited
D3 Traveling to a rural tourist destination makes me feel excited
Willingness of travel E1 I would like to visit the rural tourist destination recommended in the short video Prayag et al. (2017)
E2 I would recommend this destination to my friends and family
E3 I am willing to invest time and money in visiting a rural tourist destination
E4 If I travel, I will prioritize rural tourist destinations
E5 I will learn more about rural tourism destinations

3 Data analysis and results

3.1 Data source

This study distributed questionnaires online and analyzed the collected data statistically. A total of 410 questionnaires were submitted; however, those completed in less than 60 seconds were excluded. Ultimately, 381 valid questionnaires were retained, resulting in an effective response rate of 92.9%—the questionnaire comprised two parts. The first part included three measurement scales: 1) TikTok UGC short videos, 2) destination image perception (measured using a Likert scale), and 3) rural tourism willingness (measured using a binary scale). These scales were developed by adapting previously validated measurement scales to suit the objectives of this study. The second part of the questionnaire collected demographic information about the respondents. This study employed Statistical Package For Social Sciences 26.0 for data analysis, encompassing descriptive statistics, reliability and validity testing, factor analysis, correlation analysis, and regression analysis. Additionally, potential mediation effects were examined. The findings from the hypothesis testing are summarized in subsequent sections.

3.2 Descriptive statistical analysis of the samples

As shown in Table 2, the statistical analysis of respondents’ demographic information indicates a relatively balanced distribution, with no single characteristic or index dominating. This suggests that the sample selection was sufficiently random, ensuring the representativeness and reliability of the study’s findings.
Table 2 Statistical analysis of the demographics
Variable Option Frequency Percentage (%)
Gender Male 184 48.3
Female 197 51.7
Age
(yr)
18 and below 35 9.1
19-25 129 33.9
26-30 58 15.2
31-40 54 14.2
41-50 45 11.8
51-60 30 7.9
61 and above 30 7.9
Education Junior high school
and below
37 9.7
High school/technical
secondary school
69 18.1
Junior college 77 20.2
Undergraduate college 171 44.9
Postgraduate 27 7.1
Occupation Self-employed 65 17.1
Enterprise staff 120 31.5
Leaving/retirement 0 0.0
Student 97 25.5
Teacher 21 5.5
Public functionary 40 10.5
Peasant 9 2.4
Other 29 7.5
Average monthly earnings
(yuan)
1500 and less 87 22.8
1501-3000 91 23.9
3001-4500 76 19.9
4501-7000 78 20.5
7001 and above 49 12.9
TikTok use time Within 1 hour 54 14.2
1-2 hours 85 22.3
2-3 hours 107 28.1
More than 3 hours 135 35.4
Have you ever
traveled there after watching short videos of a rural tourism destination
Yes 251 65.9
No 130 34.1
A key assumption for conducting regression analysis is that the sample data follows a normal distribution. In this study, skewness and kurtosis values were used to assess normality. If skewness is below three and the absolute kurtosis value is below 8, the data can be considered normally distributed. According to Table 3, 13 items all met these criteria, confirming that the sample data follow a normal distribution, allowing for subsequent analysis.
Table 3 Results of the normal distribution test
Variable N
statistics
Least value
statistics
Crest value
statistics
Mean
statistics
Standard deviations
statistics
Skewness Kurtosis
Statistics Standard error Statistics Standard error
A1 381 1.00 5.00 3.7822 1.21278 −0.848 0.125 −0.203 0.249
A2 381 1.00 5.00 3.7638 1.22339 −0.832 0.125 −0.233 0.249
A3 381 1.00 5.00 3.6850 1.21201 −0.750 0.125 −0.338 0.249
A4 381 1.00 5.00 3.8031 1.18570 −0.918 0.125 0.001 0.249
B1 381 1.00 5.00 3.7612 1.00429 −0.666 0.125 −0.110 0.249
B2 381 1.00 5.00 3.8241 1.07265 −0.802 0.125 −0.002 0.249
B3 381 1.00 5.00 3.8189 1.07177 −0.794 0.125 −0.011 0.249
C1 381 1.00 5.00 3.7139 1.19628 −0.685 0.125 −0.390 0.249
C2 381 1.00 5.00 3.6010 1.12315 −0.478 0.125 −0.504 0.249
C3 381 1.00 5.00 3.6877 1.14689 −0.619 0.125 −0.385 0.249
D1 381 1.00 5.00 3.6693 1.28384 −0.721 0.125 −0.562 0.249
D2 381 1.00 5.00 3.5722 1.21749 −0.525 0.125 −0.643 0.249
D3 381 1.00 5.00 3.5564 1.24820 −0.607 0.125 −0.603 0.249

3.3 Reliability and validity testing of the scale

Cronbach’s alpha coefficient and Konbach’s alpha value were used to measure internal consistency and assess the reliability of the questionnaire. Generally, a Cronbach’s alpha coefficient above 0.9 indicates excellent reliability, a value above 0.8 suggests good reliability without the need to remove any questions, and a value above 0.7 is considered acceptable. According to the results in Table 4, all four dimensions in this study had Cronbach’s alpha values exceeding 0.7, confirming the reliability of the questionnaire.
Table 4 Results of the scale reliability test
Dimension Number of terms Cronbach’s alpha
Informedness 4 0.851
Interactivity 3 0.904
Cognitive image 3 0.902
Emotional image 3 0.875
According to the results in Tables 5 and 6, the KMO values for the UGC short video scale and the destination image perception scale were greater than 0.7, indicating strong correlations within the data. Additionally, Bartlett’s test of sphericity yielded P-values well below 0.05, further confirming the suitability of the data. Therefore, UGC short video and destination image perception scale data are suitable for factor analysis.
Table 5 Results of KMO and Bartlett test
Item Value
Number of KMO sampling suitability 0.867
Bartlett sphericity test Approximate chi-square 1506.803
Free degree 21
Conspicuousness <0.001
Table 6 Results of KMO and Bartlett test
Item Value
Number of KMO sampling suitability 0.841
Bartlett sphericity test Approximate chi-square 1503.650
Free degree 15
Conspicuousness <0.001

3.4 Correlation analysis

Table 7 shows significant positive correlations among information, interactivity, cognitive image, emotional image, and rural tourism intention, with correlation coefficients ranging from 0.295 to 0.599 (P<0.01). The strongest correlation was between cognitive and emotional images, indicating that emotional image perception also strengthens as cognitive image perception increases. Conversely, the correlation between interactivity and rural tourism intention was the weakest, suggesting that while interactivity has a positive effect, its impact on rural tourism intention is relatively limited.
Table 7 Matrix of correlation coefficient between the variables
Variable Informedness Interactivity Cognitive image Emotional image Rural tourism willingness
Informedness 1
Interactivity 0.560** 1
Cognitive image 0.530** 0.371** 1
Emotional image 0.572** 0.302** 0.599** 1
Rural tourism willingness 0.511** 0.295** 0.465** 0.472** 1

Note: ** indicates P < 0.01.

3.5 Regression analysis

(1) Regression analysis of rural tourism willingness
As shown in Table 8, models 1 and 2 employed information and interactivity as independent variables and rural tourism willingness as the dependent variable. The F-values for these models were 133.801 and 36.128, respectively, both statistically significant at P<0.001, confirming the validity of the regression models. The regression coefficients for information and interactivity were 0.130 and 0.078, respectively, both significant at P<0.001, indicating that both factors substantially positively impact rural tourism willingness. Similarly, models 3 and 4 used cognitive and emotional images as independent variables and rural tourism willingness as the dependent variables. The F-values for these models were 104.449 and 108.393, respectively, both significant at P< 0.001. The regression coefficients for cognitive and emotional images were 0.112 and 0.108, respectively, statistically significant at P<0.001. These results demonstrate that cognitive and emotional image perceptions significantly and positively influence rural tourism willingness.
Table 8 Regression analysis of rural tourism willingness
Variable Rural tourism willingness Rural tourism wish
Model 1 Model 2 Model 3 Model 4
Constant 0.273*** 0.464*** 0.349*** 0.373***
Informedness 0.130***
Interactivity 0.078***
Cognitive image 0.112***
Emotional image 0.108***
F 133.801 36.128 104.449 108.393
P <0.001 <0.001 <0.001 <0.001
R2 0.261 0.087 0.216 0.222

Note: *** indicates P < 0.001.

(2) Regression analysis of destination image
As shown in Table 9, regression analyses were conducted with models 6 and 7, where the independent variables were information and interactivity, and the dependent variable was cognitive image. The F-values for these models were 147.734 and 60.638, respectively, both significant at P<0.001, confirming that the regression models were statistically significant. The regression coefficients for information and interactivity were 0.557 and 0.408, respectively, both significant at P<0.001, indicating that both factors significantly positively affect the cognitive image. Similarly, in models 8 and 9, where information and interactivity were independent variables, and the emotional image was the dependent variable, the F-values were 184.208 and 38.162, respectively, both significant at P<0.001. The regression coefficients for information and interactivity were 0.636 and 0.352, respectively, both significant at P<0.001, demonstrating that both factors significantly influence the emotional image.
Table 9 Destination image regression analysis
Variable Cognitive image Emotional image
Model 6 Model 7 Model 8 Model 9
Constant 1.573*** 2.116*** 1.208*** 2.263***
Informedness 0.557*** 0.636***
Interactivity 0.408*** 0.352***
F 147.734 60.638 184.208 38.162
P <0.001 <0.001 <0.001 <0.001
R2 0.280 0.138 0.327 0.091

Note: ***P < 0.001.

3.6 Testing the mediating effect of destination image perception

3.6.1 The mediating role of destination image between information and rural tourism willingness

As shown in Table 10, a mediation analysis was conducted using the PROCESS macro with 5000 bootstrap samples. Information was used as the independent variable, cognitive image perception as the mediating variable, and rural tourism willingness as the dependent variable. The main effect was 0.130 (95% CI (LLCI=0.1079, ULCI=0.1520), indicating statistical significance. The direct effect was 0.094, 95% CI (LLCI=0.0684, ULCI=0.1187), while the indirect effect was 0.036, 95% CI (LLCI=0.0229, ULCI=0.0521). Since the confidence intervals did not contain zero, the mediation effect was significant, accounting for 27.68% of the total effect.
Table 10 Test of the intermediary effect of the cognitive image in information and rural tourism willingness
Model
hypothesis
Item Effect SE 95% CI
LLCI ULCI
Information cognitive image perception of rural tourism willingness Main effect 0.130 0.011 0.1079 0.1520
Direct effect 0.094 0.013 0.0684 0.1187
Indirect effect 0.036 0.008 0.0229 0.0521
Similarly, in Table 11, information was used as the independent variable, emotional image perception as the mediating variable, and rural tourism willingness as the dependent variable. The main effect was 0.130, 95% CI (LLCI = 0.1079, ULCI = 0.1520), while the direct effect was 0.091, 95% CI (LLCI = 0.0651, ULCI = 0.1172). The indirect effect was 0.039, 95% CI (LLCI = 0.0225, ULCI = 0.0585). These results indicate a partial mediation effect, accounting for 30.0% of the total effect.
Table 11 Test of the intermediary effect of the emotional image in information and rural tourism willingness
Model
hypothesis
Item Effect SE 95% CI
LLCI ULCI
Information and emotional image perception of rural tourism willingness Main effect 0.130 0.011 0.1079 0.1520
Direct effect 0.091 0.013 0.0651 0.1172
Indirect effect 0.039 0.009 0.0225 0.0585

3.6.2 The mediating role of destination image between interactivity and the rural tourism willingness

According to Table 12, a mediation analysis was conducted using interactivity as the independent variable, cognitive image perception as the mediating variable, and rural tourism willingness as the dependent variable. The main effect was 0.078, 95% CI (LLCI = 0.0528, ULCI = 0.1041), the direct effect was 0.038, 95% CI (LLCI = 0.0124, ULCI = 0.0631), and the indirect effect was 0.041, 95% CI (LLCI = 0.0266, ULCI = 0.0579). Since the confidence intervals did not contain zero, the mediation effect was significant, accounting for 52.56% of the total effect.
Table 12 Test of the intermediary effect of the cognitive image on interactivity and rural tourism willingness
Model
hypothesis
Item Effect SE 95% CI
LLCI ULCI
Interactive cognitive image perception of rural tourism willingness Main effect 0.078 0.013 0.0528 0.1041
Direct effect 0.038 0.013 0.0124 0.0631
Indirect effect 0.041 0.008 0.0266 0.0579
Similarly, in Table 13, interactivity was the independent variable, emotional image perception was the mediating variable, and rural tourism willingness was the dependent variable. The main effect was 0.078, 95% CI (LLCI = 0.0528, ULCI = 0.1041), while the direct effect was 0.045, 95% CI (LLCI = 0.0201, ULCI = 0.0690), and the indirect effect was 0.034, 95% CI (LLCI = 0.0210, ULCI = 0.0510). The mediation effect was statistically significant, accounting for 43.59% of the total effect.
Table 13 Test of the intermediary effect of emotional image on interactivity and rural tourism willingness
Model
hypothesis
Item Effect SE 95% CI
LLCI ULCI
Interactive emotional image perception of rural tourism willingness Main effect 0.078 0.013 0.0528 0.1041
Direct effect 0.045 0.012 0.0201 0.0690
Indigo effect 0.034 0.008 0.0210 0.0510

4 Discussion and conclusions

This paper examines the impact of UGC short videos on the TikTok platform on tourists’ willingness to travel to rural areas, incorporating destination image perception as a key mediating variable in the analysis. By exploring the interaction mechanisms among TikTok UGC short videos, rural tourism willingness, and destination image perception, this study establishes the relationships among these variables. The research findings, derived from empirical analysis, are as follows:
First, the information quality and interactivity of UGC short videos on TikTok significantly influence tourists’ willingness to engage in rural tourism. In the regression analysis examining the effects of these factors on rural tourism willingness, the P-value was less than 0.001, indicating a direct and significant positive impact. This finding aligns with previous research by Li and Tu (2024) and Zhu et al. (2022), who concluded that UGC short videos effectively enhance tourists’ travel intentions (Polat et al., 2023). Furthermore, research suggests that tourist destinations can attract potential visitors by developing effective short videos (Wu and Lai, 2024). This study extends the findings of Bai et al. (2023) by applying the impact of UGC on tourists’ travel willingness to rural tourist attractions. Additionally, UGC short videos indirectly influence potential tourists’ willingness to engage in rural tourism through the mediating role of destination image perception. This indirect effect operates through both cognitive and emotional dimensions of destination image perception. Similarly, Jiang et al. (2022) identified a mediating effect of destination image between media influence and tourism intention.
Second, tourists’ willingness to visit rural destinations is influenced by their perception of the destination’s image. In an in-depth regression analysis examining the relationship between cognitive and emotional image perception and rural tourism willingness, both factors demonstrated a high correlation, with P-values less than 0.001. Numerous studies have confirmed the positive impact of destination image on tourists’ travel willingness (Jalilvand et al., 2012; Chaulagain et al., 2019). However, some studies have found no significant relationship between the two variables (Pratt and Sparks, 2014; Whang et al., 2016). These discrepancies may stem from differences in research regions, methodologies, and variable selection.
Third, the information quality and interactivity of TikTok UGC short videos play a crucial role in shaping tourists’ image perception of rural tourism destinations. Regression analysis indicates that the P-values for both factors are below the significance threshold of 0.001, confirming their significant and positive influence on the formation of tourists’ perceptions of rural tourism destinations. This study supports previous findings that UGC short videos contribute to developing tourism destination images (Lam et al., 2020). Over time, UGC short videos have evolved from text-based content to multimodal formats that integrate images, videos, and text, thereby playing an increasingly vital role in shaping the image of tourist destinations (Hu and Geng, 2024). This conclusion is consistent with the research of Marchiori and Cantoni (2015), Marine-Roig and Anton Clavé (2016), and Lee and Park (2023).

5 Countermeasures and suggestions

(1) Publish UGC short videos with high information quality. The findings indicate that the informational quality of UGC short videos significantly influences tourists’ willingness to travel to rural areas. Therefore, rural tourism destination managers must implement strategies that ensure UGC short videos shared by tourists comprehensively and accurately convey relevant information about rural tourism destinations. These videos should present an authentic and compelling attraction to potential tourists. If viewers perceive the content as sincere, reliable, and engaging, they are more likely to develop an interest in visiting and ultimately make travel decisions. To achieve this, managers can organize themed activities and invite experienced travelers or social media influencers skilled in short video creation to serve as tourism ambassadors. These individuals can immerse themselves in the local environment, capturing its natural landscapes, cultural heritage, and culinary specialties. For example, they can document the morning mist swirling over rice fields, villagers weaving intricate patterns on ancient looms, or groups gathered around bonfires at night, listening to centuries-old legends. Such content comprehensively depicts the destination’s unique appeal and enhances its attractiveness by emphasizing authenticity and depth.
(2) Encourage tourists to publish videos and engage with other users. The findings also reveal that the interactive nature of UGC short videos plays a crucial role in influencing tourists’ willingness to visit rural areas. Therefore, enhancing the engagement tourists experience when interacting with other users on TikTok and similar platforms is vital. Tourists should be encouraged to share videos featuring rural tourism destinations, which can then facilitate real-time communication and feedback among users. When other users express interest in specific content, they should be able to receive prompt and accurate responses from content creators, ensuring timely and effective information exchange. Additionally, potential tourists should be able to search for videos related to rural destinations by browsing content uploaded by other travelers or referring to official tourism accounts on TikTok. To further encourage engagement, managers can establish dedicated sections on social media platforms or official websites to curate and showcase high-quality UGC short videos. These sections can incorporate interactive features that allow users to like, comment, share, and even directly communicate with video creators. Such interactions increase content visibility, stimulate curiosity, and encourage greater participation. This creates a positive feedback loop, where watching videos leads to interest in rural tourism, fostering travel intentions and ultimately resulting in travel decisions.
(3) Strengthen the image construction and promotion of rural tourism destinations. The results indicate that the cognitive and emotional aspects of a destination’s image significantly influence tourists’ willingness to participate in rural tourism. From a cognitive perspective, rural tourism managers should highlight the unique characteristics of rural environments, ensuring that tourism products and services are carefully developed to provide high-quality experiences. From an emotional perspective, the dissemination of UGC short videos should aim to evoke strong emotional responses among potential tourists. This can be achieved by developing immersive facilities and creating atmospheres that align with tourists’ emotional expectations. Promotional campaigns should feature compelling UGC short videos that resonate with viewers, sparking their imagination and inspiring a desire to visit scenic landscapes characterized by clear waters and lush green mountains. For example, tourism managers can introduce themed activities that allow visitors to engage in traditional farming, harvesting, and agricultural production, enabling them to experience the joys of rural life firsthand. Additionally, they can offer opportunities for tourists to savor authentic rural cuisine while learning about the origins of ingredients and the cultural significance of traditional cooking methods. These interactive experiences provide a deeper understanding of rural heritage and enhance visitors’ lasting impressions of the destination through meaningful, hands-on participation.

6 Limitation and future research

This study primarily collected data through a questionnaire survey; however, the sample size is limited and may not fully reflect the actual behaviors and preferences of all tourists. Given this limitation, there is significant room for future research to expand. First, to enhance the representativeness and generalizability of the study, the sample coverage should be substantially broadened. It is essential not only to achieve a wider geographical distribution—encompassing respondents from urban and rural areas, as well as both developed and underdeveloped regions—but also to increase sample diversity across multiple demographic dimensions, including age, gender, occupation, and income level. Particular attention should be given to underrepresented groups in previous studies, such as teenagers, older adults, and niche interest communities, to understand better how the frequency of TikTok UGC short videos influences the rural tourism intentions of different tourist groups.
Second, future research should explore content analysis as a critical method for examining media effects. This includes, but is not limited to, the categorization of TikTok short video content types—such as natural scenery, cultural experiences, culinary explorations, and rural tourism guides—as well as an in-depth analysis of different modes of presentation (e.g., static images with text descriptions, dynamic videos, and interactive live broadcasts). Investigating how these distinct elements individually or synergistically shape tourists’ psychological perceptions can provide valuable insights into their decision-making processes regarding rural tourism. Such meticulous content analysis can help identify which types of content most effectively stimulate tourists’ interest and willingness to travel.
Finally, given the diversity of social media and video- sharing platforms, future research should adopt a comparative perspective by analyzing the impact of UGC short videos on rural tourism intentions across different platforms. By comparing platforms such as TikTok, Kwai, and Xiaohongshu, researchers can explore how variations in content ecosystems, user demographics, and interaction mechanisms lead to differing effects on tourists’ decision-making. A cross-platform comparative analysis can not only highlight the unique strengths and limitations of each platform but also provide strategic recommendations for rural tourism marketers. This can enable them to leverage different platforms’ resources effectively and maximize potential tourists’ interest and engagement in rural tourism.
[1]
Ayeh J K, Au N, Law R. 2013. Predicting the intention to use consumer-generated media for travel planning. Tourism Management, 35: 132-143.

[2]
Bai W B, Lee T J, Wu F, et al. 2023. How effective are user-generated travel short videos in promoting a destination online? Journal of Vacation Marketing, 29: 13567667231221816. DOI: 10.1177/13567667231221816.

[3]
Beerli A, Martin J D. 2004. Factors influencing destination image. Annals of Tourism Research, 31(3): 657-681.

[4]
Chaulagain S, Wiitala J, Fu X X. 2019. The impact of country image and destination image on US tourists’ travel intention. Journal of Destination Marketing & Management, 12: 1-11.

[5]
Cheng X Q, Jiang Y Y, Gao J. 2023. Generative expression of national identity between media discourse and social consensus—Based on SOR model. Journal of Shandong University of Physical Education, 39(4): 9-19. (in Chinese)

[6]
Crompton J L. 1979. An assessment of the image of Mexico as a vacation destination and the influence of geographical location upon that image. Journal of Travel Research, 17(4): 18-23.

[7]
Deng X J, Guan Y. 2022. Available, visible and acceptable: travel intention generation mechanism for mobile short video users. Modern Communication (Journal of Communication University of China), 44(12): 136-145. (in Chinese)

[8]
Hu T, Geng J. 2024. Research on the perception of the terrain image of the tourism destination based on multimodal user-generated content data. PeerJ Computer Science, 10: e1801. DOI: 10.7717/peerj-cs.1801.

[9]
Huang Y H, Lai Q F, Lin F F. 2018. The influence of social media on tourist travel intention—Empirical study based on destination image perception. Resource Development and Market, 34(9): 1327-1331, 1261. (in Chinese)

[10]
Jalilvand M R, Samiei N, Dini B, et al. 2012. Examining the structural relationships of electronic word of mouth, destination image, tourist attitude toward destination and travel intention: An integrated approach. Journal of Destination Marketing & Management, 1: 134-143.

[11]
Jiang X F, Qin J X, Gao J G, et al. 2022. The mediation of perceived risk’s impact on destination image and travel intention: An empirical study of Chengdu, China during COVID-19. Plos One, 17(1): e0261851. DOI: 10.1371/journal.pone.0261851.

[12]
Kelman H C. 2017. Processes of opinion change. London, UK: Routledge.

[13]
Kong B X, Shi X, Yang F. 2021. Research on the mechanism of the influence of rural tourism information quality on the willingness of travel destinations in social media. Journal of University of Science and Technology of China, 51(7): 542-561. (in Chinese)

[14]
Lam J M S, Ismail H, Lee S A. 2020. From desktop to destination: User-generated content platforms, co-created online experiences, destination image and satisfaction. Journal of Destination Marketing & Management, 18: 100490. DOI: 10.1016/j.jdmm.2020.100490.

[15]
Lee J S, Park S. 2023. A cross-cultural anatomy of destination image: An application of mixed-methods of UGC and survey. Tourism Management, 98: 104746. DOI: 10.1016/j.tourman.2023.104746.

[16]
Li H, Tu X. 2024. Who generates your video ads? The matching effect of short-form video sources and destination types on visit intention. Asia Pacific Journal of Marketing and Logistics, 36(3): 660-677.

[17]
Li J H, Wang H T. 2023. Research on tourism image perception of mountain-type world heritage site in China. Resource Development and Market, 39(5): 629-634. (in Chinese)

[18]
Li X Y. 2023. Research on user purchase intention of short video platform based on information quality theory. Intelligence Science, 41(11): 103-110. (in Chinese)

[19]
Liu D Q. 2006. Some analysis on rural tourism, agricultural tourism and folk tourism. Journal of Tourism, (3): 12-19. (in Chinese)

[20]
Liu L. 2013. Image perception of tourism destination and tourist tourism intention—Comprehensive research based on the perspective of film and television tourism. Journal of Tourism, 28(9): 61-72. (in Chinese)

[21]
Marchiori E, Cantoni L. 2015. The role of prior experience in the perception of a tourism destination in user-generated content. Journal of Destination Marketing & Management, 4(3): 194-201.

[22]
Marine-Roig E, Anton Clavé S. 2016. A detailed method for destination image analysis using user-generated content. Information Technology & Tourism, 15(4): 341-364.

[23]
Meng L, Liu F J, Chen S Y, et al. 2020. Can I arouse you—Research on the influence mechanism of the characteristics of different types of live streaming web celebrity information sources on consumers’ purchase willingness. Nankai Management Review, 23(1): 131-143. (in Chinese)

[24]
Ohanian R. 1990. Construction and validation of a scale to measure celebrity endorsers’ perceived expertise, trustworthiness, and attractiveness. Journal of Advertising, 19(3): 39-52.

[25]
Pearce P L, Lee U I. 2005. Developing the travel career approach to tourist motivation. Journal of Travel Research, 43(3), 226-237.

[26]
Polat E, Çelik F, Ibrahim B, et al. 2023. Unpacking the power of user-generated videos in hospitality and tourism: A systematic literature review and future direction. Journal of Travel & Tourism Marketing, 40(9): 894-914.

[27]
Pratt M A, Sparks B. 2014. Predicting wine tourism intention: Destination image and self-congruity. Journal of Travel & Tourism Marketing, 31(4): 443-460.

[28]
Prayag G, Hosany S, Muskat B, et al. 2017. Understanding the relationships between tourists’ emotional experiences, perceived overall image, satisfaction, and intention to recommend. Journal of Travel Research, 56(1): 41-54.

[29]
Qin J L, Lin L. 2023. An empirical study on residents willingness to pursue rural tourism under the background of rural revitalization. Economic Problems, (6): 113-119. (in Chinese)

[30]
Ruan W Q, Wang M Y, Zhang S N, et al. 2024. Knowledge-based or affection-based? The influence mechanism of heritage tourism interpretation content on tourists’ willingness to inherit culture. Tourism Management, 102: 104876. DOI: 10.1016/j.tourman.2023.104876.

[31]
Song J Y, Li L. 2019. Documentary expression in UGC short video production in the new media era. China Television, (10): 65-69. (in Chinese)

[32]
Stylidis D, Shani A, Belhassen Y. 2017. Testing an integrated destination image model across residents and tourists. Tourism Management, 58: 184-195.

[33]
Tan H R, Liu P L, Li B H. 2021. Image perception of Dalian tourist destination based on network text analysis. Economic Geography, 41(3): 231-239. (in Chinese)

[34]
Tigre M F, Gnoth J, Deans K R. 2015. Localizing cultural values on tourism destination websites. Journal of Travel Research, 54(4): 528-542.

[35]
Wang W, Wang X W, Lou Z Q, et al. 2020. Research on the influencing factors of network public opinion dissemination behavior in user-generated content of mobile video clips from the perspective of information ecology. Information Studies (Theory & Application), 43(3): 24-30. (in Chinese)

[36]
Wang W J, Ye J M, Zhou R, et al. 2022. Research on the influencing factors and action mechanism of the continuous contribution behaviour of UGC short video users. Books and Intelligence, (5): 31-40. (in Chinese)

[37]
Wei R Q, Tang F C. 2016. The social impact mechanism of user-generated content on online shopping—The empirical analysis based on social e-commerce. Economic Management of East China, 30(4): 124-131. (in Chinese)

[38]
Whang H, Yong S, Ko E. 2016. Pop culture, destination images, and visit intentions: Theory and research on travel motivations of Chinese and Russian tourists. Journal of Business Research, 69(2): 631-641.

[39]
Wu X, Lai I K W. 2024. How the creativity and authenticity of destination short videos influence audiences’ attitudes toward videos and destinations: The mediating role of emotions and the moderating role of parasocial interaction with Internet celebrities. Current Issues in Tourism, 27(15): 2428-2447.

[40]
Xing L, Liu K, Zhang J Q. 2023. The influence of the social business platform UGC on the purchase intention of wedding custom clothing. Wool Textile Journal, 51(5): 94-100. (in Chinese)

[41]
Yang Q, Shen Y C. 2017. Research on the influence of WeChat business information source characteristics on consumers’ purchase intention. Journal of Dalian University of Technology (Social Science Edition), 38 ( 2): 27-32. (in Chinese)

[42]
Zhang H M, Liang C Y, Xu J, et al. 2016. Research on influence of special tourism destination image on tourists’ behavioral willingness: The example of wine tourism of the Helan Mountain’ East Piedmont area. Soft Science of China, (8): 50-61. (in Chinese)

[43]
Zhao Y X, Zhu Q H. 2009. The main drivers are affecting user-generated content in the Web 2.0 environment. Library Journal of China, 35(5): 107-116. (in Chinese)

[44]
Zhou J Q. 2020. The influence of different exhibition promotions on city image and tourism willingness—Take the dynamic Macau Promotion Week as an example. World Regional Studies, 29(2): 428-438. (in Chinese)

[45]
Zhu C, Hoc N F L, Gao H C, et al. 2022. How does celebrity involvement influence travel intention? The case of promoting Chengdu on TikTok. Information Technology & Tourism, 24(3): 389-407.

[46]
Zhu J Y, Li Z H, Yang S, et al. 2021. The influence of online negative word of mouth on tourist perception and tourism intention—The regulatory role of professional knowledge. Journal of Huaqiao University (Philosophy and Social Sciences), ( 2): 51-64. (in Chinese)

Outlines

/