×
模态框(Modal)标题
在这里添加一些文本
关闭
关闭
提交更改
取消
确定并提交
×
模态框(Modal)标题
×
期刊
文章
图表
检索
EN
中文
首页
关于期刊
期刊介绍
数据库收录
期刊荣誉
编委会
投稿指南
研究论文/综述
数据论文
版权协议
专辑与专题
专辑
虚拟专题
在线期刊
当期目录
优先出版
过刊浏览
推荐文章
按栏目浏览
阅读排行
下载排行
引用排行
E-mail Alert
RSS
勘误说明
期刊订阅
联系我们
EN
中文
图/表 详细信息
中国农业新质生产力发展水平的区域差异、动态演进及其障碍因子研究
秦琳贵, 刘松岐, 王琬植, 苗丰盛, 谢凤杰
资源与生态学报, 2025, 16(
5
): 1499-1514. DOI:
10.5814/j.issn.1674-764x.2025.05.021
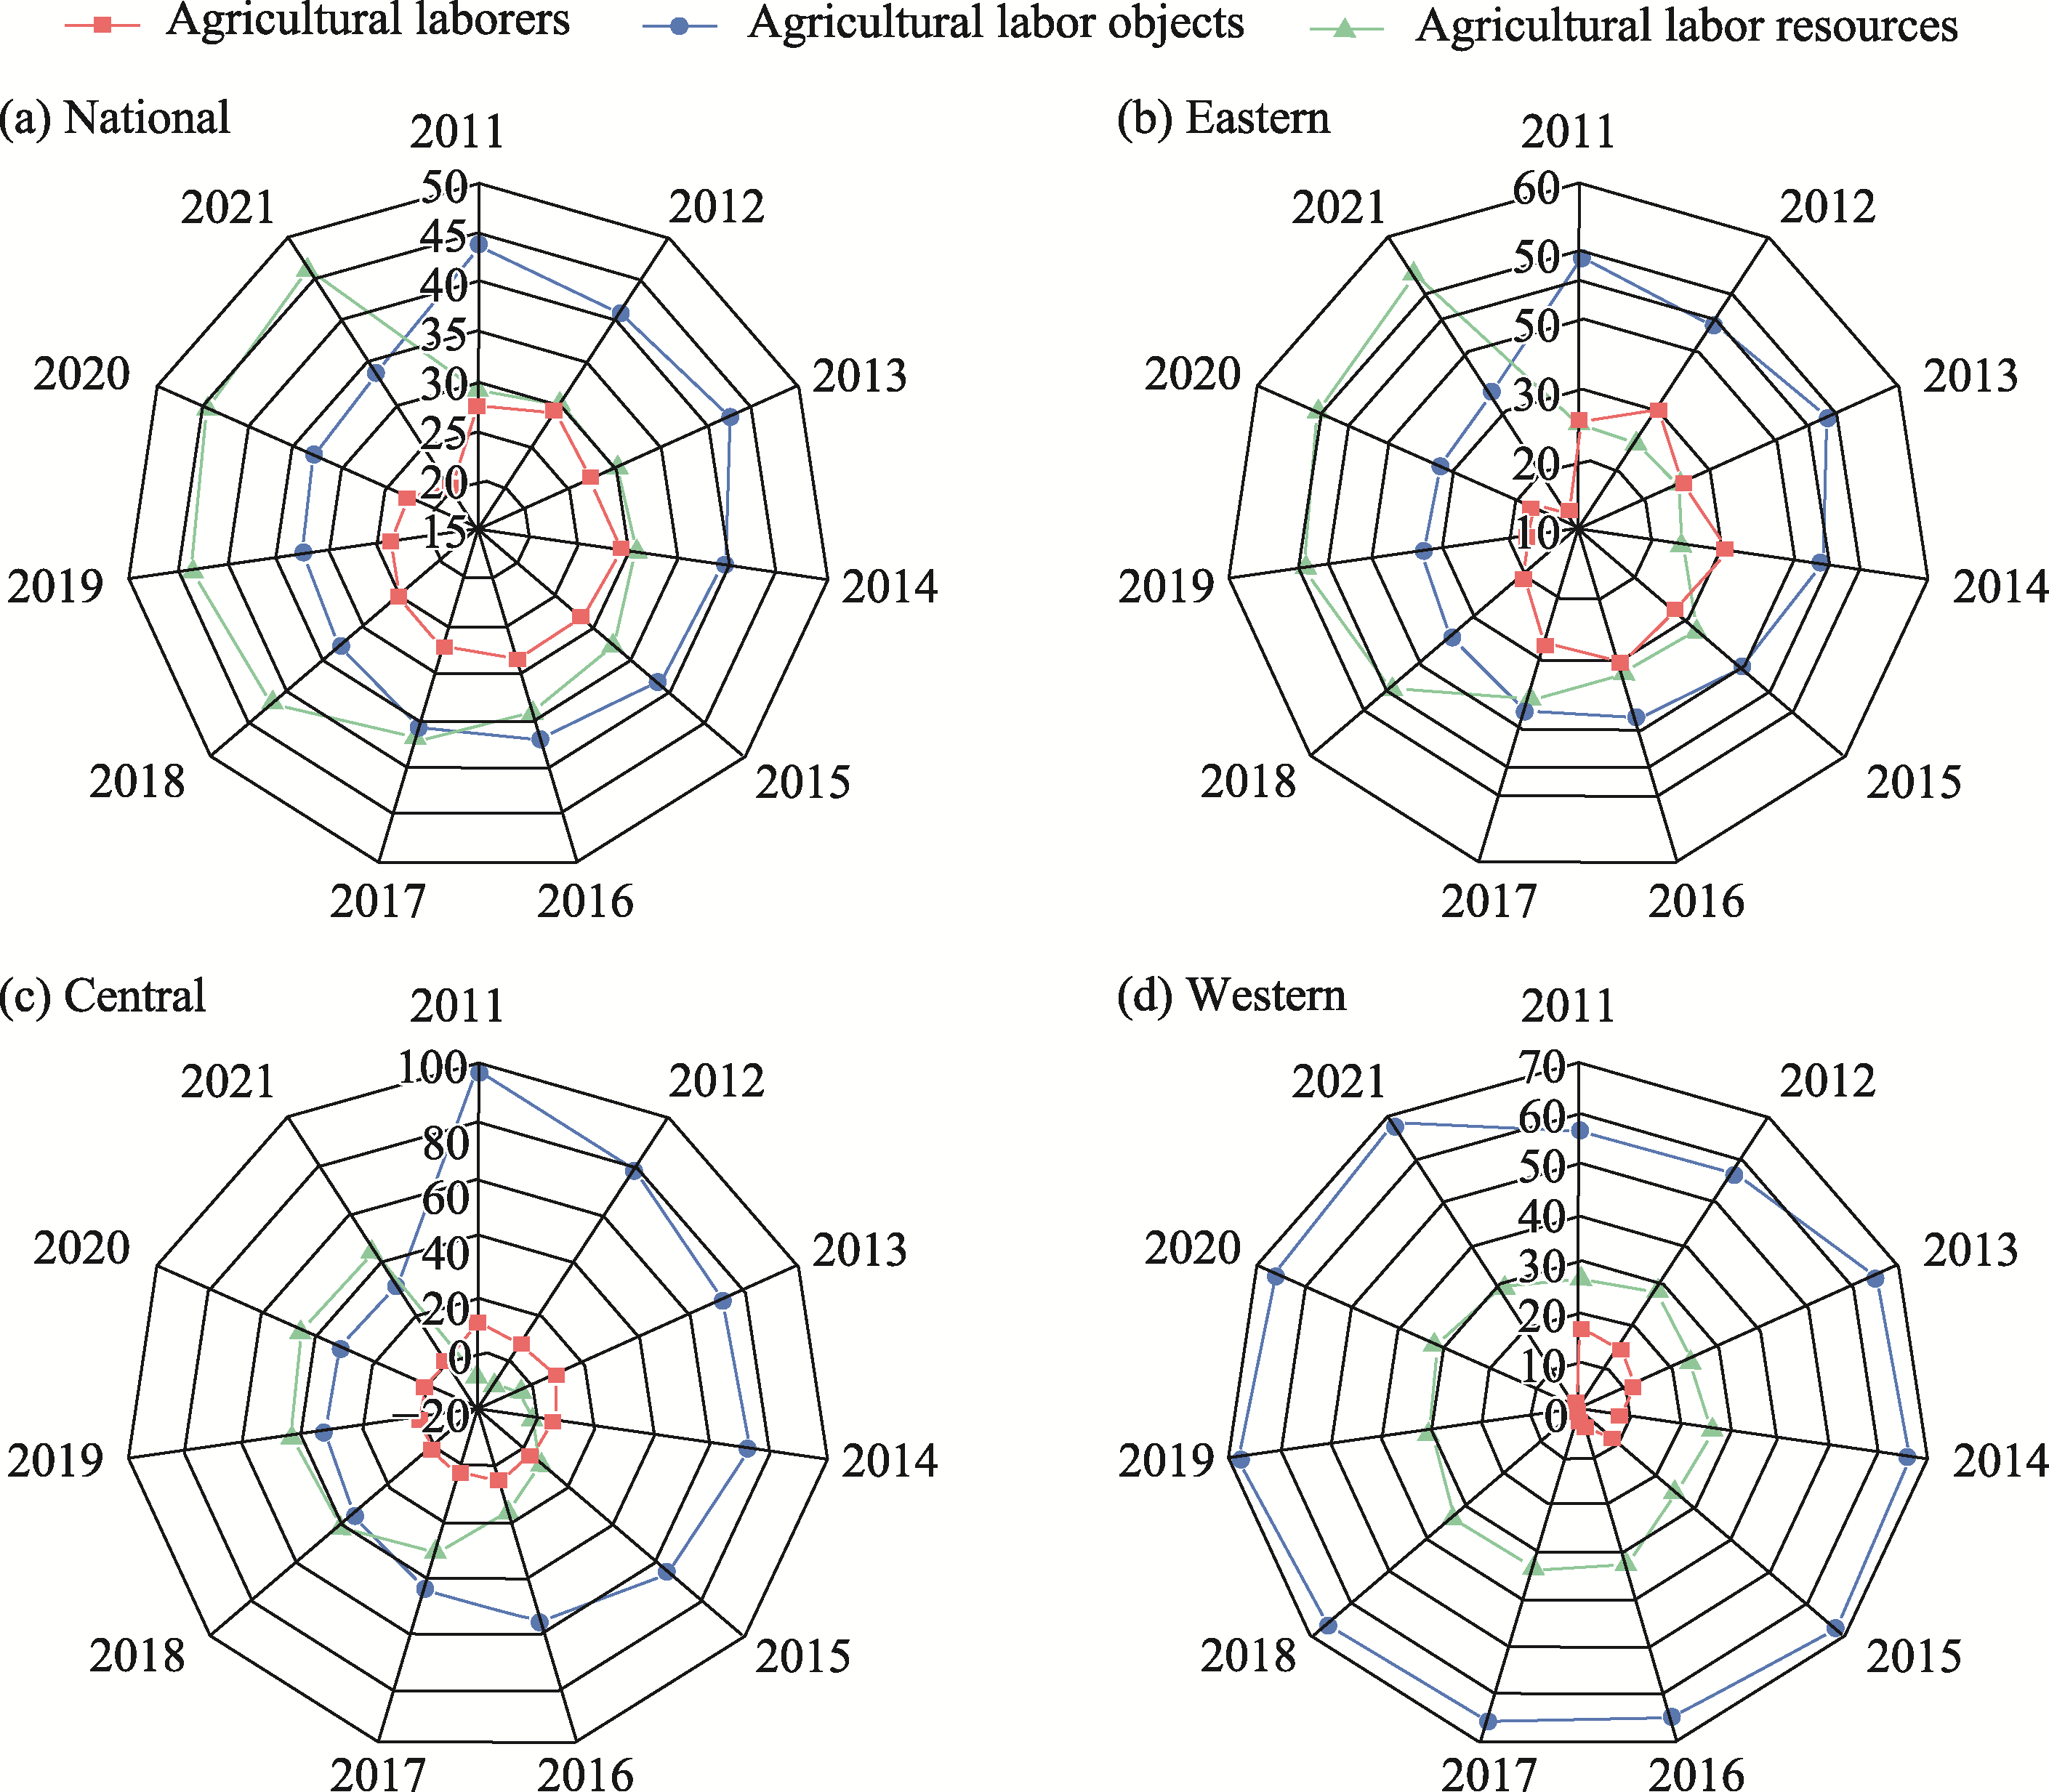
Figure 4
Structural differences of ANQPFs
本文的其它图/表
Table 1
Policies related to ANQPFs from 2024 to 2025
Table 2
Evaluation indicator system of ANQPFs
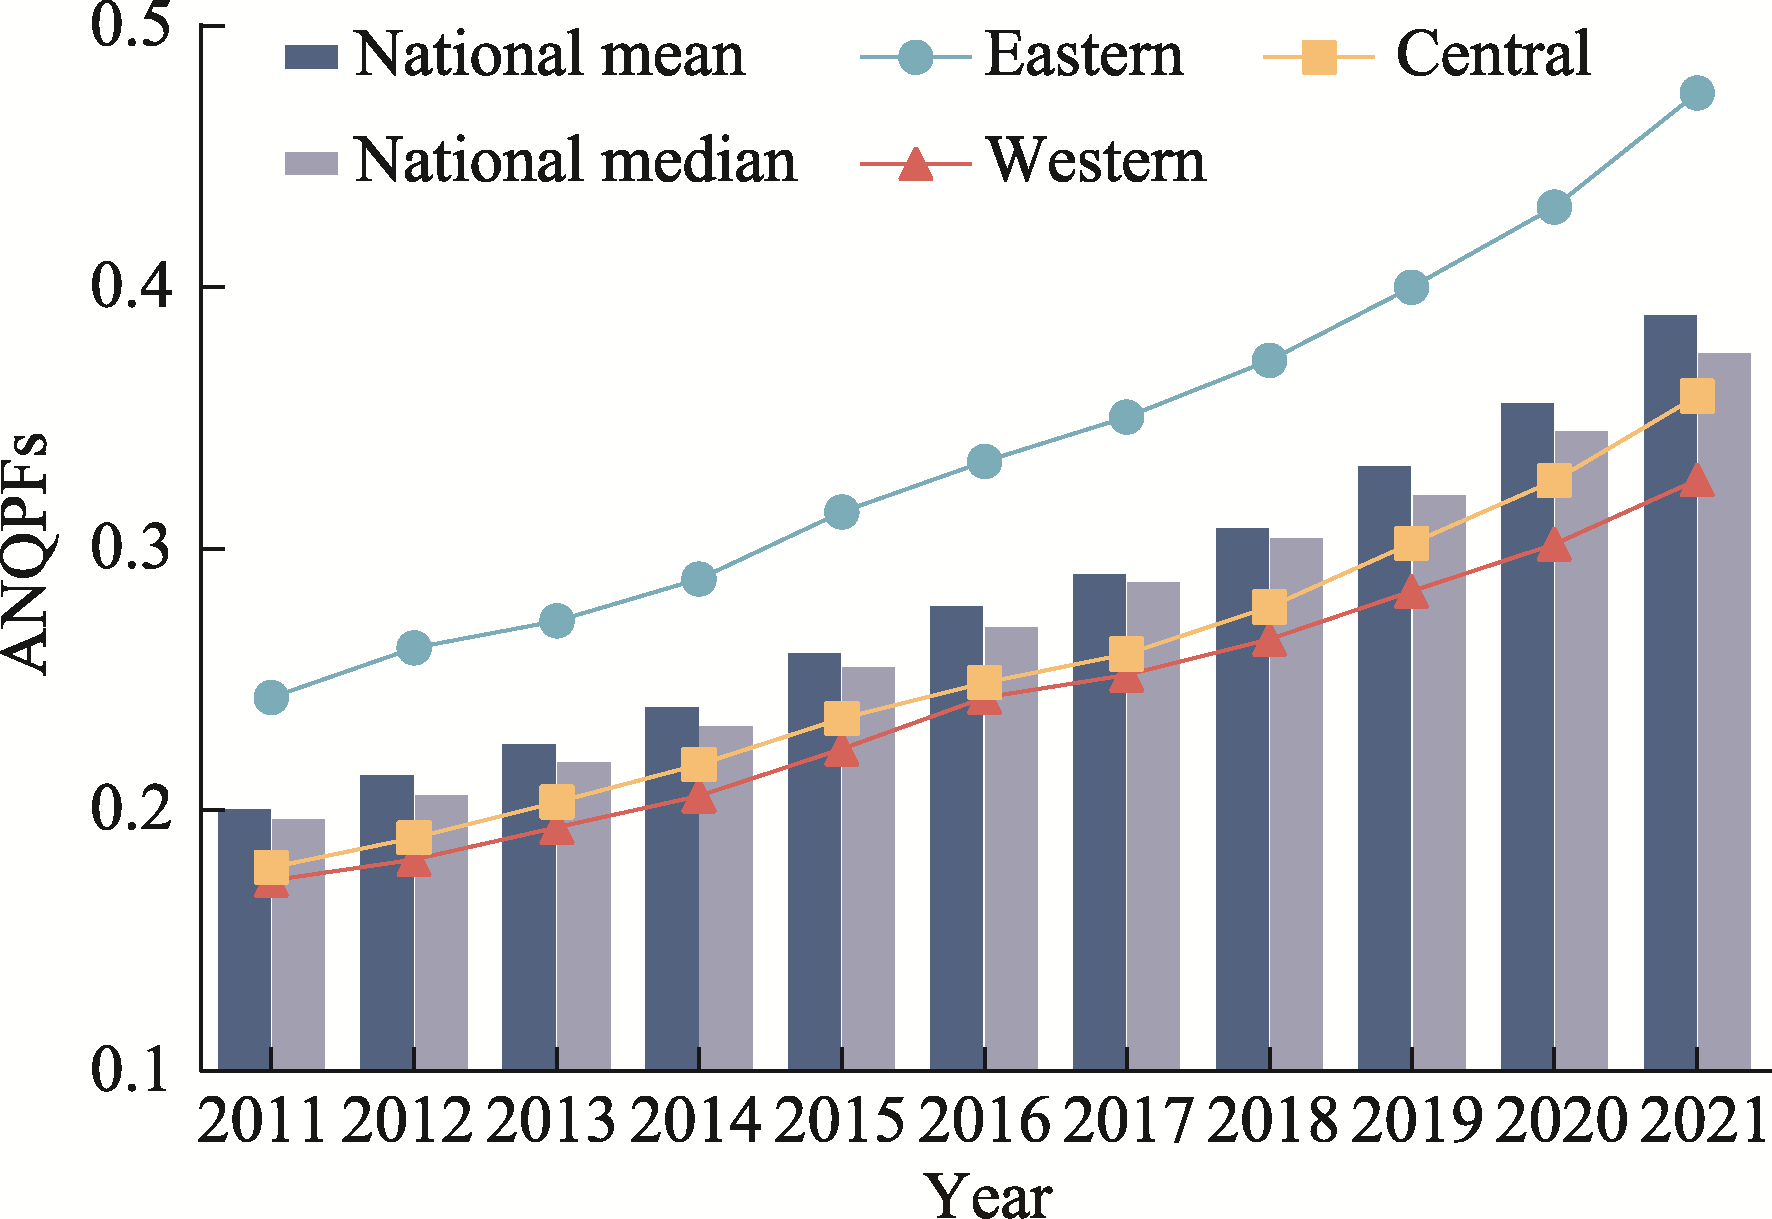
Figure 1
Measurement results of ANQPFs at the national and regional levels
Note: The eastern region includes Beijing, Tianjin, Hebei, Liaoning, Shanghai, Jiangsu, Zhejiang, Fujian, Shandong, Guangdong and Hainan; the central region includes Shanxi, Jilin, Heilongjiang, Anhui, Jiangxi, Henan, Hubei, and Hunan; the western region includes Inner Mongolia, Guangxi, Chongqing, Sichuan, Guizhou, Yunnan, Shaanxi, Gansu, Qinghai, Ningxia, and Xinjiang.
Table 3
Measurement results of ANQPFs at the provincial level
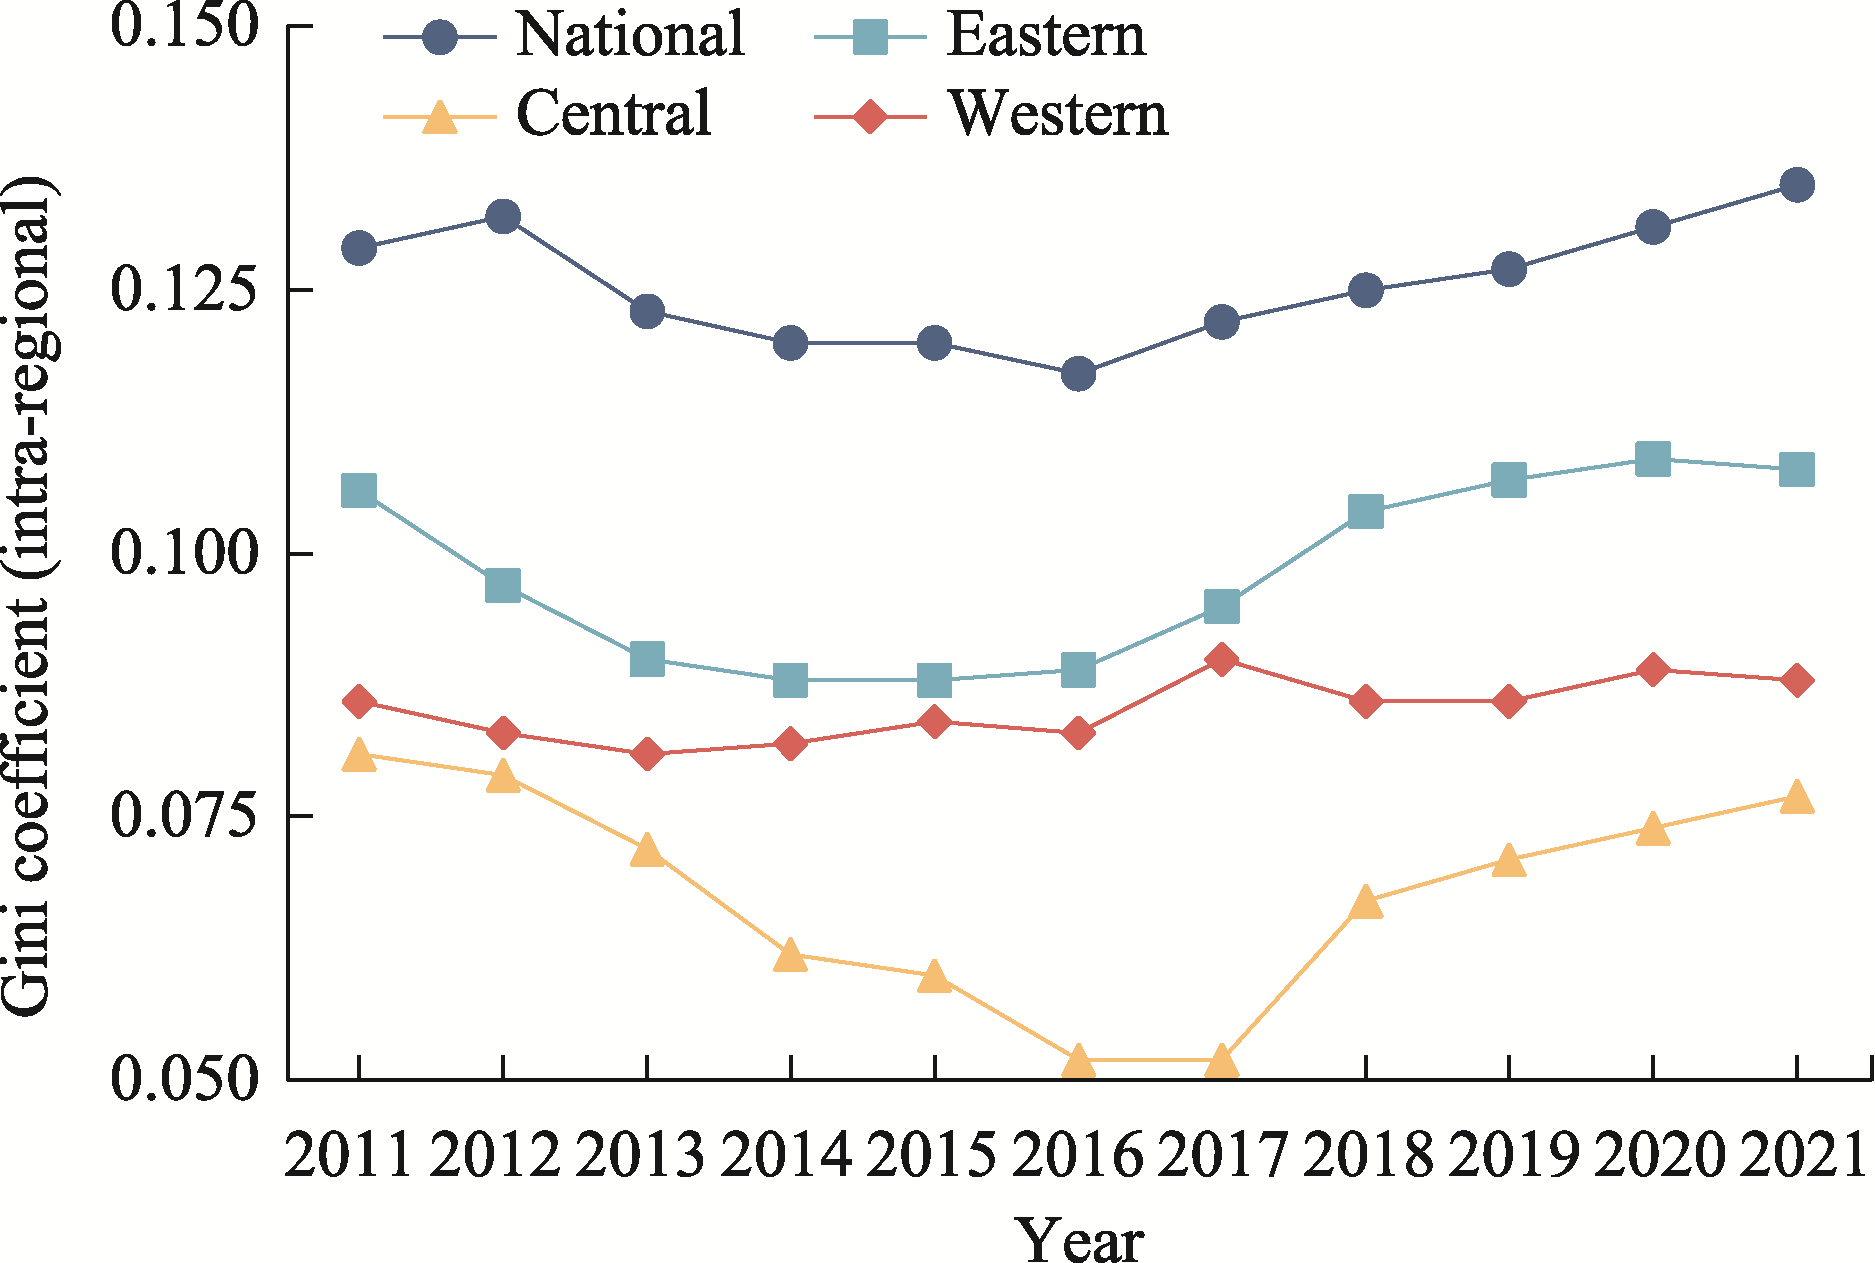
Figure 2
Trends in overall and intra-regional Gini coefficient of ANQPFs
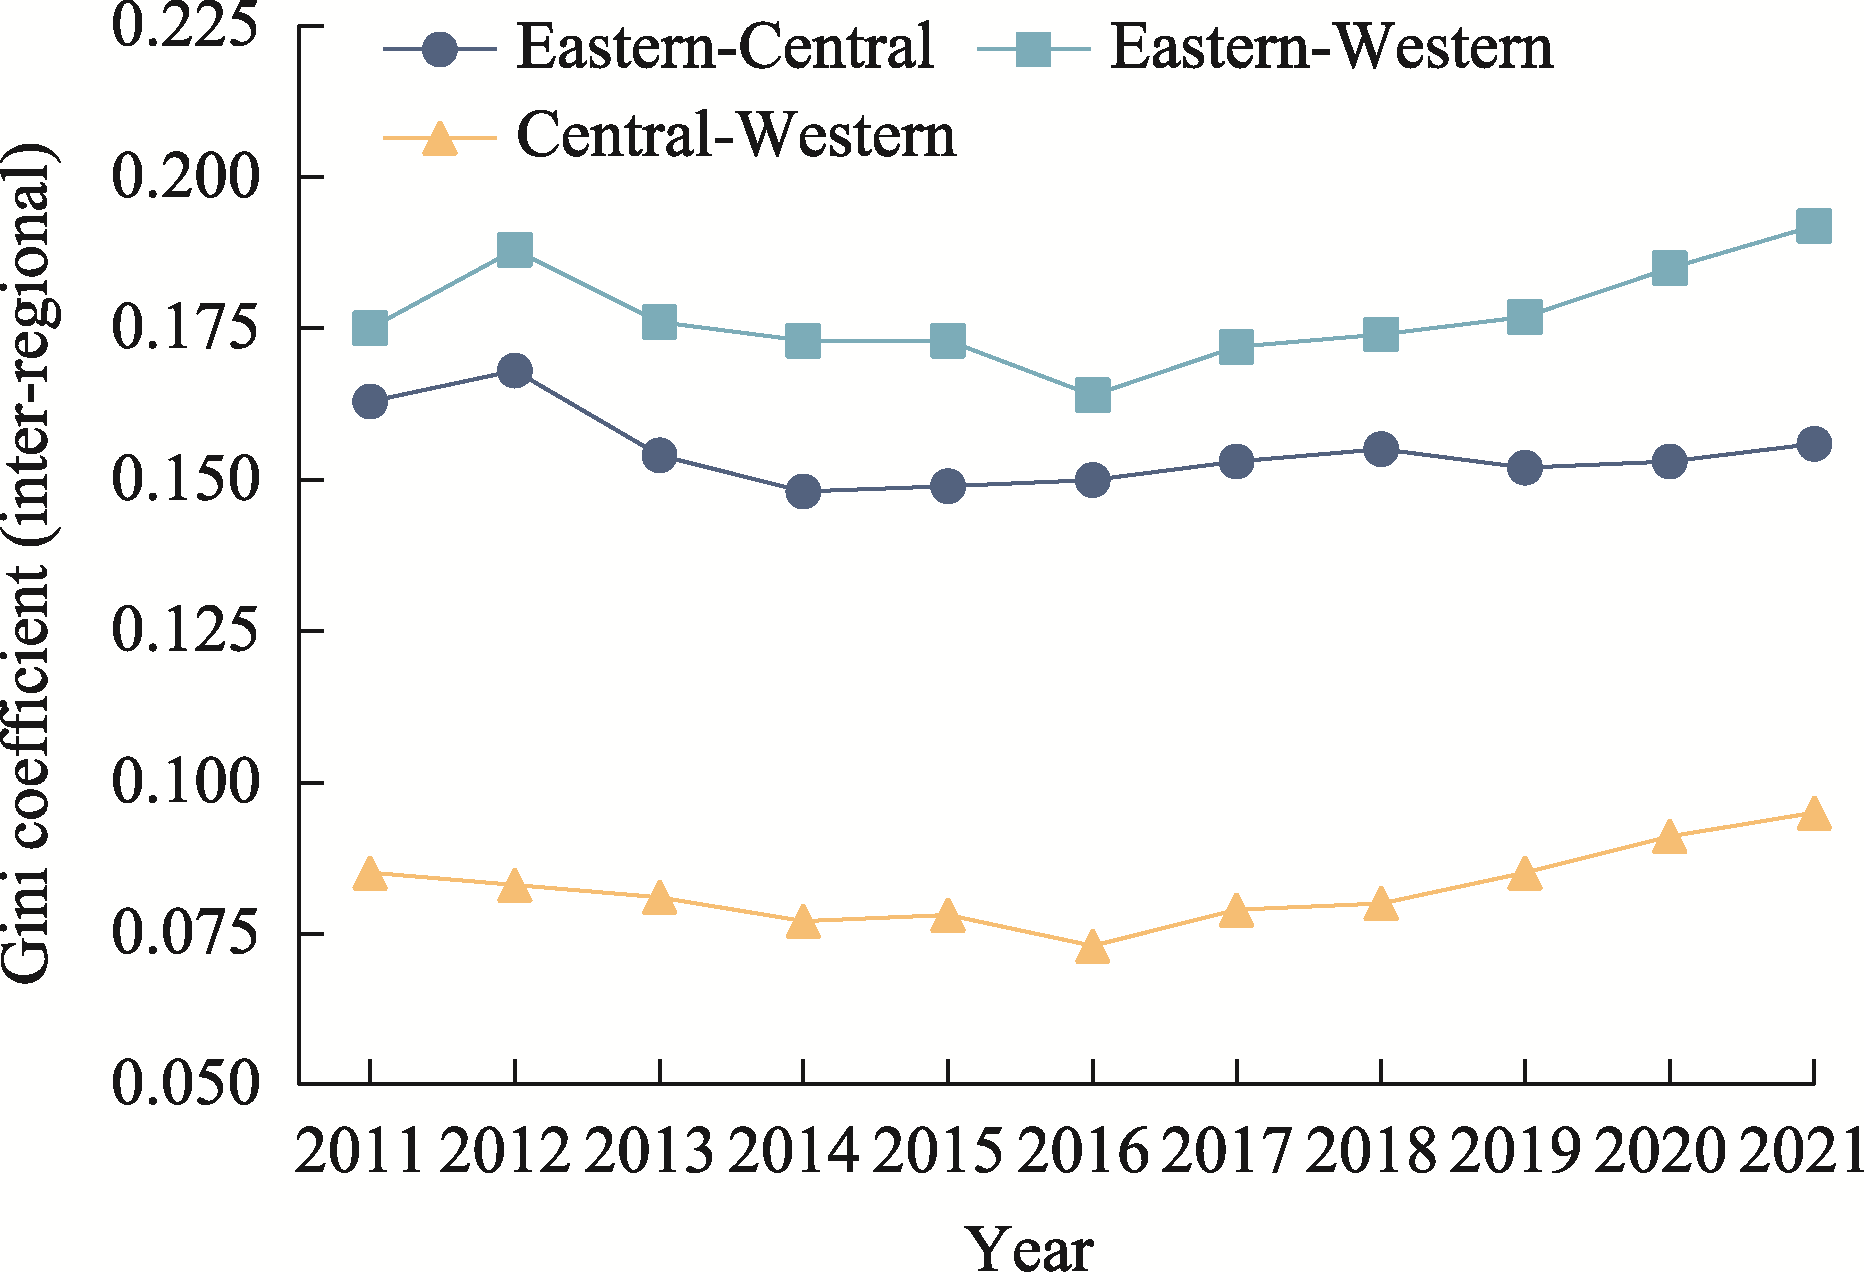
Figure 3
Trends in inter-regional Gini coefficient of ANQPFs
Table 4
Sources of differences and contribution rates
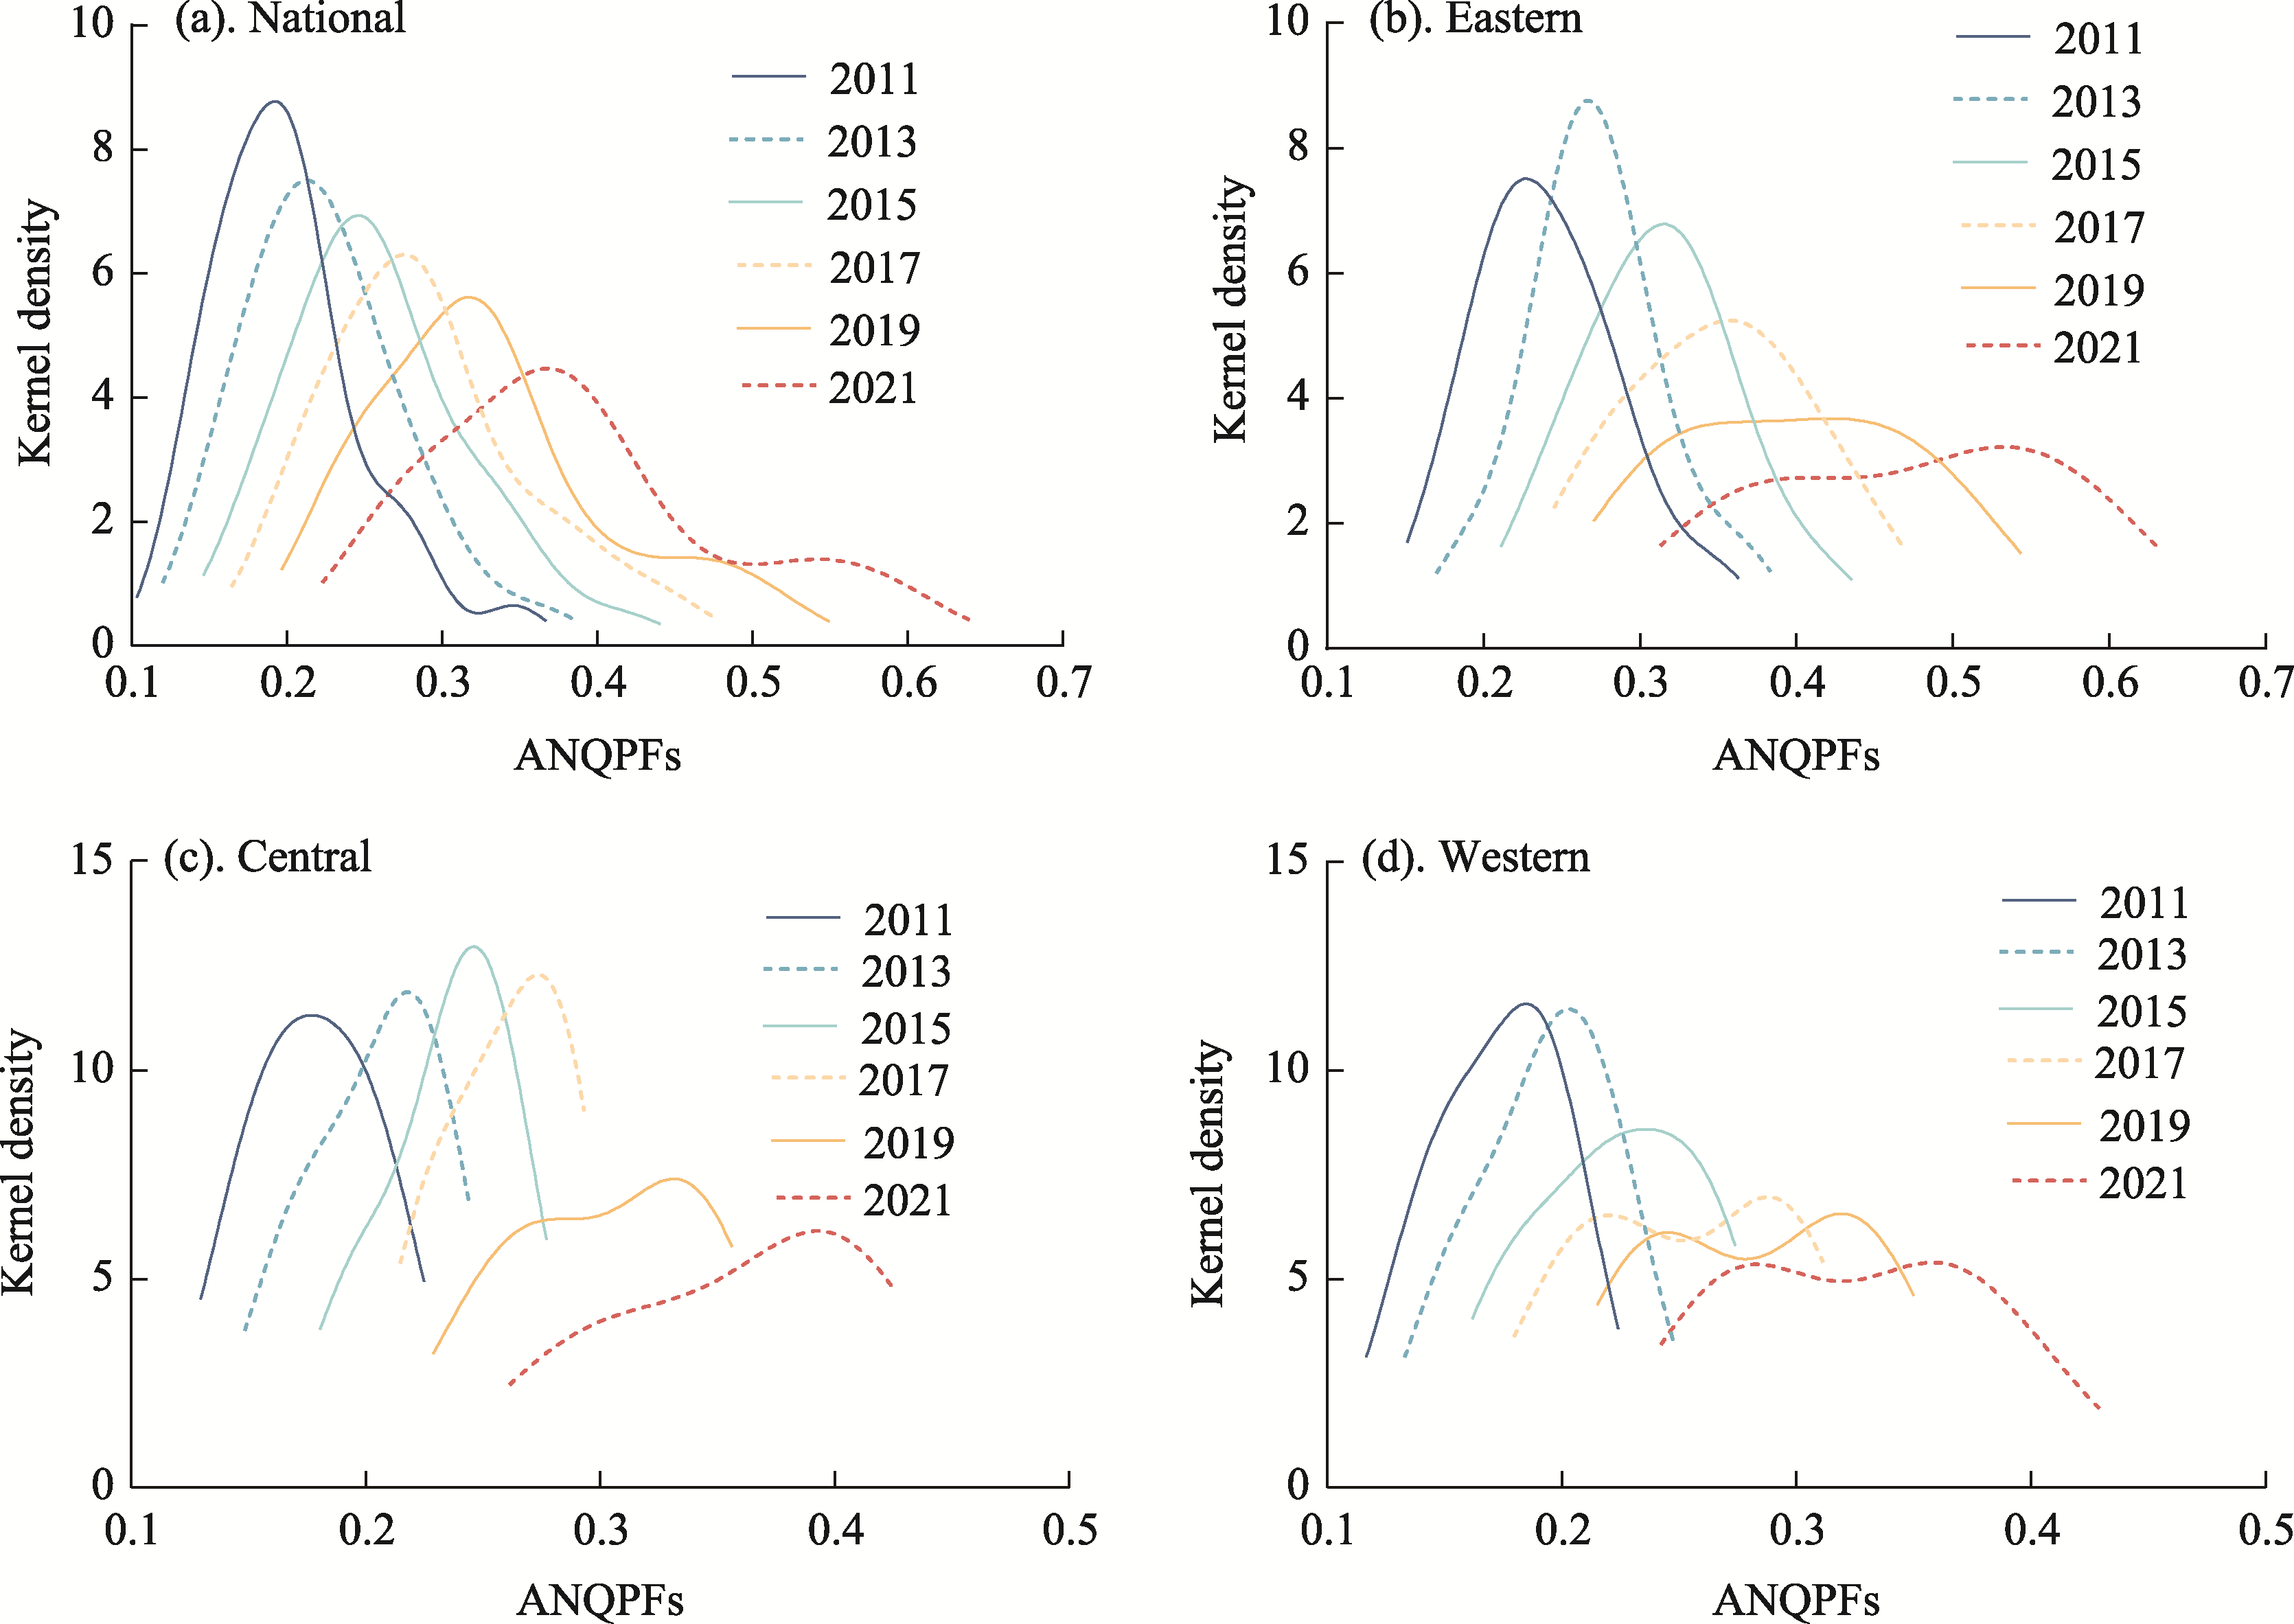
Figure 5
Dynamic distribution characteristics of ANQPFs
Table 5
Markov transition probability matrix of ANQPFs
Table 6
Major obstacle factors of ANQPFs