×
模态框(Modal)标题
在这里添加一些文本
Close
Close
Submit
Cancel
Confirm
×
模态框(Modal)标题
×
Journal
Article
Figure
Search
EN
中文
Home
About Journal
About Journal
Editorial Policies
Indexed in
Awards
Editorial Board
Guide for Authors
Research articles and review
Scientific data paper
Copyright Transfer Statement
Collections
Special Issue
Topics
Browse
Current Issue
Online First
Archive
Highlights
Archive by Subject
Most Viewed
Most Download
Most Cited
E-mail Alert
RSS
Corrigendum
Subscribe
Contact us
EN
中文
Figure/Table detail
Digital Intelligence Empowerment for Optimizing Rural Human Settlement Environments: An Ecological Strategy Based on Bionic Design and Fuzzy Semantic Computing
CHEN Liwei, LIN Xiaohong
Journal of Resources and Ecology
, 2025, 16(
5
): 1528-1539. DOI:
10.5814/j.issn.1674-764x.2025.05.023
Question
Fuzzy semantic value
Standard deviation
Q2-1
3.58
1.379
Q2-2
4.19
0.967
Q2-3
4.14
1.039
Q2-4
4.08
1.051
Q2-5
3.98
1.153
Q2-6
4.32
0.800
Q2-7
3.73
1.248
Q2-8
4.11
1.037
Q2-9
2.87
1.288
Q2-10
4.48
0.543
Table 5
Descriptive statistics of bionic design features (
N
=560)
Other figure/table from this article
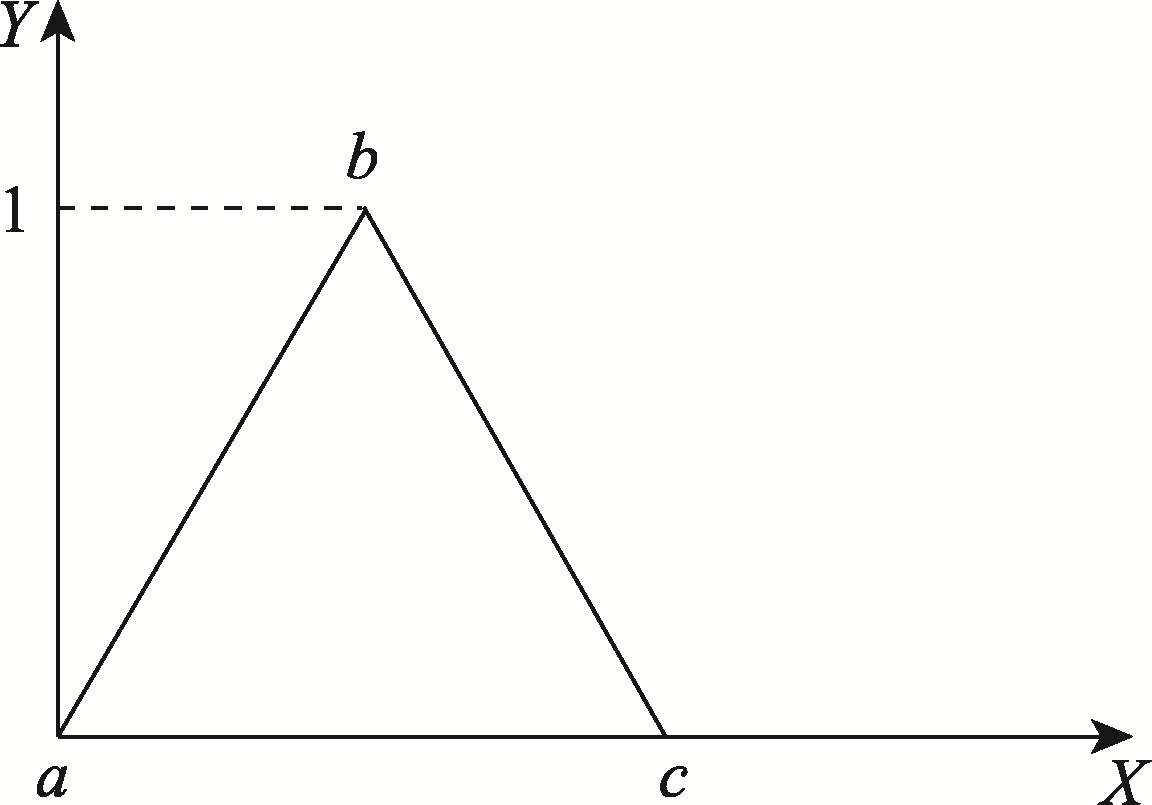
Figure 1
Diagram of the triangular fuzzy number membership degree
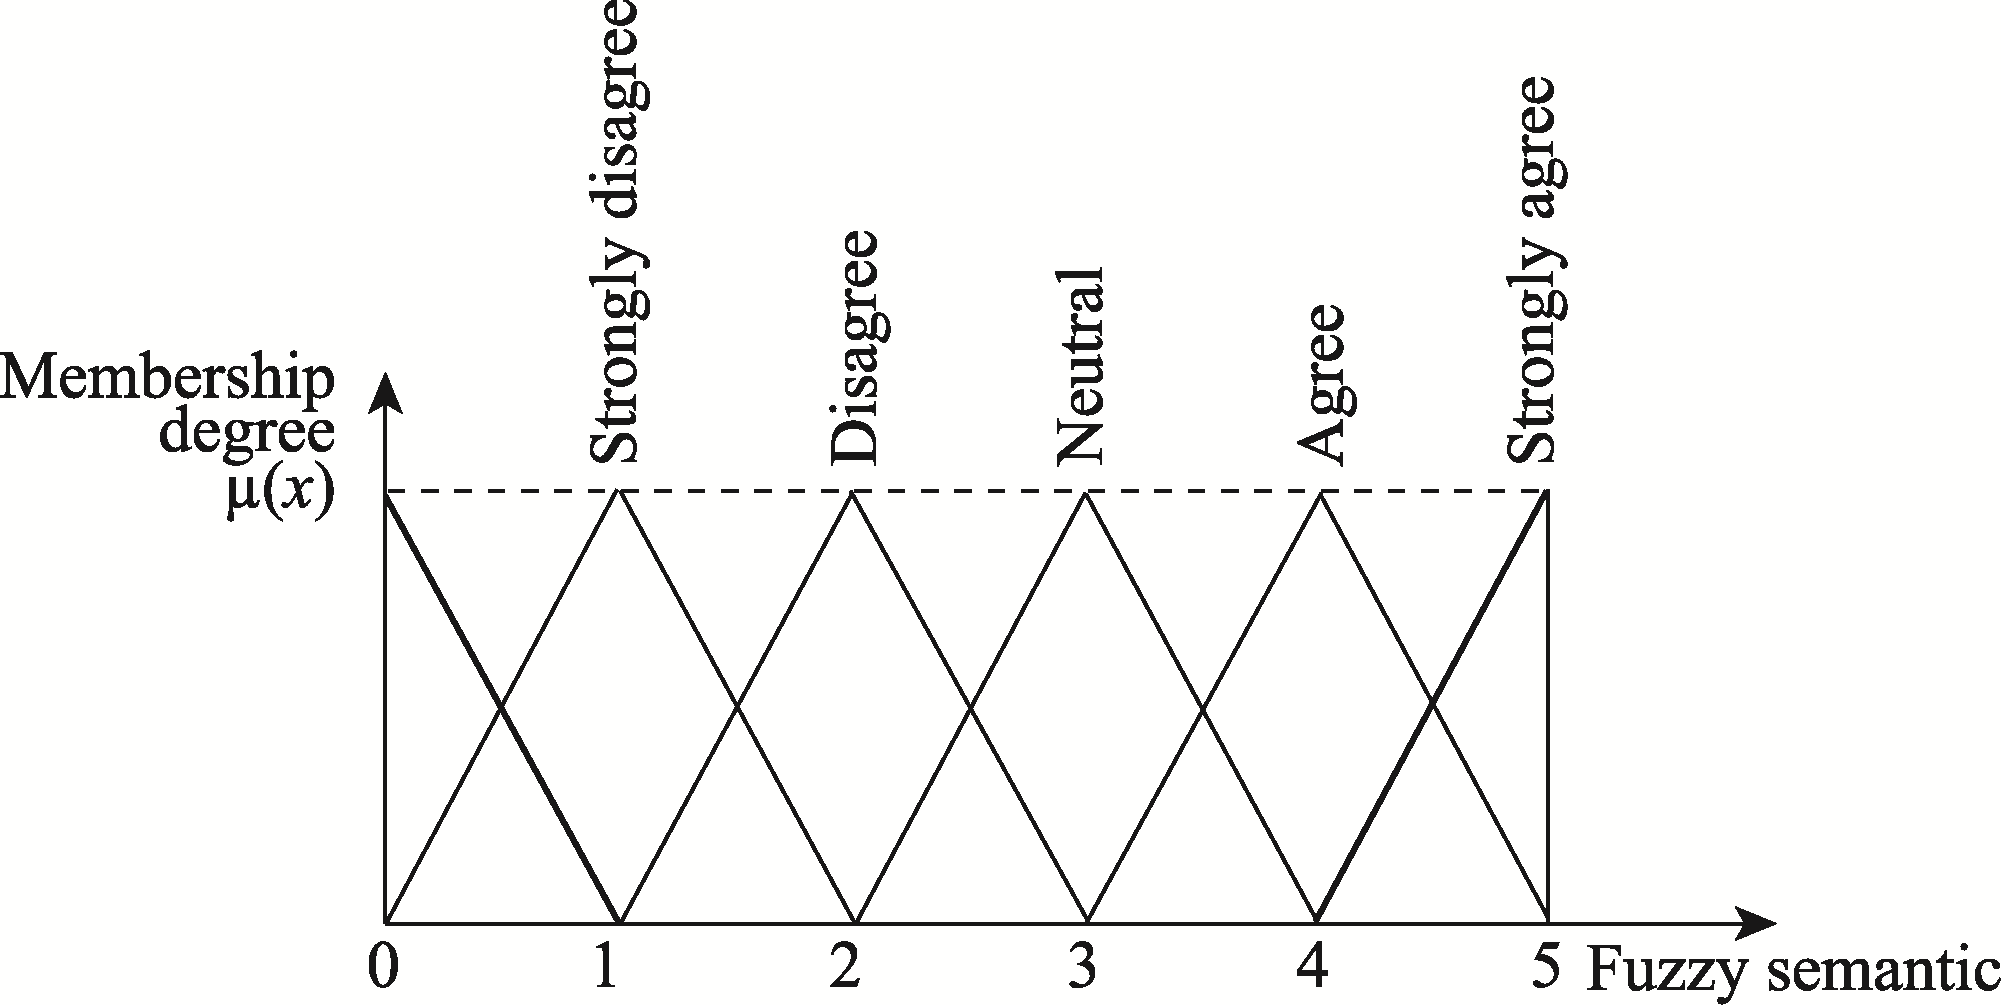
Figure 2
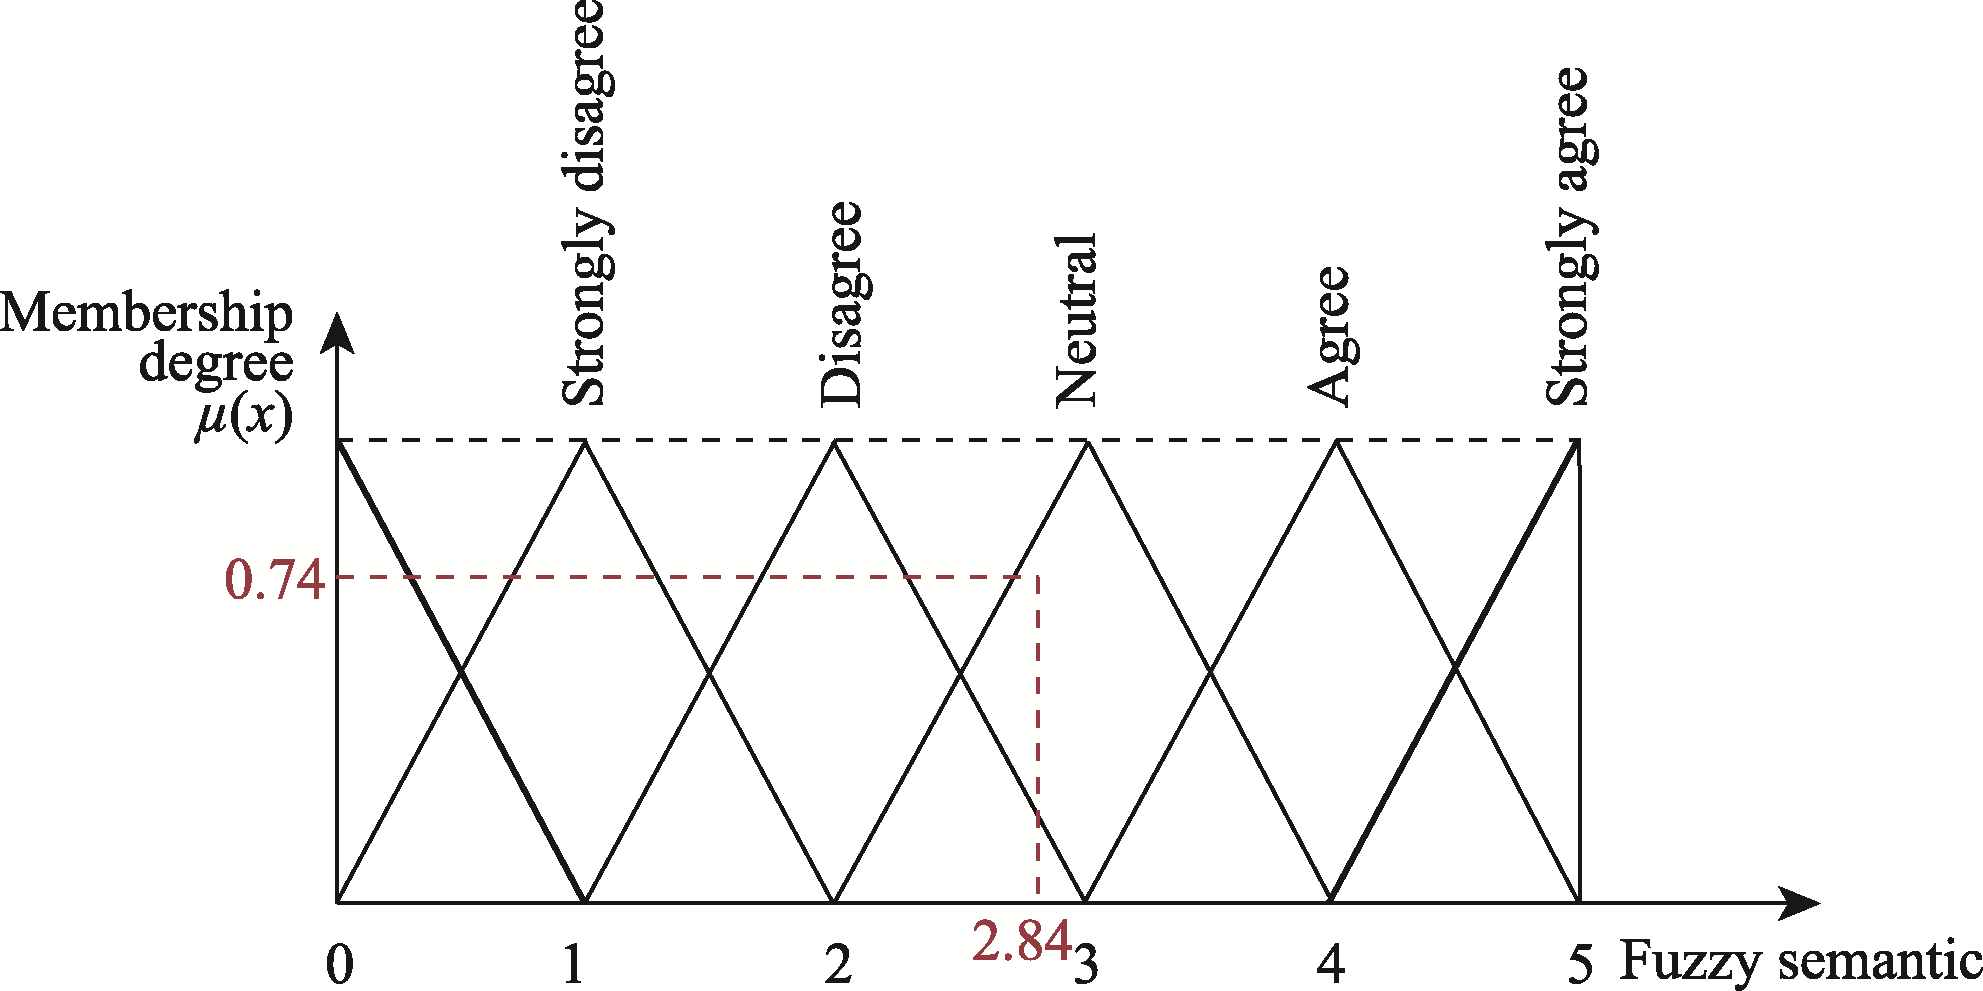
Diagram of the membership degree and fuzzy semantic relationships
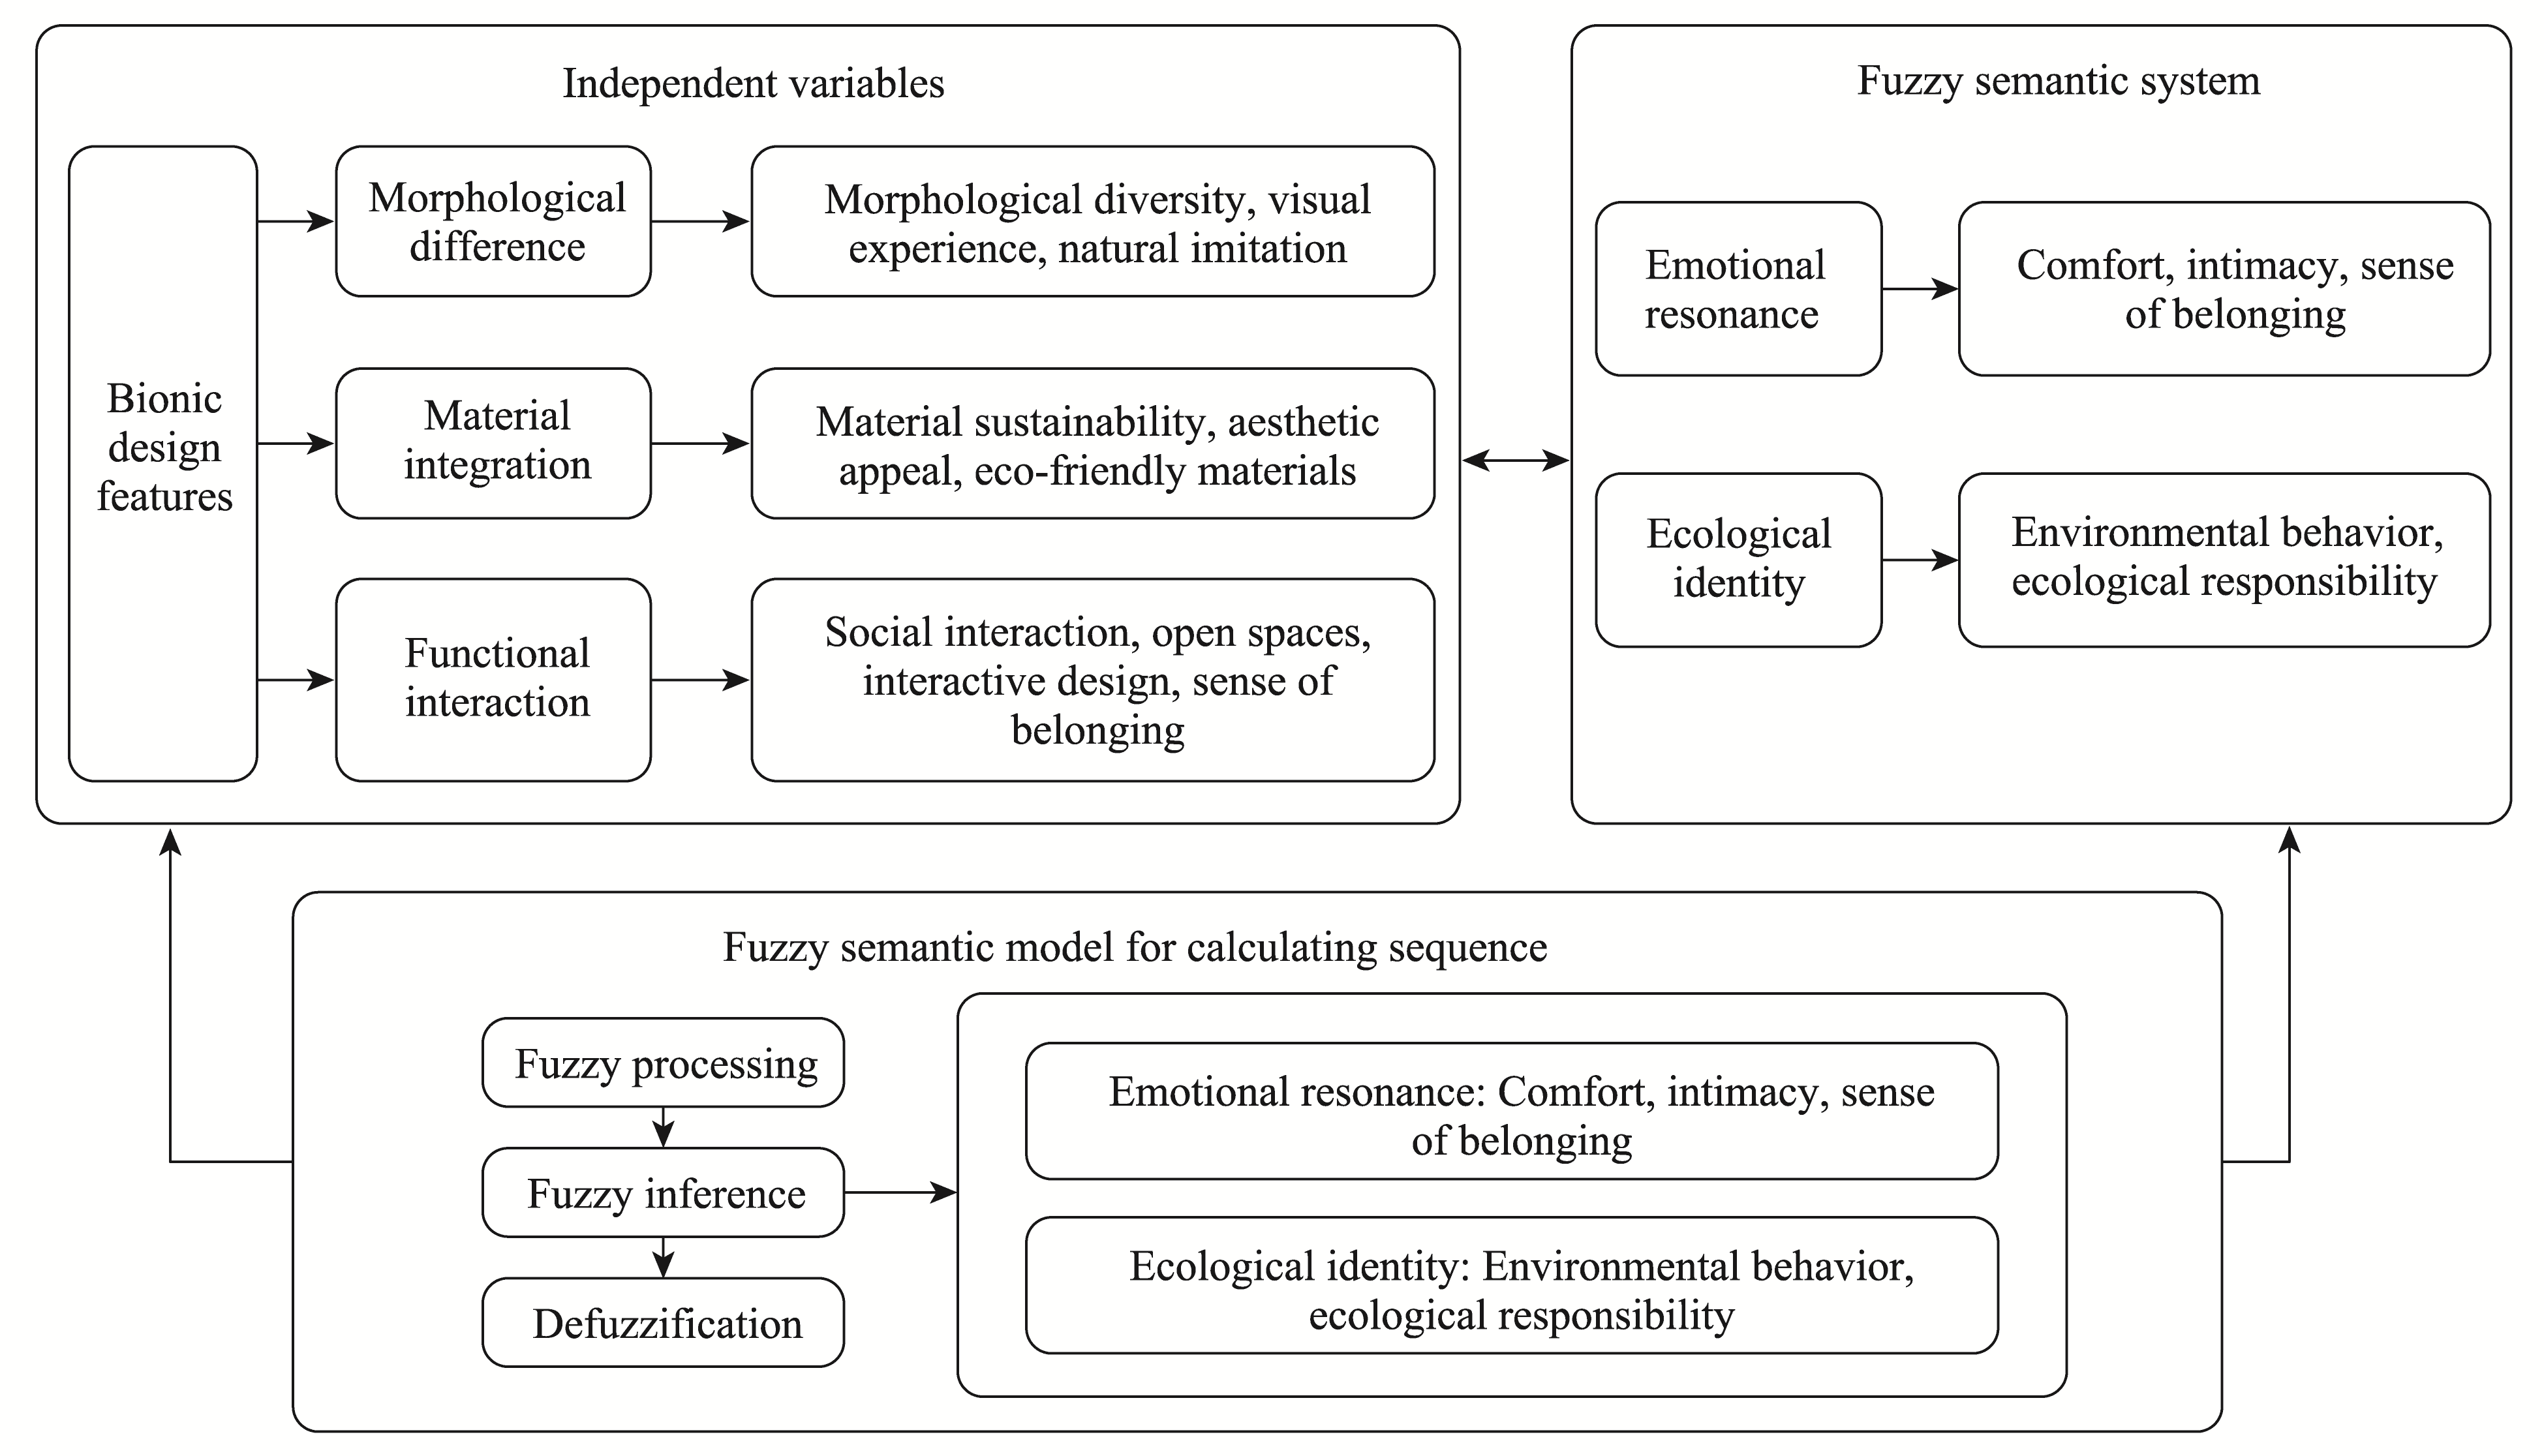
Figure 3
Fuzzy semantic relationship model of the impact of bionic design features on the emotional resonance and ecological identity of residents
Table 1
Questionnaire design for bionic design features
Table 2
Questionnaire design for the emotional resonance and ecological identity of residents
Table 3
Demographic descriptive statistics
Table 4
Reliability analysis of bionic design features and the resident perceptions questionnaire
Table 6
Descriptive statistics of the emotional resonance and ecological identity of residents (
N
=560)
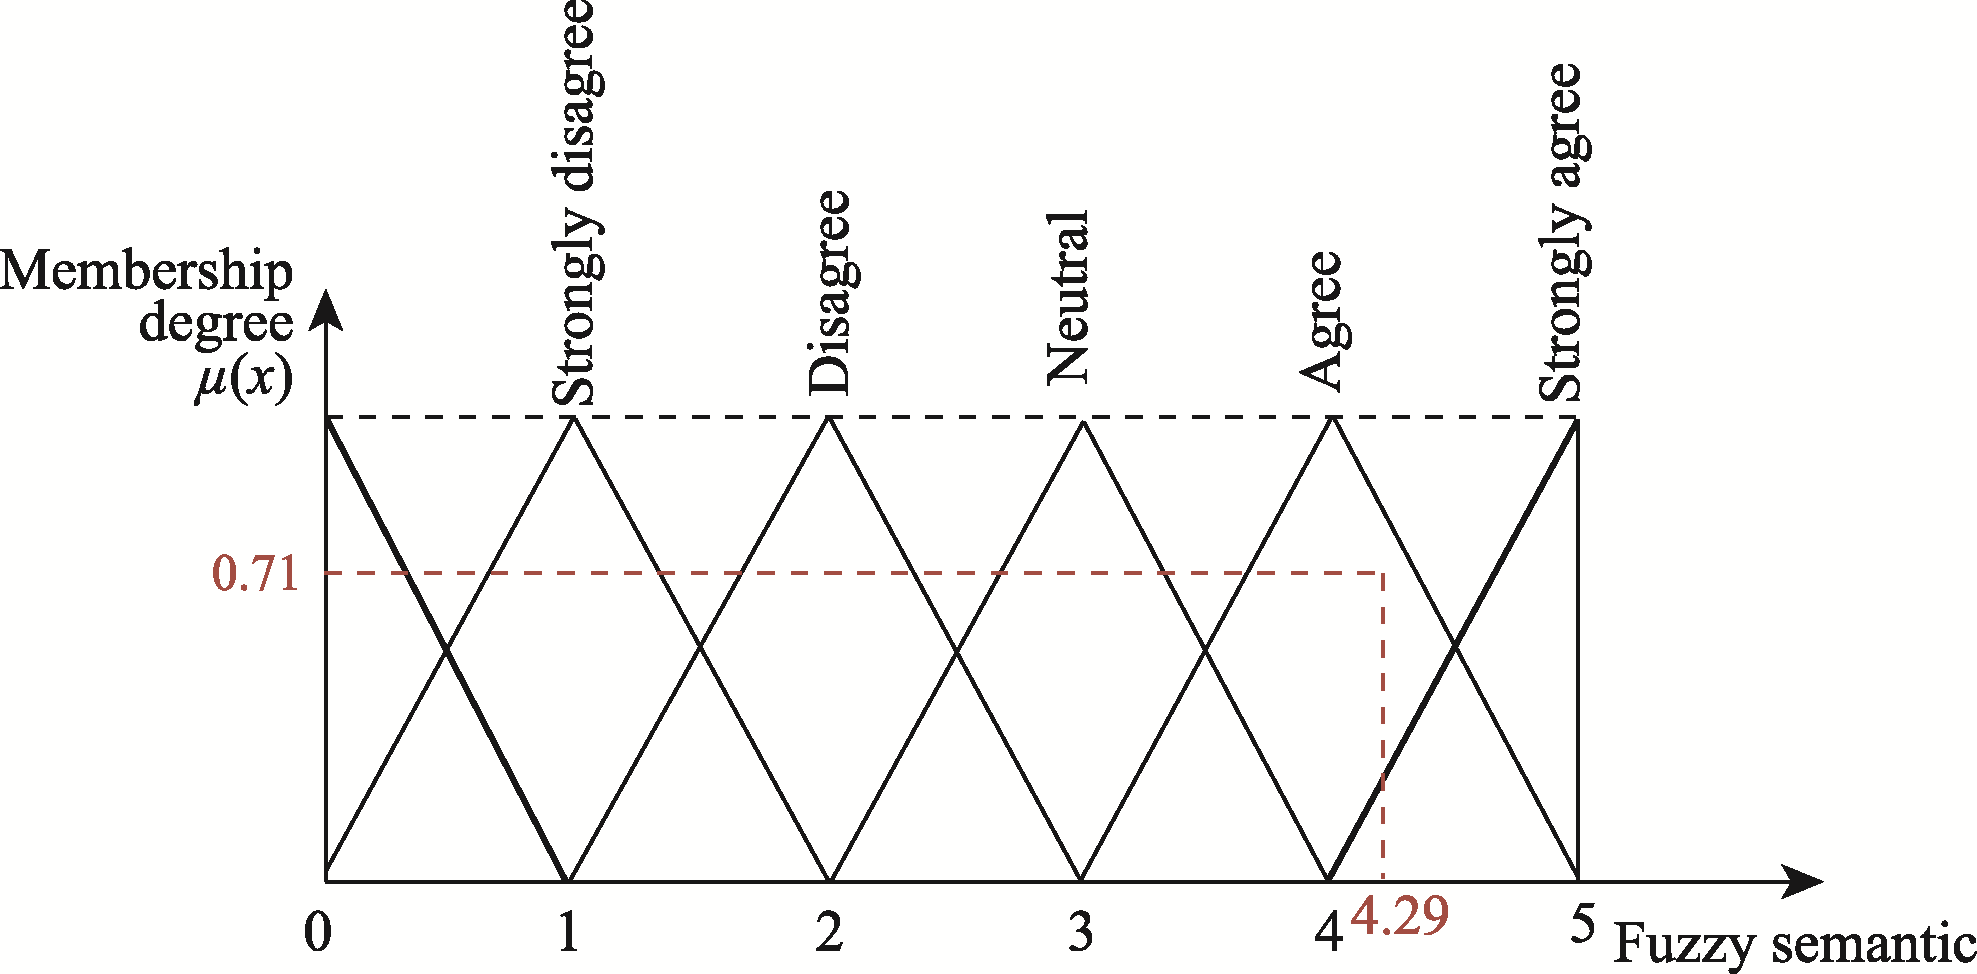
Figure 4
Membership degree and fuzzy semantic relationships of Q3-8
Figure 5
Membership degree and fuzzy semantic relationships of Q3-10
Table 7
The Chi-square test results for the association between design features and the emotional resonance and ecological identification of residents
Table 8
Regression model fit statistics (
N
=560)
Table 9
ANOVA results for the effects of bionic design features on the emotional resonance and ecological identity of residents