Ice-Snow Tourism and Eco-Tourism

Evaluation and Comparative Study of Experience Quality in China’s Ski Tourism Area Based on Online Reviews

  • PENG Yuanxiang , 1 ,
  • YIN Ping , 2, * ,
  • TANG Chengcai 3, 4
Expand
  • 1 International School, Beijing Youth Politics College, Beijing 100102, China
  • 2 School of Economics and Management, Beijing Jiaotong University, Beijing 100044, China
  • 3 School of Tourism Sciences, Beijing International Studies University, Beijing 100024, China
  • 4 Research Center for Beijing Tourism Development, Beijing 100024, China
* YIN Ping, E-mail:

PENG Yuanxiang, E-mail:

Received date: 2025-11-02

  Accepted date: 2026-02-10

  Online published: 2026-04-13

Supported by

The R&D Program of Beijing Municipal Education Commission(SM202411626002)

Abstract

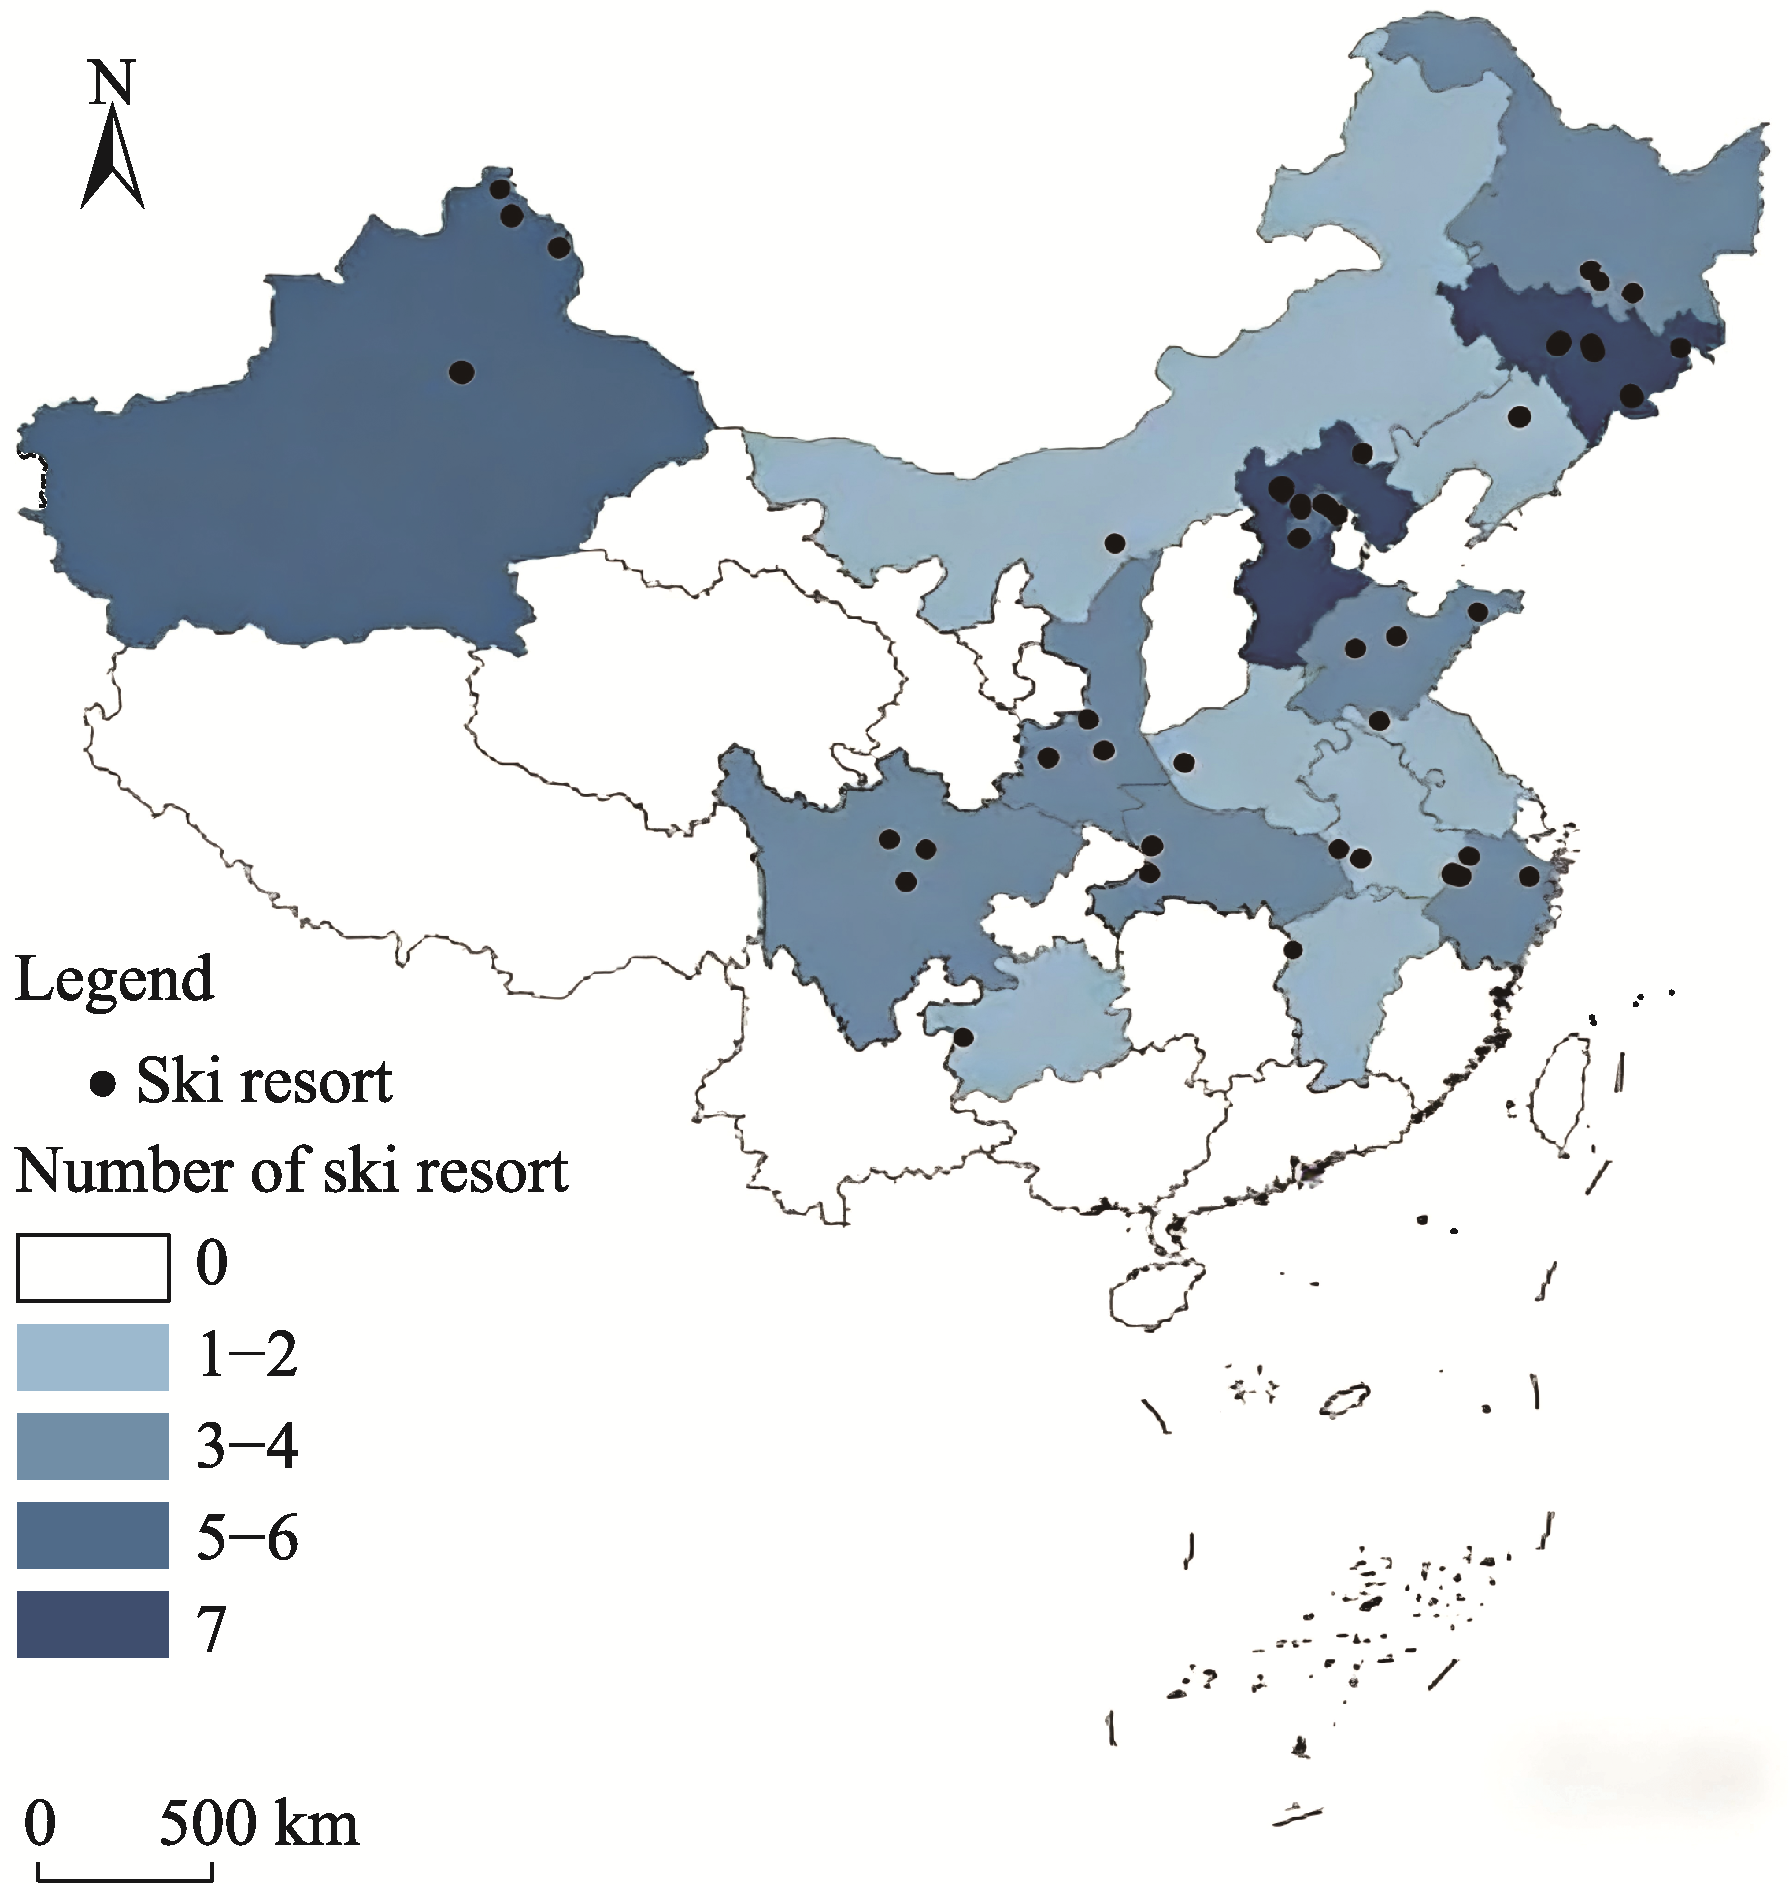
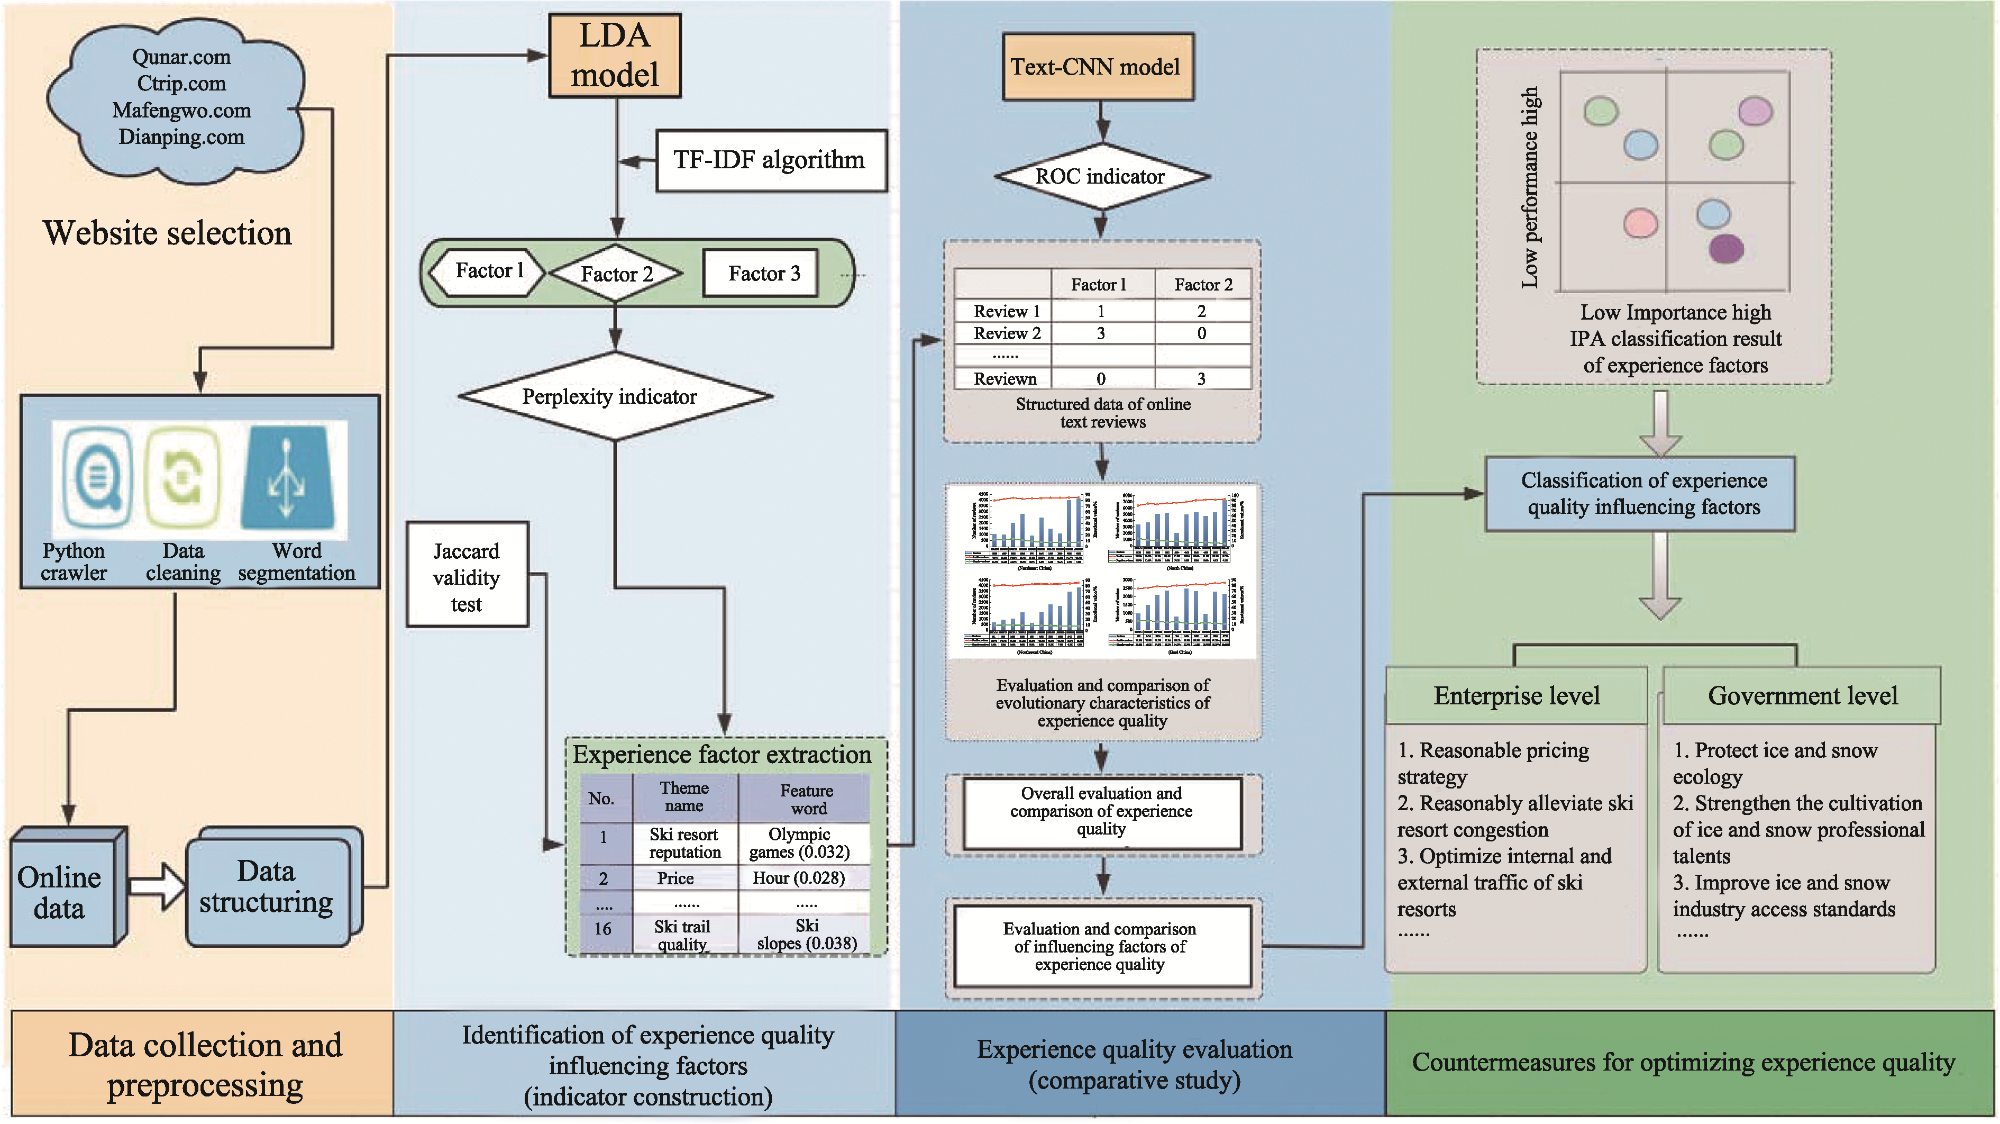
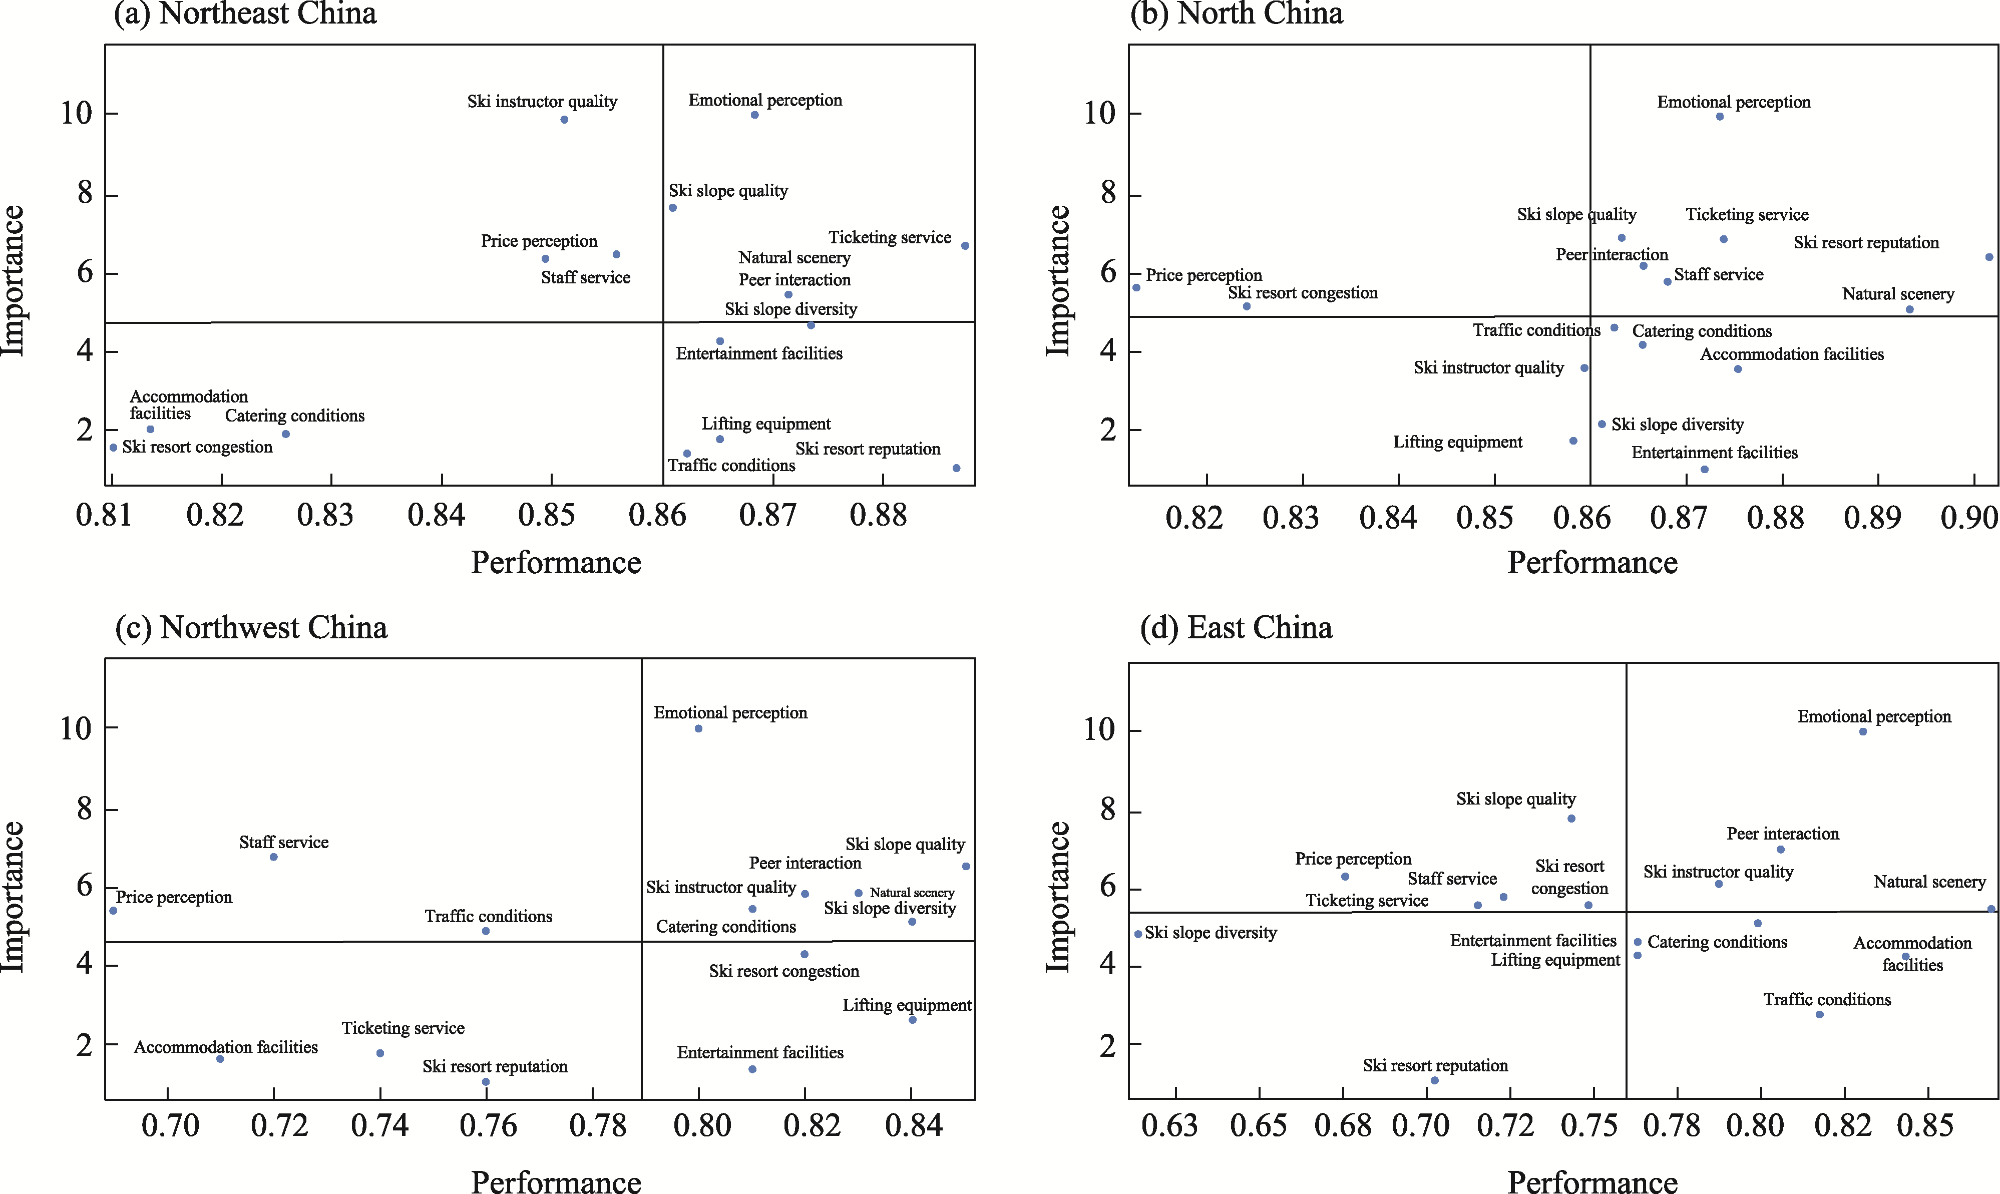
Ski tourism has become a hotspot in the tourism industry due to its high revisit rate. Accurate assessment of its experience quality is crucial for enhancing tourists’ revisit intentions and promoting the high-quality development of the ski industry. Based on the expectation-disconfirmation theory, this study comprehensively applies the LDA model, Text-CNN model, and Importance-Performance Analysis (IPA) to examine 103503 online reviews from 55 ski resorts across nearly 10 ski seasons (2015/2016-2024/2025) in China. It constructs evaluation indicators for ski tourism experience quality and conducts an evaluation and comparison of the experience quality in the four major ski tourism areas: Northeast, North, Northwest, and East of China. The results indicate: (1) 16 influencing factors on ski tourism experience quality were identified, including the newly recognized factors of Ski Instructor Quality and Peer Interaction; (2) In terms of the evolutionary characteristics of experience quality, Established ski regions (Northeast and Northwest) show slow experience improvements, while emerging regions (North and East China) exhibit rapid progress; (3) Overall, North China leads in experience quality, followed by Northeast, Northwest, and East of China; (4) In comparing influencing factors, Natural Scenery, Emotional Perception, and Peer Interaction are common advantages across the four ski tourism areas, while Price Perception is a shared disadvantage. This study systematically evaluated the spatiotemporal heterogeneity of experience quality in major ski tourism areas of China, providing theoretical basis and practical insights for precise improvement of tourism experiences in various regions.

Cite this article

PENG Yuanxiang , YIN Ping , TANG Chengcai . Evaluation and Comparative Study of Experience Quality in China’s Ski Tourism Area Based on Online Reviews[J]. Journal of Resources and Ecology, 2026 , 17(2) : 399 -413 . DOI: 10.5814/j.issn.1674-764x.2026.02.006

1 Introduction

The brilliant success of the 24th Beijing Winter Olympics in 2022, coupled with the significant rise in national consumption levels, has propelled ski tourism to rapidly emerge as a key growth driver in the winter tourism market (Peng et al., 2021; Peng et al., 2022b). The 2025 Government Work Report further emphasizes the development of ice and snow sports and the ice and snow economy, injecting strong momentum into China’s ice and snow industry. However, data from the “2025 Global Ski Industry Development Report” reveal that most skiers in China participate in skiing only 1-2 times per ski season, indicating that the potential of China’s ski tourism market remains largely untapped. Ski tourism experience quality, as a core element for stimulating market vitality and enhancing tourist engagement, directly influences revisit intentions and destination competitiveness, holding decisive significance for the sustainable and high-quality development of ski tourism (Tang et al., 2022; Wang et al., 2022a; Vanat, 2025).
In the big data era, online reviews have become a vital data source for tourism research, enabling the analysis and prediction of destination images (Peng et al., 2022b), tourist experiences (Li et al., 2020), and tourists’ emotional characteristics (Liu et al., 2018). Studies on online reviews continue to grow, increasingly emphasizing the adoption of new analytical technologies (Cheng et al., 2019). Enhancing the practical application of emerging technologies in tourism has emerged as a hot topic (Luo et al., 2021). However, many existing studies still rely on manual data processing methods, whose scalability and reliability are often questioned (Lu and Stepchenkova, 2015; Liang and Li, 2020). Therefore, leveraging effective approaches from the perspective of tourists’ online reviews to continuously evaluate tourist experience quality at destinations and identify development trends represents an urgent issue in tourism management and marketing research (Peng et al., 2022b).
This study utilizes 103503 valid online reviews from 55 ski resorts across nearly 10 ski seasons (2015/2016-2024/2025) in China as the data foundation to construct a text mining-based evaluation framework for ski tourism experience quality. The aim is to reveal the current development status and issues in the four major ski tourism areas (Northeast, North, Northwest, and East of China). Specifically, this paper proposes the following research questions: 1) What is the structure of influencing factors on ski tourism experience quality? 2) What are the spatiotemporal evolutionary characteristics and heterogeneity of experience quality in the four areas? 3) How can optimization strategies be proposed based on regional differences? To address these questions, this study first employs the Latent Dirichlet Allocation (LDA) topic model to identify influencing factors and uses them as evaluation indicators; second, it integrates the Text-CNN sentiment analysis model and Importance- Performance Analysis (IPA) to evaluate and compare the four areas from three dimensions: evolutionary characteristics of experience quality, overall evaluation, and influencing factors evaluation. This study not only enriches the theory of ski tourism experience but also provides decision-making support for destination management and ice-snow industry policies, facilitating high-quality development in the post- Winter Olympics era.

2 Literature review

2.1 Ski tourism experiences

Ski tourism exemplifies an experience-based economic activity, distinguished in the leisure sports domain by its high levels of engagement and repeat participation (Chi et al., 2025). Within the framework of tourism destination development, “experience” transcends mere activity to become a pivotal component of economic value (Peng et al., 2022b). A thorough examination of skiers’ experience characteristics and underlying needs is essential for bolstering a destination’s enduring appeal and competitive edge (Wang et al., 2022b).
International scholarship often positions ski tourism as a central element of winter tourism, offering extensive inquiries from the tourist perspective that span destination image (Andersen et al., 2017), travel motivations (Giachino et al., 2019), and word-of-mouth effects (Matzler et al., 2019). For instance, Kim (2010) investigated how demographic traits, prior destination experiences, and skill proficiency shape ski destination images; Giachino et al. (2019) contrasted millennial university students’ motivations for winter skiing versus summer mountaineering and Matzler et al. (2019) analyzed price impacts on word-of-mouth among first-time and frequent repeat visitors. In contrast, domestic research in China typically subsumes ski tourism under broader ice-and-snow tourism studies, concentrating on tourist satisfaction (Li et al., 2022), experience value (Xu et al., 2022), and behavioral intention formation (Li and Yang, 2025; Zhu et al., 2025). Examples include Chen et al. (2022), who measured satisfaction at ice-and-snow destinations via surveys, and Wang and Sun (2022), who employed structural equation modeling to test relationships between experience value and loyalty among skiers in Zhangjiakou City.
Although international studies are diverse, they seldom delve deeply into the tourist experience lens; domestic efforts, while attentive to experiential aspects, predominantly rely on top-down analyses of predefined variables, lacking bottom-up explorations of factor structures (Xie, 2004). Moreover, constrained by data availability, much existing work depends on questionnaires or interviews (Sun et al., 2018), whereas open user-generated content (UGC) offers more authentic insights (Li et al., 2018), objectively capturing skiers’ perceptions and attitudes. This study draws on online reviews from key ski tourism sites in China to identify influencing factors on experiences, employing them as evaluation metrics for regional quality assessments, thereby advancing ski tourism experience theory.

2.2 Evaluation of tourism experience quality

Tourist experiences involve the adjustment of psychological structures and fulfillment of needs, manifesting as accumulated emotions (Xie, 2004). The level of experience quality directly impacts revisit and recommendation intentions (Tang et al., 2022), making its scientific and accurate evaluation a central focus and challenge in tourism experience research (Sun et al., 2018). International scholars often draw on service quality models from marketing (e.g., IPA, Kano, GM) to analyze tourism experience quality. For instance, Högström et al. (2010) used surveys to compare the contributions of various quality dimensions to tourist experiences and satisfaction at ski destinations. In contrast, domestic researchers in China emphasize constructing measurement indicators for experience quality evaluation, frequently using satisfaction scores from self-developed metrics as proxies (Su, 2004). Liu et al. (2021), for example, applied content analysis and IPA to assess experience quality in historical cultural districts.
The core aim of evaluating tourism experience quality is to identify destination strengths and weaknesses, thereby fostering development. However, studies based on single cases often lack generalizability, limiting their utility for cross-regional guidance (Peng et al., 2022b). This study builds evaluation indicators and employs IPA to examine differences in importance and performance across these indicators. Although IPA has been widely applied in outdoor recreation and tourism literature (Lai and Hitchcock, 2015), many overlook regional heterogeneity within the same tourism type; yet, IPA is deemed particularly effective for providing scientifically robust insights in segmented markets or specific areas (Mimbs et al., 2020). Moreover, while scholars have explored experience quality across diverse tourism types, research on constructing and comparing evaluation systems for ski tourism remains scarce. Unlike other forms, ski tourism features high repeatability, with resort revisit rates serving as a key success metric (Peng et al., 2022b). Nonetheless, such systems and comparative analyses are still underdeveloped. By analyzing online reviews from Chinese skiers, this study identifies influencing factors on experiences, adopts them as evaluation indicators to compare quality across four major ski tourism areas, uncovers spatiotemporal variations, and offers targeted guidance for ski destination development.

2.3 Tourist experiences based on online reviews

In the digital age, online textual data has emerged as a vital resource for investigating tourist experiences (Brown and Reade, 2019). Scholars both domestically and internationally have drawn on these user-generated reviews to conduct extensive studies on visitors’ encounters (Bi et al., 2024), encompassing aspects such as experience quality assessments (Tsai et al., 2020), perceived attributes (Ahani et al., 2019; Shi et al., 2022), influencing factors (Li et al., 2021), and theoretical frameworks (Zeng et al., 2021). These insights have, in turn, informed strategies for optimizing destination management and marketing. That said, while qualitative text analysis approaches like grounded theory and content analysis have been widely adopted in tourism experience research, their reliance on manual coding has sparked considerable debate in academic circles (Lu and Stepchenkova, 2015). Concerns center on issues of scalability and reproducibility, prompting researchers to question the robustness of these methods (Hannigan et al., 2019). As a result, there is an urgent need in tourism management and marketing scholarship to develop comprehensive and efficient approaches for harnessing vast quantities of online review data (Luo et al., 2021).
At present, the literature on tourist experiences is largely dominated by structured quantitative techniques and manual text analysis, yet it falls short in providing efficient methodologies for handling large-scale textual big data (Li et al., 2018). Integrating natural language processing (NLP) and data mining tools offers a promising avenue to address this gap (Wang et al., 2019). For instance, LDA, a machine learning-based Topic Modeling technique, can organize unstructured user-generated content (UGC) into thematic clusters, uncovering latent themes that might elude manual detection. This method also identifies more nuanced experience influencers than traditional empirical approaches reliant on limited samples (Liu et al., 2018), thereby expanding theoretical horizonsand enhancing the trustworthiness of findings derived from online reviews (Kiatkawsin et al., 2020). However, a key drawback of Topic Modeling is its inability to capture sentiment; merely pinpointing destination experience factors falls short of revealing tourists’ preference patterns. The advent of sentiment analysis techniques—drawing on sentiment lexicons and machine learning—enables not only the detection of overall textual polarity but also targeted sentiment classification for specific experience elements, yielding deeper insights for text-based experience quality evaluations.
These studies underscore the value of multifaceted approaches to tourist experience research, which can holistically assess visitor perceptions and foster destination growth. Much of the existing work on traveler behavior relies on small-sample datasets, potentially introducing biases into conclusions. In the big data era, online reviews provide a reliable and abundant foundation for such inquiries. Established methods like LDA and sentiment analysis offer solid technical backing for feature extraction and sentiment categorization. Building on this, the present study employs LDA Topic Modeling alongside sentiment analysis techniques, incorporating a Text-CNN model, to delve into reviews from 55 Chinese ski tourism destinations. By treating the experience factors identified via LDA as evaluation metrics, we further apply sentiment analysis to classify both reviews and experiential elements. We then integrate these with an IPA framework, using sentiment outcomes and LDA-derived frequency distributions as proxies for performance and importance, respectively. This allows for a comprehensive evaluation and comparison of ski tourism experience quality across areas. Such a multidimensional analytical lens not only illuminates the varying developmental trajectories of experience factors in different areas but also equips stakeholders with actionable recommendations to elevate the overall quality of ski tourism experiences in China.

3 Methodology

3.1 Research area

According to the “2024-2025 China Ski Industry White Paper” (Wu, 2025), as of August 2025, there are 748 operational ski resorts nationwide, including 181 resorts equipped with aerial cableways. These resorts are larger in scale, attract numerous visitors, and have abundant reviews. To ensure sample representativeness, this study adopts dual screening criteria: 1) Nnumber of reviews ≥300; 2) Equipped with aerial cableways. Ultimately, 55 ski resorts from areas such as Xinjiang, Beijing, Heilongjiang, Jilin, Hebei, Hubei, and Anhui were selected as research objects, with the regional distribution as follows (Figure 1): 13 in the Northeast China, 15 in North China, 9 in the Northwest China, 10 in East China, 4 in Central China, and 5 in the Southwest.
Figure 1 Distribution of sampled ski resorts
From the perspective of China’s seven major natural geographical divisions, 85% of the ski resorts nationwide are concentrated in the four areas of Northeast, North, Northwest, and East of China (Wang et al., 2022b), with relatively abundant review data, while the proportions and review volumes in the remaining three areas are lower. These areas exhibit significant differences in culture, geography, resources, and industrial models, with distinct market development patterns and tourist experience characteristics (Li, 2017). Therefore, this study focuses on these four major ski tourism areas, comprehensively evaluates the heterogeneity of their ski experience quality, and proposes targeted optimization suggestions to support regional sustainable development.

3.2 Data collection and preprocessing

This study comprehensively considered factors such as the reputation, authority, user base, richness of review quantities, and reading access volumes of online tourism platforms, ultimately selecting four different data acquisition platforms: Mafengwo, Ctrip, Qunar, and Dianping. Python web crawlers were used to collect 124207 online reviews and travel notes from the selected ski resorts on these platforms, totaling 7.231 million characters. The collection period for the selected online reviews ranges from October 2015 to April 2025. Subsequently, data preprocessing was performed, including the removal of duplicate and promotional reviews, as well as tokenization and stop word removal, resulting in 103503 valid reviews and travel notes, totaling 6.178 million characters, which serve as the research data for this study.

3.3 Research methods

Based on the expectation-disconfirmation theory, tourists' emotional states represent expressions of satisfaction levels; after experiencing the actual product, tourists use their expectations of the tourism product as a benchmark to form their final satisfaction. Referring to existing literature (Knutson et al., 2004). This study regards sentiment scores as measures of experience quality. The comparative analysis is conducted from three dimensions: evaluation of evolutionary trend characteristics of experience quality, overall evaluation of experience quality, and evaluation of influencing factors on experience quality. The overall research framework of this study is shown in Figure 2. This framework follows the logical sequence of “data-driven→factor identification→quality assessment→regional comparison”. Specifically: First, key factors influencing the ski experience are extracted in an unsupervised manner from the massive volume of reviews using the LDA topic model and are established as evaluation indicators. Second, fine-grained sentiment classification of the text is performed using the Text-CNN model to quantify tourists’ satisfaction with both individual factors and the overall experience, serving as the measure of “Performance.” Finally, the term frequency distribution of each factor obtained from LDA (serving as a proxy for “Importance”) is integrated with the sentiment scores for each factor derived from Text-CNN. This integrated data is then input into the IPA model for matrix analysis, enabling the systematic diagnosis and comparison of the strengths, weaknesses, and optimization priorities across the four major regions in various experiential dimensions. The framework thus achieves a chain analysis from unstructured data to actionable managerial insights.
Figure 2 A evaluation and optimization framework of ski tourism experience quality based on online reviews

3.3.1 LDA topic modeling

LDA serves as a mainstream Topic Modeling technique, suitable for topic mining in tourism big data (Schwarz, 2018;Chuang et al., 2012; Sievert and Shirley, 2014). Its generative model is essentially a three-layer Bayesian structure: document- topic-word distribution (Zhang and Eick, 2019). This study uses Python’s Gensim library to train an unsupervised LDA model. Perplexity is selected to determine the optimal number of topics in LDA modeling, as it quantifies how well the model predicts unseen text—lower perplexity indicates better generalization and more coherent topic structure. The number of topics is optimized through perplexity (Zhao et al., 2015), as shown in Equation (1):
$\operatorname{perplexity}(D)=\exp \left(-\frac{\sum_{d=1}^{M} \ln P\left(W_{d}\right)}{\sum_{d=1}^{M} N_{d}}\right)$
Where D denotes the set of all words in the documents; M denotes the number of documents; Wd denotes the words in document d; Nd denotes the number of words in each document d; and P(Wd) denotes the probability of word occurrence in the document. Perplexity generally decreases as the number of latent topics increases; a smaller perplexity value indicates stronger generative capability of the topic model (Zhao et al., 2015).
The selection of perplexity should prioritize the model’s generalization ability while controlling its complexity and parameter quantity. It is generally considered that the LDA topic model is optimal when the average similarity of the topic structures is minimized, aligning with Occam’s razor principle. Therefore, this study selects the number of topics corresponding to a relatively small perplexity value as the optimal parameter for training the LDA topic model (Zeng and Wang, 2019).
Perplexity values for different numbers of topics were calculated according to Equation (1), with the results shown in Figure 3. Additionally, this study utilized the PyLDAvis package to visualize the distances between topics, revealing that topic differentiation is evident when the number of topics is 16. Therefore, the optimal number of topics for the LDA model in this study is determined to be 16, with examples of the topic distance diagram and feature words illustrated in Figure 4. Furthermore, this study also calculated the Coherence Score to cross-verify the quality of the topic model. The final number of topics was determined to be 16, as it achieved lower confusion while maintaining high topic coherence, indicating that the model possesses good interpretability and stability.
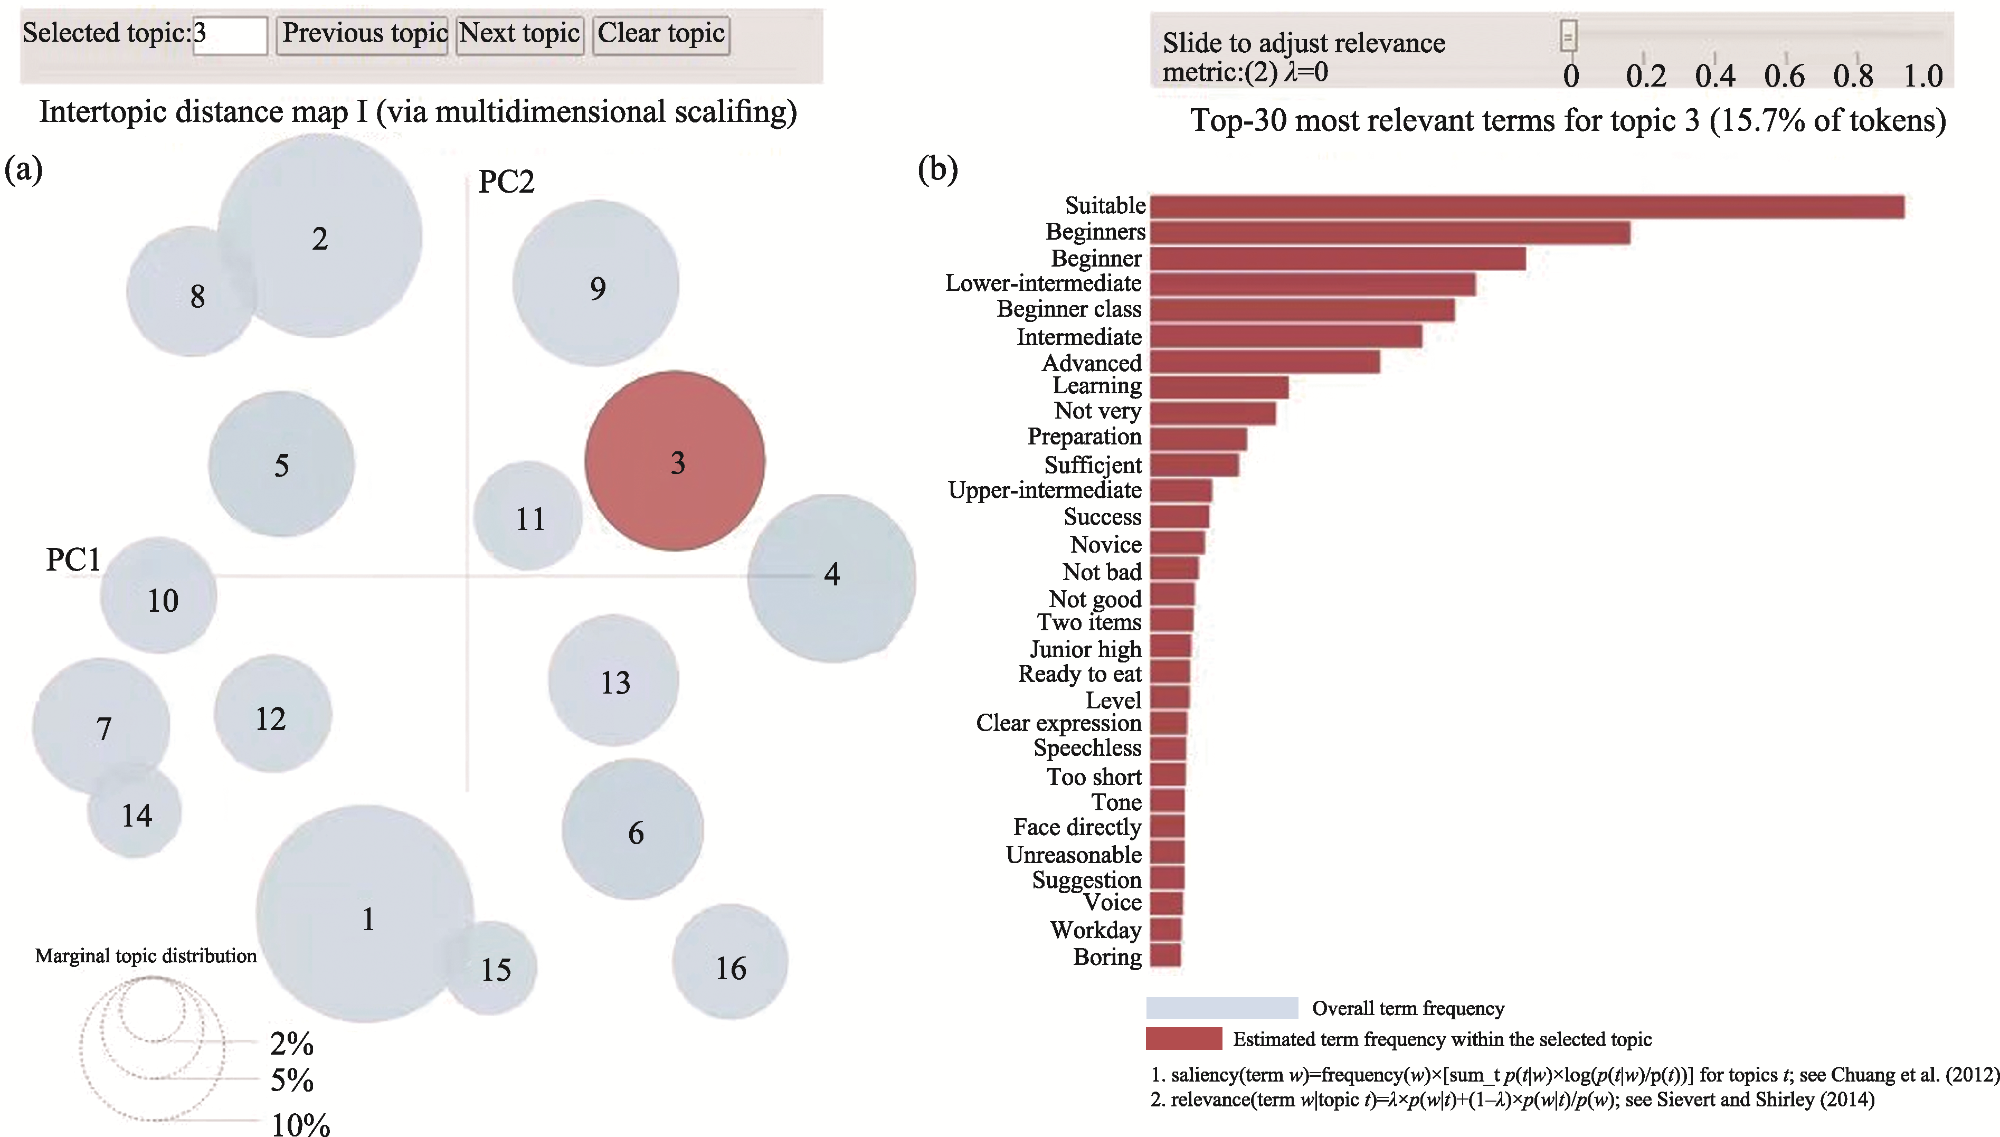
Figure 3 Topic distance diagrams and examples of feature words

Note: (a) Intertopic distance map (circle = topic, size = proportion, distance = similarity). (b) Top relevant terms for Topic 3 (red = topic-specific frequency, blue = global frequency). Saliency = global importance; Relevance = topic specificity (λ-adjusted).

Figure 4 The changing trend of topic confusion
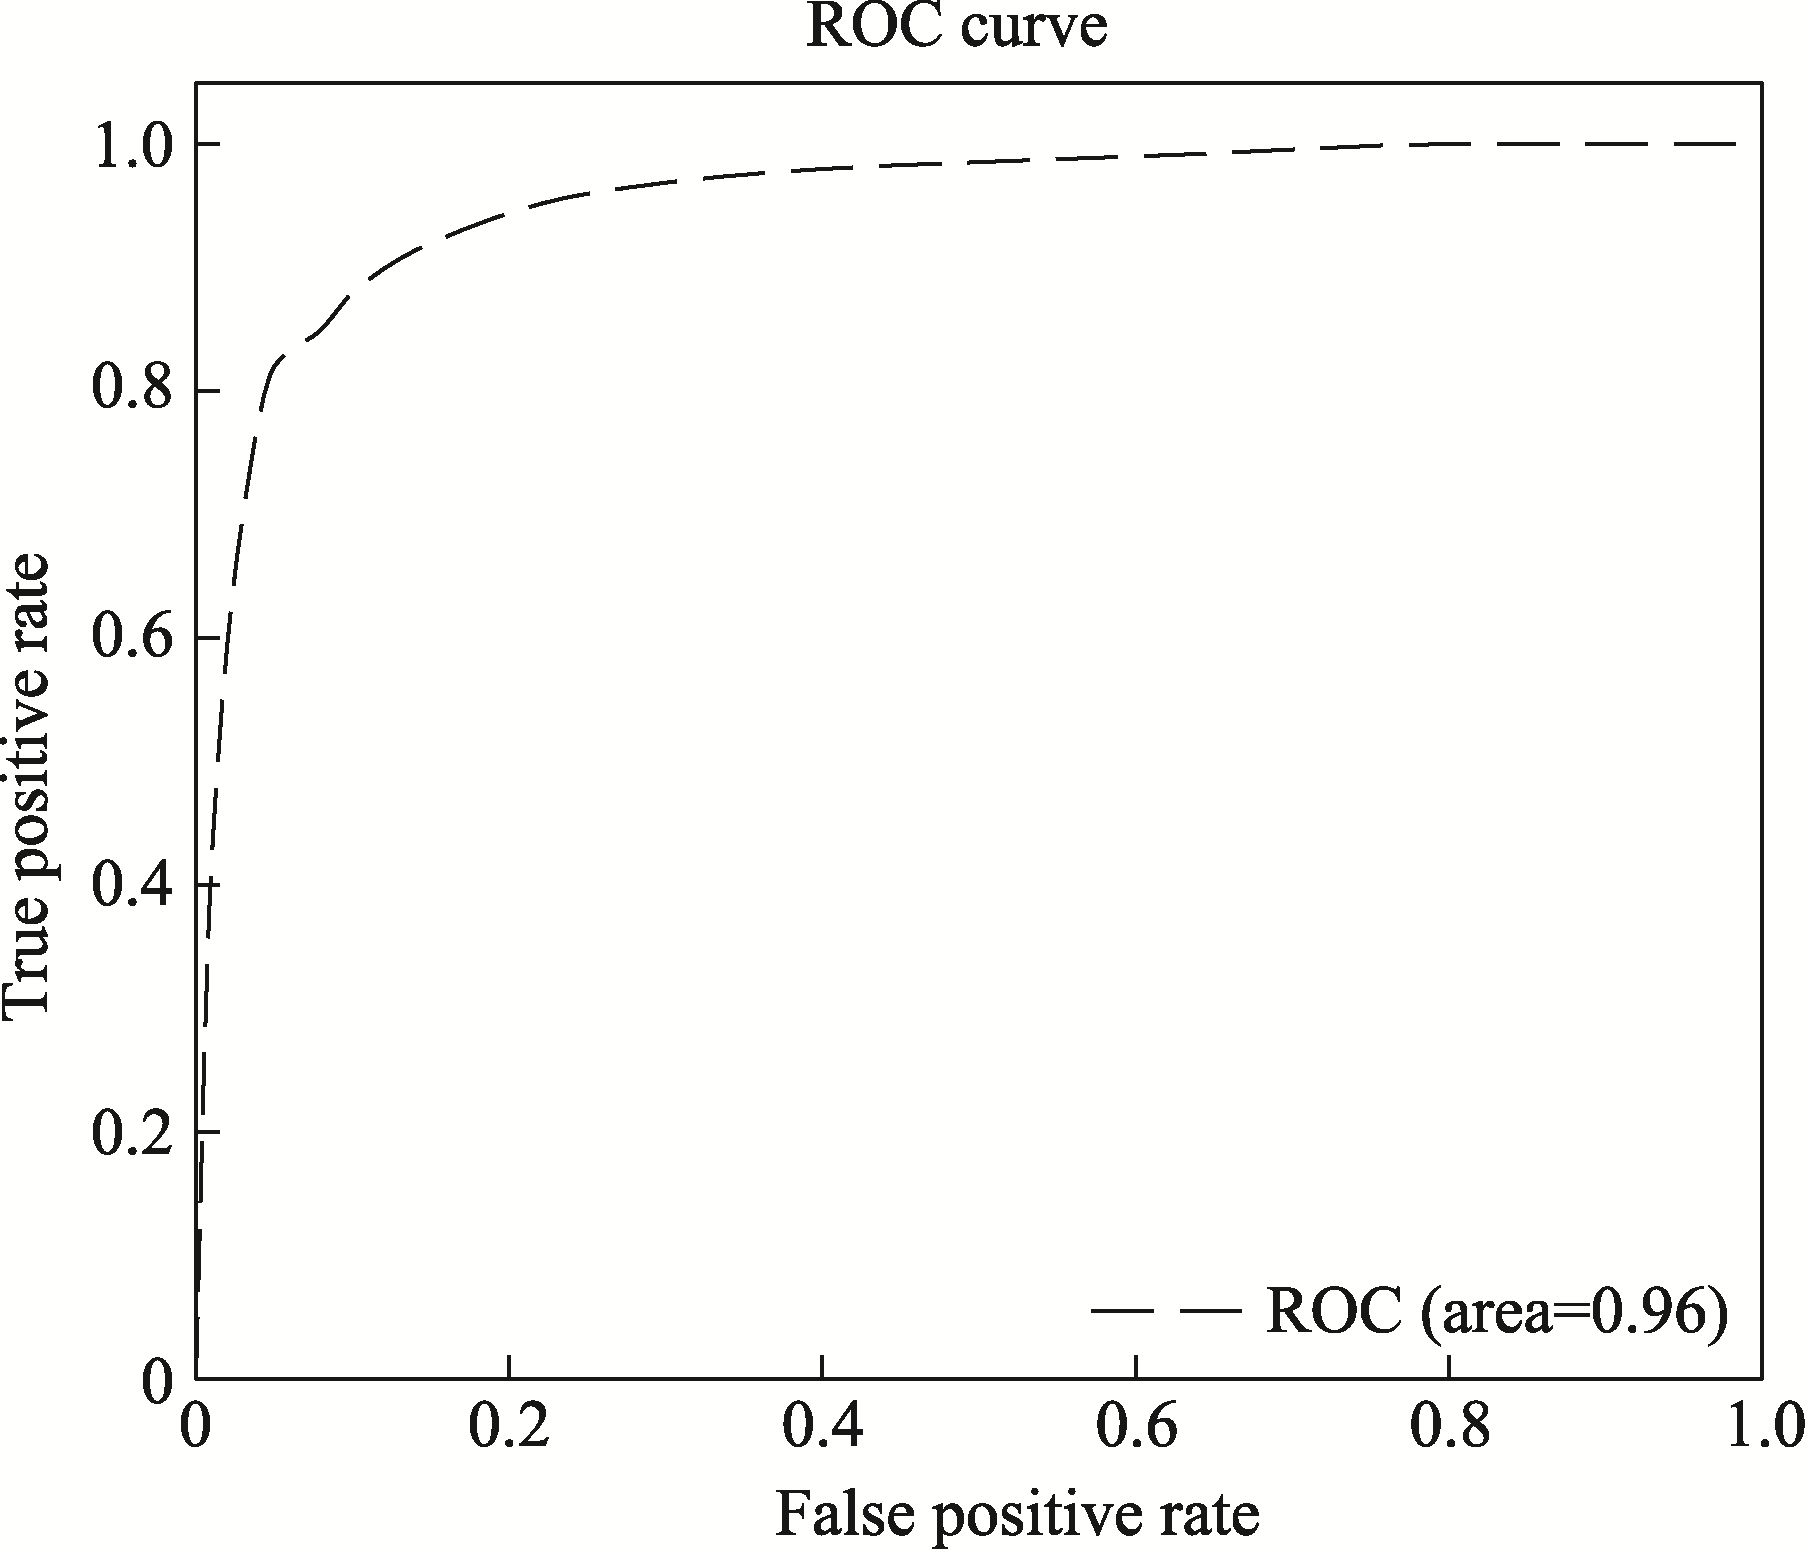
3.3.2 Text-CNN model

This study employs Python to develop an emotion classification model, with the following workflow:
(1) Dataset preparation
Among the 103503 reviews obtained, 52927 included star ratings ranging from 0 to 5. To minimize manual labeling costs, this study employed rule-based automatic sentiment polarity annotation for reviews with ratings. Specifically, reviews rated between 0.5 and 2.0 were classified as negative and labeled as -1; those between 2.5 and 3.5 were classified as neutral and labeled as 0; and those between 4.0 and 5.0 were classified as positive and labeled as 1. This classification scheme was adopted to ensure a clearer distinction between sentiment polarities for model training. The threshold of 2.0 stars (rather than the more common 2.5) was set after observing that reviews with 2.0-2.5 stars in our dataset often contained mixed or mild negative sentiments. To enhance the model’s ability to learn definitive negative patterns, we assigned the more unequivocally negative label (-1) to reviews rated 2.0 stars and below. Following automatic annotation, there were 39234 positive reviews, 8325 negative reviews, and 5368 neutral reviews. The labeled data were then randomly shuffled and split in a 9:1 ratio into training and validation sets for model training and tuning, with the remaining 27790 reviews serving as the test set.
(2) Pre-trained word vectors and feature extraction
This study employs the open-source Word2Vec tool for vectorizing textual vocabulary (Zeng and Wang, 2019). Given the prevalence of evaluative terms in Chinese reviews, fine-tuned pre-trained Zhihu Chinese static word vectors sgns.zhihu.word were utilized, with the embedding layer dimension in the subsequent model set to 128.
(3) Text-CNN model training
This study employs the Text-CNN model, in which the input review text is first subjected to word embedding to map textual information into a numerical semantic space, yielding the representation of the input review text. Subsequently, in the convolutional layer, filters with varying kernel sizes are applied for one-dimensional convolution operations to capture semantic associations between adjacent words. Then, in the pooling layer, global max pooling is utilized to extract the primary features from each filter’s output, thereby filtering out the influence of invalid data. Finally, through the fully connected layer, the learned feature representations are mapped to the sample label space, with classification prediction probabilities output after softmax normalization.
(4) Model testing
To validate the model’s actual classification performance, this study employs the test set data for evaluation. For binary classification problems, the ROC (receiver operating characteristic) curve, as shown in Figure 5, illustrates the relationship between the true positive rate (TPR) and the false positive rate (FPR) obtained by the classification model across different thresholds. The vertical axis represents TPR, while the horizontal axis represents FPR.
The True Positive Rate (TPR) is calculated as:
$TPR=\frac{TP}{TP+FN}$
Equation (2) represents the proportion of correctly predicted positive samples out of all actual positive samples. Here, TP denotes the number of samples that are actually positive and correctly predicted as such; and FN denotes the number of samples that are actually positive but incorrectly predicted as negative.
The False Positive Rate (FPR) is calculated as:
$FPR=\frac{FP}{TN+FP}$
Equation (3) represents the proportion of incorrectly predicted positive samples out of all actual negative samples. Here, FP denotes the number of samples that are actually negative but incorrectly predicted as positive, and TN denotes the number of samples that are actually negative and correctly predicted as such. Finally, the overall data are subjected to statistical analysis segmented by area.

3.3.3 IPA method

Existing research generally posits that tourist experience quality integrates multiple experience factors (Fang et al., 2008). Consequently, one key task for destination managers is to understand the role and importance of these destination experience influencing factors in tourists’ experiences, thereby enabling more targeted improvements and monitoring of tourism destination experience quality. This study employs the experience influencing factors identified through LDA Topic Modeling as evaluation indicators to assess and compare experience quality across different ski tourism areas, while introducing the IPA model to illustrate the strengths and weaknesses of each area. The IPA model, proposed by Martilla and James (1977), allows researchers to categorize measured attributes/factors into four quadrants based on the mean values of importance and performance: the keep-up-the-good-work quadrant, concentrate-here quadrant, low-priority quadrant, and possible-overkill quadrant. Managers can thus observe the importance and performance of tourist experience influencing factors and promptly optimize management measures. The specific methods are as follows:
In this study, importance refers to the quantitative distribution of experience influencing factors. This study utilizes the trained LDA model to refine and name each topic's feature words, designating them as evaluation indicators for experience quality (i.e., experience influencing factors); subsequently, the distribution of each experience factor across different ski tourism areas is statistically analyzed, with the distribution frequency of each experience influencing factor serving as the importance metric. Performance denotes the satisfaction level of experience influencing factors, extracted through the following steps:
(1) A single review may encompass multiple experience factors, and several sentences within it could pertain to the same factor. Therefore, this study first segments each review into sentences based on punctuation marks. Subsequently, utilizing the LDA classification results, sentences are filtered according to the topic words associated with each experience factor category, and those containing topic words from the same category are merged. For instance, in Table 1, the sentences “Otherwise, without hiring an instructor, they basically teach you nothing” and “The instructor was nice” share identical topic words and are thus merged into one sentence in this study. Similarly, “The kids had a great time” and “Will come again with family next time” contain the topic words “kids” and “family” under the Peer Interaction factor, respectively; the merged sentence “The kids had a great time, will come again with family next time” represents a sample with a single experience factor. Moreover, a sentence may span multiple experience factor categories; for example, “Will come again with family next time” involves both Peer Interaction and Emotional Perception due to the word “next time.” Thus, it is treated separately as a sample for the Emotional Perception factor. In Table 1, the bolded portions highlight the feature words included in each experience influencing factor, with “//” denoting sentence divisions.
Table 1 Example of experience influencing factor extraction
Review text example Number of sentences Number of experience factors
Arrived early//but waited a long time for tickets//the ski slopes are decent//the cable car is poor//but the fees are a bit outrageous//otherwise without hiring an instructor, they basically teach you nothing//ended up hiring one anyway//the instructor was nice//the kids had a great time//the scenery is beautiful//fewer people in the intermediate-advanced areas//shoes were basically soaked after skiing//will come again with family next time 13 9

Note: Source: Ctrip.com.

(2) Sentences containing the same factors from all reviews were merged into one category, resulting in 16 categories in total. Sentiment labeling was performed for each category of experience factors, with positive sentiment denoted as “+1”, negative sentiment as “-1”, and neutral sentiment as “0”. On average, 1000 sentences were labeled per category of experience influencing factors, with each category divided in a 4:1 ratio into training and validation sets, and the remaining sentences used as the test set.
(3) The training set described in step (2) was utilized to train the Text-CNN model outlined in Section 3.3.2. The sentiment classification model trained in this manner can predict sentiments for samples containing a single experience factor. The final trained Text-CNN model achieved an ROC test value exceeding 0.92, indicating high accuracy and meeting the study’s expectations.
(4) The proportion of positive sentiments for each experience influencing factor in each ski tourism area was calculated and used as the performance metric for each factor.
(5) In accordance with the theoretical principles of the IPA model, the mean satisfaction value of the overall indicators was represented as the intersection point on the X-axis, and the mean importance value as the intersection point on the Y-axis. The measured indicators were then distributed into the four quadrants based on the evaluation results of tourists’ experience importance and performance, with the implications of the elements in each quadrant analyzed and interpreted.

4 Result

4.1 Extraction of influencing factors on ski tourism experience quality

LDA topic classification identified 16 topics, as shown in Table 2. To accurately discern the intrinsic meaning of each topic, this study named them from the perspective of tourist experiences, drawing on feature word outputs and prior research findings. The second column presents the topic condensation results, which also constitute the influencing factors on tourist experience quality; the naming of these factors derives from a comprehensive review of relevant literature. The third column displays high-frequency elements associated with each factor, with numbers in parentheses indicating weights that reflect the importance of each feature word. The fourth column assesses whether the factor has appeared in ski tourism destination research, while the fifth column provides the literature sources for factor naming.
Table 2 Extraction of experience influencing factors
No. Topic name Feature words Appeared in
ski tourism destination?
Source
1 Ski resort reputation Winter Olympics (0.032), Zhangjiakou (0.021), professional (0.020), Beijing (0.014), international (0.013), 2022 (0.012), national-level (0.012), competition (0.012), famous (0.010), established (0.010) Yes Peng et al., 2022b
2 Price
perception
Expensive (0.056), price (0.032), hour (0.028), value for money (0.026), relative (0.021), reasonable (0.016), charge (0.014), general (0.013), affordable (0.017), cheap (0.009) Yes Peng et al., 2022b
3 Ski slope quality Ski slope (0.038), snow quality (0.031), snow gear (0.021), safety (0.021), facilities (0.012), protection (0.011), snowmaking (0.015), snow grooming (0.013), powder snow (0.011), artificial (0.009) Yes Peng et al., 2022b
4 Accommodation facilities Hotel (0.046), dining (0.035), cuisine (0.028), experience (0.023), accommodation (0.016), environment (0.014), room (0.013), folk customs (0.012), clean (0.011), vacation (0.010) Yes Peng et al., 2022b
5 Traffic
conditions
Location (0.021), time (0.021), high-speed rail (0.019), parking lot (0.017), Beijing (0.016), highway (0.013), shuttle bus (0.013), hour (0.012), weekend (0.009), kilometer (0.008) Yes Miragaia et al., 2015
6 Entertainment facilities Activity (0.032), program (0.023), night skiing (0.021), hot spring (0.018), entertainment (0.017), amusement park (0.015), park (0.014), entertainment (0.009), project (0.009), snow tubing (0.012) Yes Hall et al., 2016
7 Natural
Scenery
Scenery (0.026), mountain top (0.015), snow mountain (0.013), summit (0.013), temperature (0.010), cold (0.009), landscape (0.007), sea of clouds (0.006), sun (0.004), snowing (0.004) Yes Hall et al., 2016
8 Catering
conditions
Cuisine (0.028), food (0.021), fast food (0.020), value for money (0.018), fresh (0.014), delicious (0.012), tasty (0.009), hot drink (0.008), unpalatable (0.006), expensive (0.005) Yes Hall et al., 2016
9 Lifting
equipment
Cable car (0.032), magic carpet (0.023), speed (0.021), queuing (0.018), seat cushion (0.017), heating (0.014), timely (0.013), comfortable (0.010), waiting (0.010), equipment (0.007) Yes Hall et al., 2016
10 Ski slope diversity Ski slope (0.037), suitable (0.029), ski resort (0.025), beginner (0.018), beginner level (0.014), intermediate trail (0.013), beginner trail (0.012), intermediate (0.010), intermediate-advanced (0.009), advanced trail (0.009) Yes Hall et al., 2016
11 Ski resort congestion Crowded (0.035), waiting (0.022), congestion (0.021), few people (0.017), weekend (0.013), queuing (0.012), speed (0.007), afraid (0.014), skiing (0.010), control (0.008) Yes Hall et al., 2016
12 Staff service Staff (0.026), service (0.015), attitude (0.013), management (0.013), personnel (0.010), convenient (0.009), management (0.007), reception (0.006), waiting (0.004), time (0.004) Yes Matzler et al., 2007
13 Emotional perception Unforgettable (0.034), like (0.029), interesting (0.023), exciting (0.020), immersed (0.021), worthwhile (0.018), happy (0.017), next time (0.014), feeling (0.013), recommend (0.010) Yes Andersen et al., 2017
14 Ticketing service Ticket collection (0.031), ticket purchase (0.011), ski ticket (0.023), website (0.022), message (0.016), ticket inspection (0.012), SMS (0.029), staff (0.015), window (0.009), quick (0.017) Yes Peng et al., 2022b
15 Peer
interaction
Child (0.033), like (0.017), companion (0.013), family (0.011), adult (0.011), together (0.010), kid (0.010), ski buddy (0.010), friend (0.009), son (0.009) No This study identifies
16 Ski instructor quality First time (0.035), instructor (0.022), beginner (0.021), patient (0.017), beginner trail (0.013), learn (0.012), professional (0.007), cannot (0.014), novice (0.010), practice (0.008) No This study identifies
As shown in Table 2, this study identifies 16 experience factors, with the naming of 12 factors derived from prior literature on ski tourist behavior. Notably, Ski Instructor Quality and Peer Interaction represent two novel factors not previously examined in the ski tourism experience literature. For instance, references to tourists’ own skill development highlight that, for beginners, hiring instructors constitutes a substantial component; this aligns with the reality that 80% of skiers in China are novices, underscoring a distinctive influencing factor in the Chinese ski market compared to others. The study categorizes feature words such as “child”, “family”, “adult”, “kid”, “friend”, and “son” under Peer Interaction, emphasizing that interactions with companions form a critical part of the image perception process for ski tourists. These 16 experience influencing factors are established as evaluation indicators for ski resort experience quality, applied to assess experience quality across the four major ski tourism areas.

4.2 Comparative study on experience quality evaluation in the four major ski tourism areas

As previously mentioned, this study selects ski resorts from the Northeast China, North China, Northwest China, and East China areas—which feature a larger number of resorts and greater industrial scale—as research objects. A comparative analysis is conducted from three dimensions: evaluation of evolutionary trend characteristics of experience quality, overall evaluation of experience quality, and evaluation of influencing factors on experience quality. Additionally, important recommendations are provided for optimizing ski tourism experience quality in each area.

4.2.1 Comparative evaluation of experience quality evolutionary characteristics

From the perspective of temporal evolutionary trends in experience quality, Figure 6 illustrates the overall sentiment changes in the four major ski tourism areas across nearly 10 ski seasons from 2015/2016 to 2024/2025. In the Northeast area, positive sentiment increased by only 5.7% over the 10 ski seasons, while negative sentiment decreased by 4.8%. In North China, both positive and negative sentiments showed significant changes, with positive sentiment rising by 12.6% and negative sentiment falling by 10.2%. The Northwest area exhibited a 5.4% growth in positive sentiment and a mere 1.2% decline in negative sentiment. East China, starting with the lowest initial positive sentiment, improved rapidly, with positive sentiment increasing by 9.9% and negative sentiment decreasing by 5.8% over the 10 ski seasons. Overall, positive sentiment across the four ski tourism areas showed an upward trend, while negative sentiment trended downward. By the 2024-2025 ski season, sentiment scores in all four areas had reached their peak performance. This indicates that China’s ski tourism destinations are developing in a positive direction, though areas for improvement remain. Notably, the Northeast and Northwest areas, dominated by established ski resorts, exhibited high initial posi-tive sentiment scores in earlier seasons but limited improvements in recent years; in contrast, the North China and East China areas, with more emerging ski resorts, demonstrated marked overall enhancements in positive sentiment.
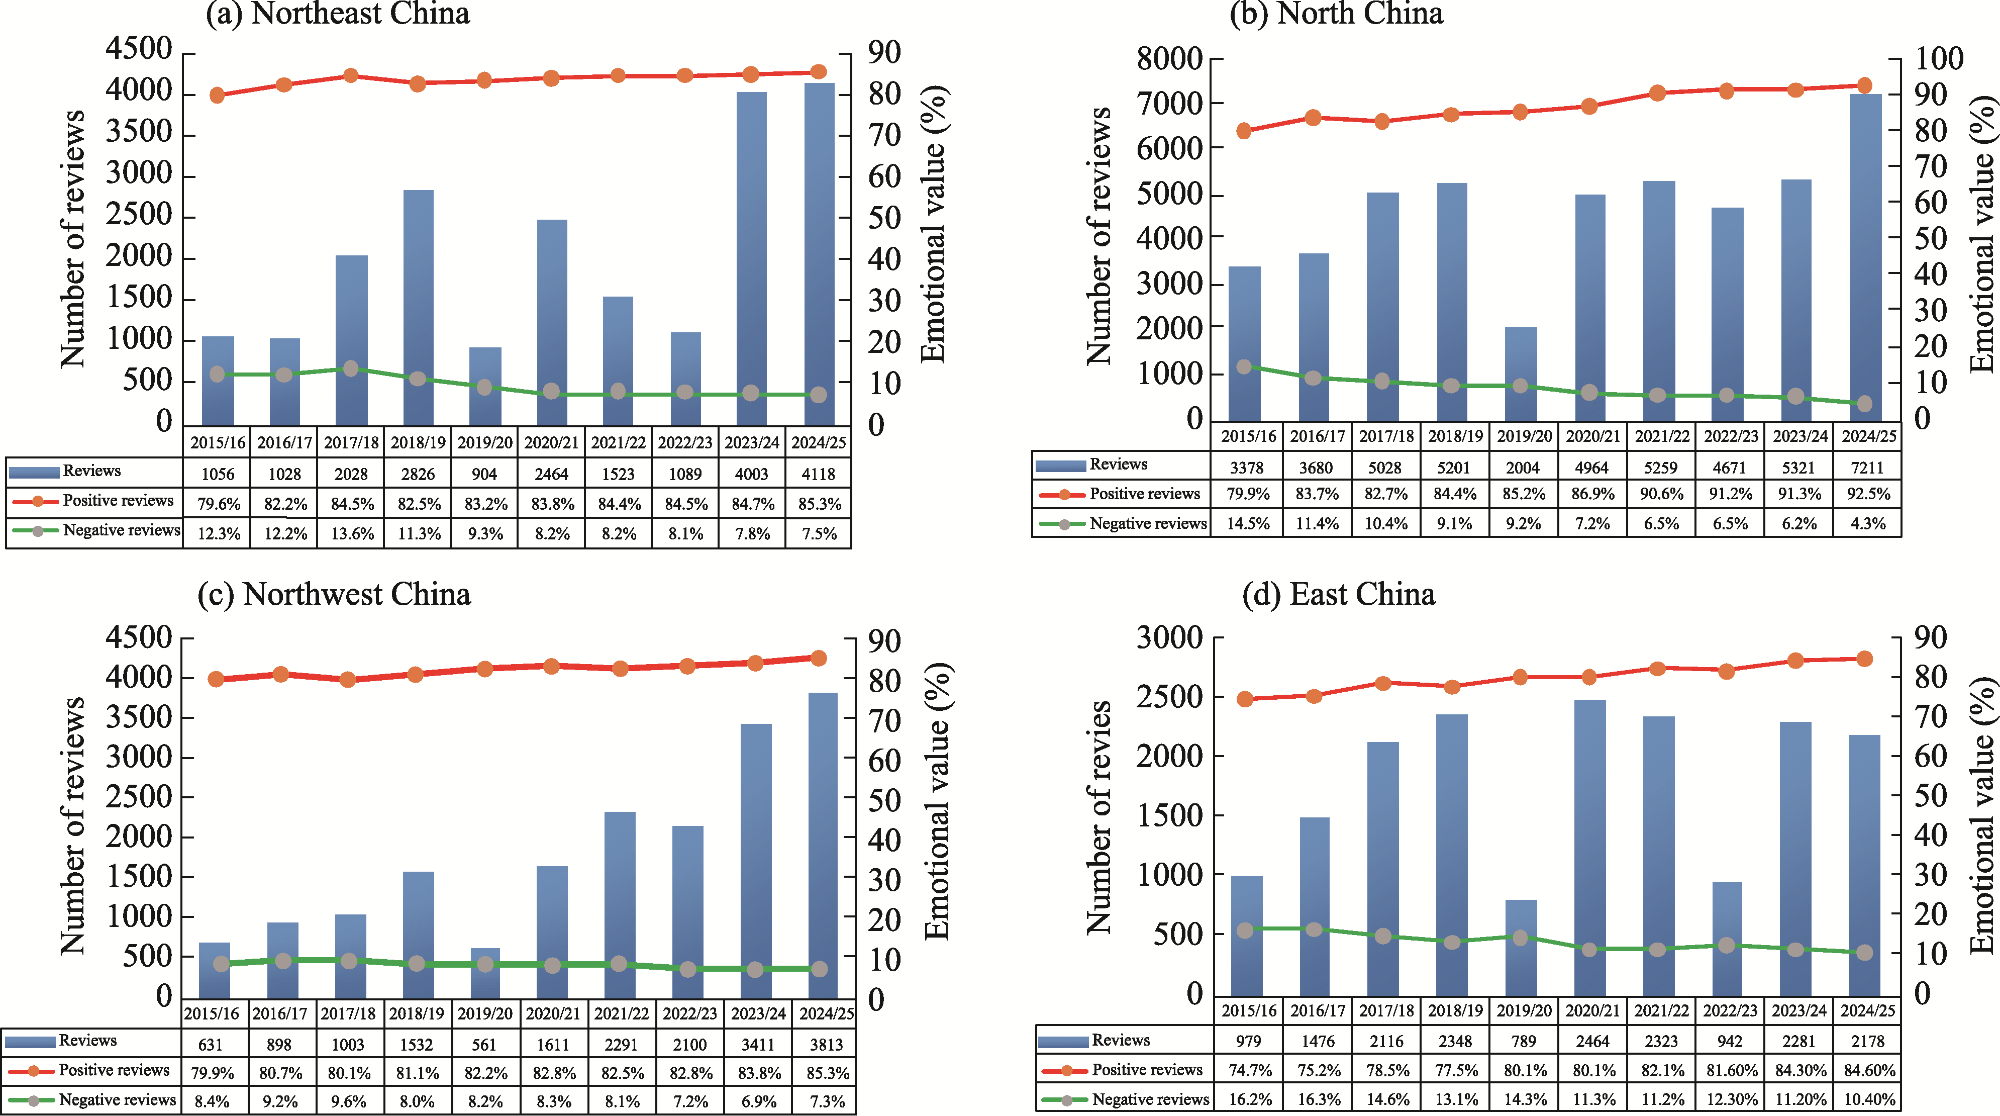
Figure 6 Sentiment evolution of four ski tourism areas (2015/2016-2024/2025)

4.2.2 Experience quality overall evaluation comparison

In this step, the Text-CNN model directly treats online reviews as a whole and determines the sentiment orientation of each review. This model reflects tourists’ comprehensive sentiment scores toward ski resort destinations, without involving specific experience factor analysis. Furthermore, to understand the trends in experience quality changes across different ski tourism areas, the study divides the online reviews from 2015 to 2025 by area. The final obtained review data are classified and statistically analyzed according to the Northeast, North China, Northwest, and East China areas.
Table 3 presents the experience quality scores for the four major ski tourism areas. Overall, positive sentiment is ranked from highest to lowest as follows: North China, Northeast, Northwest, and East China. Negative sentiment is ranked from highest to lowest as: East China, Northeast, Northwest, and North China. In terms of total review volumes, North China has the highest number of reviews, Northwest the lowest, while Northeast and East China have comparable quantities. From this, it can be inferred that ski tourism popularity is highest in North China, followed by Northeast, with Northwest and East China exhibiting similar levels.
Table 3 Comprehensive emotional scores of the four ski tourism areas
Area Number of reviews Positive reviews Negative reviews
Number Proportion (%) Number Proportion (%)
Northeast China 21039 17546 83.40 2812 13.37
North China 46717 40129 85.90 3536 7.57
Northwest China 17851 14636 81.99 1710 9.58
East China 17896 13833 77.30 2442 13.65

4.2.3 Comparison of factors affecting experience quality

To deeply evaluate and explore the advantages and challenges of each ski tourism area, this study, based on the ski tourism experience influencing factors identified in Section 4.1, employs IPA to conduct a detailed comparison of the experience advantages and disadvantages across areas. According to the theoretical connotation of the IPA model, the mean satisfaction value of the overall indicators for each area is represented as the intersection point on the X-axis, and the mean importance value as the intersection point on the Y-axis. By quantifying the importance and performance of each factor, this study reveals the unique attributes of different areas and accordingly proposes targeted management strategies to optimize tourists’ overall experience.
Figure 7 presents the IPA results for the four major ski tourism areas. In Northeast China ski tourism area. The first quadrant highlights the advantageous experience factors in this ski tourism area, including Emotional Perception, Ski Slope Quality, Ticketing Service, Natural Scenery, Peer Interaction, and Ski Slope Diversity; these factors exhibit high satisfaction and overall importance, with the recommended strategy being to maintain their high importance and performance. The second quadrant’s improvement factors comprise Ski Instructor Quality, Staff Service, and Price Perception; these key disadvantageous experience factors require prioritized enhancement and improvement to gradually shift toward the first quadrant. The third quadrant’s low-priority development factors include Ski Resort Congestion, Catering Conditions, and Accommodation Facilities; although of lower priority and not necessitating immediate focus, they can be upgraded as market opportunities mature. The fourth quadrant’s maintenance factors encompass Lifting Equipment, Entertainment Facilities, Traffic Conditions, and Ski Resort Reputation; these can be further leveraged to transform into competitive advantages, requiring timely maintenance under resource constraints without substantial investment of time or effort. Therefore, this area should address the disadvantageous factors by emphasizing improvements in staff service levels and ski instructor teaching quality, while appropriately reducing ski prices for beginner groups.
Figure 7 IPA of four ski tourism areas (2015/2016-2024/2025)
In North China ski tourism area. The first quadrant identifies the advantageous experience factors in this area, including Ski Resort Reputation, Ski Slope Quality, Natural Scenery, Staff Service, Emotional Perception, Peer Interaction, and Ticketing Service; these factors exhibit high performance and importance, with the recommended strategy being to maintain their elevated levels of importance and performance. The second quadrant’s improvement area encompasses Price Perception and Ski Resort Congestion; these key disadvantageous factors require prioritized enhancement and improvement to gradually shift toward the first quadrant, reflecting the area’s popularity. The third quadrant’s opportunity area includes Ski Instructor Quality and Lifting Equipment, which are of low priority and unsuitable for immediate focus under resource constraints but can be upgraded as market opportunities arise. The fourth quadrant’s maintenance area comprises Traffic Conditions, Catering Conditions, Accommodation Facilities, Entertainment Facilities, and Ski Slope Diversity; these factors, with high satisfaction but low importance, can be further leveraged to transform into competitive advantages, requiring only maintenance of the status quo under limited resources. Therefore, managers in this area should focus on mitigating Ski Resort Congestion by appropriately limiting the number of skiers on slopes, introducing weekday discount ski programs, and alleviating weekend congestion through diversion measures.
In Northwest China ski tourism area. The first quadrant identifies the advantageous experience factors in this area, including Ski Slope Quality, Natural Scenery, Ski Slope Diversity, Emotional Perception, Peer Interaction, Ski Instructor Quality, and Catering Conditions; these factors exhibit high performance and importance, with the recommended strategy being to maintain their elevated levels of importance and performance. Similar to the Northeast area, Ski Slope Quality and Ski Slope Diversity suggest evident core strengths in this area. The second quadrant's improvement area encompasses Price Perception, Traffic Conditions, and Staff Service; these key disadvantageous factors require prioritized enhancement and improvement to gradually shift toward the first quadrant, where Traffic Conditions appear in the improvement area for the first time, possibly due to the weaker geographical location of ski resorts in the Northwest, with a high proportion of out-of-area visitors leading to more negative sentiments. The third quadrant's opportunity area includes Accommodation Facilities, Entertainment Facilities, and Ticketing Service, which are of low priority and unsuitable for immediate focus under resource constraints but can be upgraded as market opportunities arise. The fourth quadrant’s maintenance area comprises Ski Resort Reputation, Lifting Equipment, and Ski Resort Congestion; these factors, with high satisfaction but low importance, can be further leveraged to transform into competitive advantages, requiring timely maintenance under limited resources. Therefore, this area should optimize internal and external transportation at ski resorts (e.g., introducing charter flights and group tours to reduce discomfort from long travel times), enhance route optimization and travel time reminders within the area, comprehensively improve staff service levels, and strengthen management through training activities.
In East China ski tourism area, where the overall sentiment score is the lowest. The first quadrant identifies fewer advantageous experience factors, including Natural Scenery, Emotional Perception, Peer Interaction, and Ski Instructor Quality; these factors exhibit relatively high performance and importance, with the recommended strategy being to maintain their elevated levels of importance and performance. The second quadrant’s improvement area encompasses Price Perception, Ski Slope Quality, Ski Resort Congestion, Staff Service, and Ticketing Service; these key disadvantageous factors require prioritized enhancement and improvement to gradually shift toward the first quadrant, with the disadvantage in Ski Slope Quality potentially stemming from higher temperatures in southern areas hindering artificial snowmaking, and congestion arising from fewer ski resorts and limited options for local visitors. The third quadrant’s opportunity area includes Ski Resort Reputation, Lifting Equipment, and Ski Resort Congestion, which are of low priority and unsuitable for immediate focus under resource constraints but can be upgraded as market opportunities arise. The fourth quadrant’s maintenance area comprises Accommodation Facilities, Traffic Conditions, Entertainment Facilities, and Catering Conditions; these factors, with high satisfaction but low importance, can be further leveraged to transform into competitive advantages, requiring only maintenance of the status quo under limited resources. Therefore, this area should prioritize improving Ski Slope Quality, enhancing Staff Service levels, reducing Ski Resort Congestion, elevating Ticketing Service quality, and optimizing ticketing and inspection processes.
The above analysis reveals that Natural Scenery, Emotional Perception, and Peer Interaction serve as common advantageous factors across the areas. Experienced skiers are more likely to evaluate the cognitive image of destinations, whereas less experienced skiers tend to prioritize assessments of emotional experiences, as skiers’ skill levels and prior destination experiences are closely related (Andersen et al., 2017). In the Chinese ski tourism market, beginners constitute a high proportion and have limited prior experiences, thereby elevating the importance of emotional experiences; this also underscores the significance of nature affinity and social interactions in ski tourism. Meanwhile, Price Perception emerges as a pervasive disadvantageous factor, suggesting that managers should enhance price structure transparency, reduce hidden fees, and offer preferential policies for beginners to foster tourist loyalty and improve market conversion rates. Besides, the leading position of North China can be attributed to its synergistic advantages: a robust regional economy, mature ski industry infrastructure (leveraging post-Olympic legacy), and a vast local consumer market. In contrast, East China’s challenges, despite economic strength, stem from geographic constraints (higher temperatures increasing snowmaking costs) and a nascent industry stage, leading to higher perceived costs and lower evaluations of slope quality.

5 Discussions and conclusions

5.1 Discussions

This study identified 16 influencing factors on ski tourism experience quality, with the newly recognized factors of Ski Instructor Quality and Peer Interaction offering significant theoretical implications. Their prominence can be effectively interpreted through the lenses of experiential learning theory and social tourism theory, considering the beginner-dominated profile of the Chinese ski market.
First, the significance of Ski Instructor Quality strongly aligns with experiential learning theory (Kolb, 1984). This theory frames learning as a process grounded in experience, where effective guidance is essential for transforming concrete experience into abstract conceptualization and active experimentation. In the context where approximately 80% of Chinese skiers are novices (Vanat, 2025), the instructor transitions from a peripheral service provider to a central experiential facilitator. A high-quality instructor accelerates skill acquisition, mitigates perceived risk and frustration, and thereby directly enhances the novice’s sense of achievement and enjoyment. This finding extends beyond Peng et al.’s (2022a) broader “interaction perception” dimension by pinpointing the pedagogical relationship as a critical and distinct driver of satisfaction for first-time or low-experience visitors, a nuance less pronounced in markets with a higher share of expert skiers.
Second, the identification of Peer Interaction as a common advantageous factor across all regions underscores the profound role of social dynamics in shaping tourism experiences, a core premise of social tourism theory (Minnaert et al., 2009). This perspective highlights tourism as a social practice where interactions with travel companions (family, friends) are not incidental but integral to the value creation process. The positive sentiments associated with terms like “family”, “kids”, and “friends” in reviews suggest that skiing serves as a shared social ritual. The enjoyment derived from shared challenges, mutual encouragement, and collective memory-making significantly amplifies the emotional payoff (Tung and Ritchie, 2011). This finding corroborates but also deepens Chi et al.’s (2025) observation on social attributes, by positioning peer interaction not just as an attribute, but as a primary mechanism for generating positive emotional perception (“unforgettable”, “happy”). It suggests that in the Chinese context, the social experience often compensates for or even overshadows potential shortcomings in physical infrastructure, especially in emerging regions like East China.
In conclusion, the prominence of these two factors illuminates a potential experiential paradigm in emerging ski markets: one where the journey from novice to enthusiast is socially mediated and guided. This paradigm complements traditional models focused on terrain, snow quality, or facilities. It implies that destination management strategies, particularly in beginner-heavy markets, must prioritize investments in human capital (instructor training) and social infrastructure (creating group-friendly facilities and programs) to foster both skill development and social bonding, thereby enhancing overall experience quality and loyalty.

5.2 Conclusions

In summary, this study enriches ski tourism theory by constructing a comprehensive evaluation framework using online reviews, identifying 16 factors, and revealing spatiotemporal heterogeneity in China’s four major ski tourism areas. Theoretically, it advances bottom-up explorations of experience quality, filling gaps in emerging market research. Managerially, for North China (leading in quality), maintain advantages in Natural Scenery and Peer Interaction through eco-friendly enhancements; for Northeast and Northwest, accelerate improvements in Ski Instructor Quality via training subsidies; for East China, address Price Perception with affordable packages to leverage growth. Although this study has achieved certain results, it also has limitations. First, the research is based on reviews from a specific time period, which may not fully reflect the current situation, especially amid the evolving consumption capabilities and travel experiences of tourists. Second, the IPA results may be influenced by regional characteristics of ski tourism areas and review volumes. Third, the data in this study were exclusively derived from online review users. This population may exhibit a self-selection bias, as they tend to be more proactive in posting reviews, particularly those with extreme (highly satisfied or highly dissatisfied) experiences. Consequently, the study findings should be interpreted with caution when generalizing to the broader skiing tourist population.
[1]
Ahani A, Nilashi M, Yadegaridehkordi E, et al. 2019. Revealing customers’ satisfaction and preferences through online review analysis: The case of Canary Islands hotels. Journal of Retailing and Consumer Services, 51: 331-343.

DOI

[2]
Andersen O, Ian H, Asa Y, et al. 2017. Affective and cognitive dimensions of ski destination images. The case of Norway and the Lillehammer region. Scandinavian Journal of Hospitality & Tourism, 17(4): 389-406.

[3]
Bi J W, Zhu X E, Han T Y. 2024. Text analysis in tourism and hospitality: A comprehensive review. Journal of Travel Research, 63(8): 1847-1869.

DOI

[4]
Brown A, Reade J J. 2019. The wisdom of amateur crowds: Evidence from an online community of sports tipsters. European Journal of Operational Research, 272(3): 1073-1081.

DOI

[5]
Chen X, Xu S, Tang C, et al. 2022. Evaluation and promotion model of tourist satisfaction in ice and snow tourism destinations. Journal of Resources and Ecology, 13(4): 635-645.

DOI

[6]
Cheng X, Fu S, Sun J, et al. 2019. An investigation on online reviews in sharing economy driven hospitality platforms: A viewpoint of trust. Tourism Management, 71: 366-377.

DOI

[7]
Chi X Q, Zhang B, Tang C C, et al. 2025. Ski tourism and destination attractiveness: Two separate importance-performance analyses before and after the pandemic in Korean and Chinese markets. Tourism Management Perspectives, 57: 101360. DOI: 10.1016/j.tmp.2025.101360.

[8]
Chuang J, Manning C D, Heer J. 2012. Termite:Visualization techniques for assessing textual topic models. Proceedings of the International Working Conference on Advanced Visual Interfaces. Capri Island, Italy: Association for Computing Machinery. DOI: 10.1145/2254556.2254572.

[9]
Fang M, Yodmanee T. 2008. Measuring tourist satisfaction by attribute and motivation: The case of a nature-based resort. Journal of Vacation Marketing, 14(1): 41-56.

DOI

[10]
Giachino C, Truant E, Bonadonna A. 2019. Mountain tourism and motivation: Millennial students’ seasonal preferences. Current Issues in Tourism, 23(19): 2462-2477.

[11]
Hall J, O’Mahony B, Gayler J. 2016. Modelling the relationship between attribute satisfaction, overall satisfaction, and behavioural intentions in Australian ski resorts. Journal of Travel & Tourism Marketing, 34(6): 764-778.

[12]
Hannigan T R, Haans R F J, Vakili K, et al. 2019. Topic modeling in management research: Rendering new theory from textual data. Academy of Management Annals, 13(2): 586-632.

DOI

[13]
Högström C, Rosner M, Gustafsson A. 2010. How to create attractive and unique customer experiences: An application of Kano’s theory of attractive quality to recreational tourism. Marketing Intelligence & Planning, 28(4): 435-450.

[14]
Kiatkawsin K, Sutherland I, Kim J Y. 2020. A comparative automated text analysis of Airbnb reviews in Hong Kong and Singapore using latent Dirichlet allocation. Sustainability, 12(16): 6673. DOI: 10.3390/su12166673.

[15]
Kim D. 2010. The influence of demographics, experience, and expertise on the destination image of ski resorts. International Journal of Tourism Sciences, 10(3): 65-90.

DOI

[16]
Knutson B J, Singh A J, Yen H, et al. 2004. Guest satisfaction in the US lodging industry using the ACSI model as a service quality score-board. Journal of Quality Assurance in Hospitality & Tourism, 4(3/4): 97-118.

[17]
Kolb D A. 1984. Experiential learning: Experience as the source of learning and development. Englewood Cliffs, USA: Prentice-Hall.

[18]
Lai I K W, Hitchcock M. 2015. Importance-performance analysis in tourism: A framework for researchers. Tourism Management, 48: 242-267.

DOI

[19]
Li C X, Li H, Liu Y Z, et al. 2020. A research on the differences of inbound tourist perceived experience based on text mining. Nankai Bussiness Review, 23(1): 28-39. (in Chinese)

[20]
Li J, Xu L, Tang L, et al. 2018. Big data in tourism research: A literature review. Tourism Management, 68: 301-323.

DOI

[21]
Li J L, Yang S Y. 2025. The formation mechanism of ski tourism behavioral intention: Multi-theory model comparison and screening and dual-system integration research based on MGB. Journal of Sports Research. Online first. DOI: 10.15877/j.cnki.nsic.20250821.002. (in Chinese)

[22]
Li L, Xie S Y, Tang Y N, et al. 2021. Study on the experience types of eco-tourism tourists and their influencing factors. Journal of Central China Normal University (Natural Science Edition), 55(3): 472-482. (in Chinese)

[23]
Li S W, Li J L, Liu X K, et al. 2022. The service quality evaluation of ski tourism and the optimization countermeasures in the post-Beijing Winter Olympic Games—From the perspective of the perception of skiing tourists in Beijing snowfield. Journal of Beijing Sport University, 45(5): 146-161. (in Chinese)

[24]
Li X. 2017. Research on the sustainable development of the three core areas of skiing in China. Journal of Beijing Sport University, 40(10): 9-16. (in Chinese)

[25]
Liang C C, Li R J. 2020. Image perception analysis of Lijiang Ancient City based on LDA and feature dimension. Progress in Geography, 39(4): 614-626. (in Chinese)

[26]
Liu H M, Hu J, Jia Y Y, et al. 2021. A study on the tourism experience quality of historical and cultural districts from the perspective of embodiment—A case study of Jianghan Road and Zhongshan Avenue historical and cultural blocks. Journal of Central China Normal University (Natural Sciences), 55(1): 128-136. (in Chinese)

[27]
Liu Y, Huang K, Bao J, et al. 2018. Listen to the voices from home: An analysis of Chinese tourists’ sentiments regarding Australian destinations. Tourism Management, 71: 337-347.

DOI

[28]
Lu W, Stepchenkova S. 2015. User-generated content as a research mode in tourism and hospitality applications: Topics, methods, and software. Journal of Hospitality Marketing & Management, 24(2): 119-154.

[29]
Luo Y, He J, Mou Y, et al. 2021. Exploring China’s 5A global geoparks through online tourism reviews: A mining model based on machine learning approach. Tourism Management Perspectives, 37: 100769. DOI: 10.1016/j.tmp.2020.100769.

[30]
Martilla J A, James J C. 1977. Importance-performance analysis. Journal of Marketing, 41(1): 77-79.

DOI

[31]
Matzler K, Teichmann K, Strobl A, et al. 2019. The effect of price on word of mouth: First time versus heavy repeat visitors. Tourism Management, 70: 453-459.

DOI

[32]
Matzler K, Johann F, Faullant R. 2007. Customer satisfaction and loyalty to Alpine ski resorts: the moderating effect of lifestyle, spending and customers’ skiing skills. International Journal of Tourism Research, 9: 409-421.

DOI

[33]
Mimbs B P, Boley B B, Bowker J M, et al. 2020. Importance-performance analysis of resident and tourist preferences for water-based recreation in the Southeastern United States. Journal of Outdoor Recreation and Tourism, 31: 100324. DOI: 10.1016/j.jort.2020.100324.

[34]
Minnaert L, Maitland R, Miller G. 2009. Tourism and social policy: The value of social tourism. Annals of Tourism Research, 36(2): 316-334.

[35]
Miragaia D A M, Martins M A D. 2015. Mix between satisfaction and attributes destination choice: A segmentation criterion to understand the ski resorts consumers. International Journal of Tourism Research, 17(4): 313-324.

DOI

[36]
Peng Y X, Yin P, Matzler K. 2022a. Analysis of destination images in the emerging ski market: The case study in the host city of the 2022 Beijing Winter Olympic Games. Sustainability, 14(1): 555. DOI: 10.3390/su14010555.

[37]
Peng Y X, Yin P, Yang J. 2021. Identification of operating elements and concepts of ski tourism resorts based on Grounded Theory. Journal of Chinese Ecotourism, 11(6): 926-937. (in Chinese)

[38]
Peng Y X, Yin P, Yang J J, et al. 2022b. Exploring the tourism experience of beginner skiers in the emerging ski market. Journal of Resources and Ecology, 13(4): 613-623.

[39]
Schwarz C. 2018. ldagibbs: A command for topic modeling in Stata using latent Dirichlet allocation. Stata Journal, 18(1): 101-117.

DOI

[40]
Shi D, Zhang B C, Yi B W. 2022. How is tourist destination perception formed? Exploratory research based on text mining. Tourism Tribune, 37(3): 68-82. (in Chinese)

[41]
Sievert C, Shirley K. 2014. LDAvis: A method for visualizing and interpreting topics. Proceedings of the Workshop on Interactive Language Learning, Visualization, and Interfaces. Baltimore, USA: Association for Computational Linguistics. DOI: 10.3115/v1/W14-3110

[42]
Su Q. 2004. A study on the types of tourists and their experience quality: A case study of Zhouzhuang. Scientia Geographica Sinica, 24(2): 506-511. (in Chinese)

[43]
Sun X L, Lin B S, Luo J. 2018. A review of tourism experience quality evaluation: Research progress, factor interpretation and prospect. Human Geography, 33(1): 143-151. (in Chinese)

[44]
Tang C C, Zeng R, Yang Y J, et al. 2022. High-quality development paths of ice-snow tourism in China from the perspective of the Winter Olympics. Journal of Resources and Ecology, 13(4): 552-563.

DOI

[45]
Tsai C F, Chen K, Hu Y H, et al. 2020. Improving text summarization of online hotel reviews with review helpfulness and sentiment. Tourism Management, 80: 104122. DOI: 10.1016/j.tourman.2020.104122.

[46]
Tung V W S, Ritchie J R B. 2011. Exploring the essence of memorable tourism experiences. Annals of Tourism Research, 38(4): 1367-1386.

[47]
Vanat L. 2025. International report on snow & mountain tourism— Overview of the key industry figures for ski resorts. https://www.thebookedition.com/fr/2025-international-snow-report-p-416037.html.ViewedonOct282025.

[48]
Wang G Q, Wang X, Wang J W, et al. 2022a. The influencing mechanism of urban residents’ skiing tourism behavioral intention under the background of the Winter Olympics—An empirical study based on Beijing. Journal of Arid Land Resources and Environment, 36(5): 178-185. (in Chinese)

[49]
Wang J, Sun Y. 2022. Relationships between tourist experiential value and ice-snow tourism loyalty in Zhangjiakou City, and the moderating effects of travel companions. Journal of Resources and Ecology, 13(4): 646-654.

DOI

[50]
Wang J W, Guo J X, Liu Y, et al. 2022b. Spatial distribution characteristics and influencing factors of ski resorts in China. Geographical Research, 41(2): 390-405. (in Chinese)

[51]
Wang R, Hao J X, Law R, et al. 2019. Examining destination images from travel blogs: A big data analytical approach using latent Dirichlet allocation. Asia Pacific Journal of Tourism Research, 24(11): 1092-1107.

DOI

[52]
Wu B. 2025. White paper on the development of China’s ski industry in 2025 (and the report on the snow season of 2024-2025). https://www.sohu.com/a/929693512_505583.ViewedonOct282025.

[53]
Xie Y J. 2004. Tourism studies. Beijing, China: China Travel & Tourism Press. (in Chinese)

[54]
Xu X, Li Y, Li Y. 2022. Ski tourism experience and market segmentation from the perspective of perceived value: A case study on Chongli District of Zhangjiakou. Journal of Resources and Ecology, 13(4): 655-666.

DOI

[55]
Zeng L, Gao Q, Chen X L. 2021. Studying place reconstruction of traditional rural tourism destinations from the perspective of tourists’ embodied experience in Wuyuan, China. Tourism Tribune, 36(11): 69-79. (in Chinese)

[56]
Zeng Z M, Wang J. 2019. Research on Weibo rumor recognition based on LDA and random forest—Taking 2016 haze rumor as an example. Journal of the China Society for Scientific and Technical Information, 38(1): 87-96. (in Chinese)

[57]
Zhang Y, Eick C F. 2019. Tracking events in Twitter by combining an LDA-based approach and a density-contour clustering approach. International Journal of Semantic Computing, 13(1): 87-110.

DOI

[58]
Zhao W X, Wang J, He Y, et al. 2015. Incorporating social role theory into topic models for social media content analysis. IEEE Transactions on Knowledge and Data Engineering, 27(4): 1032-1044.

DOI

[59]
Zhu Y T, Pang X R, Liang Z X, et al. 2025. Research on the formation mechanism of alpine skiing tourists’ exercise addiction. Human Geography, 40(2): 170-180. (in Chinese)

Outlines

/