Special Column: Realization of Ecological Product Value

Spatial Differentiation Characteristics and Influencing Factors of Water Ecological Product Supply Efficiency in an Urban Water Source Area Based on the Full-process

  • REN Guoping , 1 ,
  • ZHOU Qiong , 1, * ,
  • LI Hongqing 2 ,
  • YANG Can 1 ,
  • OUYANG Hui 1 ,
  • YIN Gang 1 ,
  • MA Xinyun 1
Expand
  • 1. School of Management, Hunan City University, Yiyang, Hunan 413000, China
  • 2. School of Public Administration, Hohai University, Nanjing 211100, China
* ZHOU Qiong, E-mail:

REN Guoping, E-mail:

Received date: 2025-09-09

  Accepted date: 2025-12-06

  Online published: 2026-02-02

Supported by

The Humanities and Social Science Research Foundation of Hunan Education Department(24A0573)

The National Natural Science Foundation of China(42271105)

The Key Laboratory of Key Technologies of Digital Urban-Rural Spatial Planning of Hunan Province(2018TP1042)

Abstract

Accurately calculating the value of water ecological products and the water ecological product supply efficiency (WEPSE) is of great significance in promoting the coordinated balance between ecological protection and economic and social development in a basin, and for enhancing the overall sustainable development capacity of the region. Based on calculations of the value of water ecological products in 184 administrative villages in Qingpu District of Shanghai in 2023, the improved entropy weight DEA model was used to evaluate WEPSE, and the GWR model was used to explore the influencing factors. The following results were obtained. The WEPSE values showed spatial heterogeneity, with a range of variation in Qingpu District in 2023 of [0.497, 1.000] and a decreasing trend from west to east. The overall difference in WEPSE was 0.195. The interregional contribution rate (49.205%) was stronger than either the intraregional contribution rate (26.869%) or the S.V.D contribution rate (23.926%), so it was the main source contributing to the spatial differentiation of WEPSE. The economic factors and social factors were stronger than the livelihood capital factors in the WEPSE variations in Qingpu District. The influencing factors positively correlated with WEPSE were human capital (HC), urbanization rate (UR), agricultural GDP per unit area (AGPA) and Engel coefficient (EG) in sequence. The influencing factors negatively correlated with WEPSE were disposable income (PE) and industrialization degree (ID) in sequence.

Cite this article

REN Guoping , ZHOU Qiong , LI Hongqing , YANG Can , OUYANG Hui , YIN Gang , MA Xinyun . Spatial Differentiation Characteristics and Influencing Factors of Water Ecological Product Supply Efficiency in an Urban Water Source Area Based on the Full-process[J]. Journal of Resources and Ecology, 2026 , 17(1) : 53 -66 . DOI: 10.5814/j.issn.1674-764x.2026.01.005

1 Introduction

While the continuous advancement of ecological civilization construction has improved the quality of the ecological environment to meet the growing needs of the people for a better living environment, China is facing challenges such as increasing resource constraints, environmental pollution and ecosystem degradation. Promoting the value accounting of ecological products is the practical starting point and a key path for realizing the transformation of ‘lucid waters and lush mountains are invaluable assets’ (Xie and Ouyang, 2025). The process of transforming the intrinsic value of various ecological resources into economic, social and ecological benefits is of great significance for establishing and improving the value realization mechanism of ecological products, improving the ecological protection compensation system and promoting the comprehensive green transformation of China’s economy and society (Wang et al., 2025).
Water is a necessary condition for human survival and an important foundation for the sustainable development of society. Water is the most active factor in the ecosystem of the Yangtze River Economic Belt, and it plays an important basic role in maintaining the ecological environment of the Belt and promoting the high-quality development of that area. Water ecological products are the contributions of goods and services provided and used by ecosystems for economic activities and other human activities. It is the Chinese expression of ecosystem services (Wang et al., 2025). The value of water ecological products includes the total value of the supply, regulation, support and cultural services provided by the ecosystem for the sustainable development of social production and human well-being (Zhang et al., 2022a). Through quantitative accounting of the value of ecological products in different regions, we can not only implement specific actions based on the concept of ‘two mountains’, but also objectively view the relationship between economic development and ecological protection, and provide theoretical and data support for promoting the construction of ecological civilization (Wang et al., 2019). Water ecological products have both the resource attributes and ecological environment attributes of water, and their effective supply can promote the diversity, stability and sustainability of the ecosystem in the Yangtze River Economic Belt. Therefore, studying the supply efficiency of water ecological products is of great theoretical and practical significance for the realization of human-water harmony and the ‘two mountains’ transformation and high-quality development in the region (Wang et al., 2025).
At present, theoretical research on the value of water ecological products has achieved fruitful results, but it still faces the practical dilemmas of different accounting frameworks (Ouyang et al., 2020), strong subjectivity (Wang et al., 2023) and poor comparability (Bashir et al., 2024) in terms of accounting methods and accounting applications. The research results are difficult to fully utilize in protecting and improving the ecological environment. Therefore, building a unified and effective ecological product value accounting method system, and promoting the standardization of accounting systems and the accuracy of accounting results, in order to cope with the complexity of ecological product value accounting and the comparability of accounting results, has become a key issue to solve urgently in the realization of ecological product value.
Studies on the value accounting of water ecological products and WEPSE mainly focus on the following three contents. 1) Value accounting of ecological products. Based on the relevant content of GEP accounting, scholars have mainly selected corresponding indicators from three aspects: material products, adjustment services and cultural services to calculate the value of ecological products (Costanza et al., 1997; Ouyang et al., 2020). 2) Measurement of WEPSE. Scholars have selected the factors of human, material and financial resources or labor, capital, energy, etc., as the input indicators (Hein et al., 2016; Obst et al., 2016; Bao et al., 2019; Yang et al., 2019; Ali et al., 2024), and used ecological products as the output, along with traditional DEA, three- stage DEA, SBM, super-efficiency SBM and other methods to measure WEPSE (Ali, 2023; Wang et al., 2023; Ali et al., 2024; Cheng et al., 2025; Keskin et al., 2025). 3) In terms of factors influencing the supply efficiency of ecological products, scholars have mainly considered the levels of economic development, industrial structure, and investment in science and technology (Wang et al., 2017; Zhang et al., 2019; Droogers and Allen, 2022; Wang et al., 2023).
The existing research results were of great value for improving the theoretical methods of ecological product value accounting, but they still have some shortcomings. 1) The equivalent factor tables have a certain time lag and strong subjectivity, which in turn affects the accuracy of the accounting results, so the accounting results cannot accurately reflect the actual situation. 2) The traditional DEA-based model is affected by the extreme weight distribution principle of self-assessment efficiency, that is, it deliberately separates the correlations between evaluation units and cannot distinguish the sizes of effective units, so that applying the evaluation results in practice is difficult. The traditional DEA model calculates the extreme weight distribution mode of evaluation efficiency after the improvement of the optimal solution process, which often results in a high correlation between the evaluation units, resulting in a large evaluation value. 3) The analysis of influencing factors has been mainly based on qualitative research, and a simple linear regression analysis is often used even for quantitative analysis. This method ignores the spatial non-stationarity of influencing factors, resulting in low research accuracy. However, the water ecosystem is affected by many factors and presents spatial imbalance and dependence. Therefore, it is difficult to analyze the impact of socio-economic factors on WEPSE using the OLS model based on “stationary hypothesis embedding” (Zhou et al., 2025).
In view of these issues, this study develops an accurate and comprehensive definition of water ecological products based on the whole process of water ecological product supply, and further establishes two sets of index systems for water ecological product value accounting and WEPSE evaluation. The value accounting results of water ecological products are then used as the output indicators in the evaluation index system of WEPSE. The improved entropy weight DEA model, Dagum Gini coefficient, GWR model and other methods are used to analyze the WEPSE, regional differences and influencing factors of water ecological products in urban water source areas, in order to promote both the WEPSE in this area and the construction of water ecological civilization. At the same time, the results of this study can provide a reference for promoting the construction of water ecological civilization, promoting the harmonious development of humans and water, and help with the high- quality development of the Yangtze River Economic Belt.

2 Methods and data sources

2.1 Study site

The case study area is situated in Qingpu District, a typical suburban district located on the west side of Shanghai, bordering Zhejiang Province and Jiangsu Province. It extends over approximately 668 km2 and is divided into three sub-districts and eight towns, consisting of 184 villages in total. The terrain of the Qingpu District is flat, since it is a plain tidal water network area, and the average altitude spans 2.8-3.5 m. The average daily temperature in the whole region is about 17.6 ℃. There are 1817 rivers with a total length of 2155 km, and 21 lakes with a total area of 59.3 km2. The landform differentiation in Qingpu District is significant. The western lake area takes Dianshan Lake as the core, and the water area is vast, accounting for 22% of the total area. The river network in the eastern river port area is dense, and the main river channel belongs to the Huangpu River system, which is significantly affected by tides. In 2023, Qingpu District achieved a regional GDP of 71.809 billion yuan, a total agricultural output value of 1.029 billion yuan, and a total industrial output value of 4.103 billion yuan. By the end of 2023, the total resident population of Qingpu District was 1.28 million, of which the non-agricultural population was 0.99 million. As the largest freshwater lake in Shanghai, Dianshan Lake is one of the sources of Huangpu River with an area of 62 km2. Dianshan Lake is an important waterway connecting southern Jiangsu and Shanghai. Its annual freight volume exceeds 10 million t, so it supports regional logistics and trade.

2.2 Methods

This study attempts to clarify the whole process of water ecological product supply and accurately define it. Water ecological products are originally derived from water ecosystems, but they are also inseparable from human protection and the restoration of water ecosystems (human input I). The whole process of water ecological product supply includes two stages. 1) Primary water ecological product supply stage. Primary water ecological products are directly produced in the water ecosystem, but not all of them can fully meet the needs of human beings. 2) Ultimate water ecological product supply stage. Some primary aquatic ecological products can be transformed into end products or services that can better meet the needs of human society through human transformation (human input II). The functional diversity of water ecological products can make people realize the importance of the water ecosystem, further promoting the protection and restoration of the water ecosystem (human input I) and increasing the supply of primary water ecological products, thus forming a virtuous cycle of water ecological product supply. Therefore, the whole process based on the supply of water ecological products includes not only primary water ecological products, but also the ultimate water ecological products that can be used and consumed by human beings after their transformation from primary water ecological products (Edens and Hein, 2013; Costanza et al., 2017).

2.2.1 Calculation of the water ecological product value

This study referred to the Wetland Ecosystem Service Assessment Specification (LY/T 2899-2017), Technical Guidelines for Gross Ecosystem Product (GEP) Accounting, Accounting Specification for Total Value of Ecological Products and other documents and related literature. Following the principles of comprehensive systematic rigor, data availability and regional characteristics, the corresponding contents were selected from three aspects: material products, regulatory services and cultural services to construct the value accounting index system of water ecological products (Zadehdabagh et al., 2022; Zhang et al., 2022b; Wang et al., 2023; Sangha et al., 2024; Zhang et al., 2024). In this context, material products refer to the products that can be used or consumed to meet human needs, and were provided by the joint action of the water ecosystem and human input. In this study, it mainly includes four evaluation indexes: water resource supply, freshwater products, hydropower generation and inland shipping. A regulatory service refers to the environmental conditions and effects that are conducive to production and life formed by the joint action of aquatic ecosystems and human inputs. In this study, it mainly includes five evaluation indicators: water quality purification, surface water storage, groundwater storage, flood storage and gas regulation. Cultural services refer to the services such as sightseeing, entertainment and leisure provided by the water ecosystem and human input. Tourism income was used as an important reference to reflect the cultural services of water ecological products (Table 1).
Table 1 Index system for calculating the water ecological product value
Type Indicator Item Value-accounting method
Product services
(PS)
Water supply
(WSP)
1. Agricultural water
use
2. Industrial water
use
3. Domestic water
use
4. Artificial
replenishment
water
${{V}_{1}}=\mathop{\sum }^{}{{A}_{m}}\times {{P}_{m}}$
where V1 is the water supply value (billion yuan), Am is the water resource supply (billion m3), and Pm is the market price of the m-th type of water for different uses. Referring to relevant literature, the average industrial water price and the average domestic water price respectively came from the ‘Monthly Average Price Index of Industrial Production Materials in 36 Large and Medium-sized Cities’ and the ‘Monthly Average Price List of Service Charges in 36 Large and Medium-sized Cities’ in the China Price Engineering Yearbook 2023. The industrial water price was 3.88 yuan t–1, and the domestic water price was 2.07 yuan t–1. The prices of agricultural water and artificial ecological environment replenishment water were 0.1 yuan t–1
Freshwater
products
(FWP)
1. Fresh-water
aquaculture
products
2. Fresh-water
fishing products
${{V}_{2}}=\frac{\mathop{\sum }^{}{{B}_{m}}\times P}{{{10}^{8}}}$
where V2 is the freshwater product value (billion yuan), Bm is the output of the m-th type of freshwater product (t), and P is the comprehensive average price of freshwater products, which was taken as 11890 yuan t–1
Hydropower
generation
products
(HGP)
Hydropower
generation
${{V}_{3}}=C\times P$
where V3 is the value of hydropower generation (million yuan), and C is the hydropower generation quantity (kW). P is the hydropower generation price, which was taken as the residential electricity price, sourced from the monthly average price list of service charges in 36 large and medium-sized cities in the China Price Yearbook 2023, and the price was 0.53 yuan (kWh) –1
Inland waterway
transportation
(IWT)
1. Passenger
turnover
2. Freight
turnover
${{V}_{4}}=\frac{\mathop{\sum }^{}{{D}_{m}}\times {{P}_{m}}}{{{10}^{4}}}$
where V4 is the value of inland waterway transportation (million yuan), Dm is the waterway passenger turnover (in ten thousand passenger-kilometers) or waterway cargo turnover (in ten thousand ton-kilometers), and Pm is the average price per unit of passenger and freight transport, 0.24 yuan and 0.06 yuan, respectively
Regulatory services
(RS)
Water
purification
products
(WPP)
Water
purification
${{V}_{5}}=\frac{\left( E-F \right)\times P}{{{10}^{4}}}$
where V5 is the value of water quality purification (billion yuan), E is the amount of urban sewage discharge (m3), F is the total amount of urban sewage treatment (m3), and P is the cost of unit sewage treatment, which was 0.7 yuan(kWh) –1
Surface water
regulation
(SWS)
Water regulation
and storage
${{V}_{6}}=G\times P$
where V6 is the value of surface water regulation and storage (million yuan), G is the amount of surface water resources (m3), P is the unit regulation price of surface water resources, and the domestic water price of 2.07 yuan m–3 was used instead.
Groundwater
regulation
(GWS)
Water regulation
and storage
${{V}_{7}}=H\times P$
where V7 is the groundwater regulation and storage (million yuan), the H is the groundwater resource quantity (m3), the P is the unit transfer and storage price of groundwater resources, which was replaced by the domestic water price, and was 2.07 yuan m–3
Flood
regulation
(FRS)
Flood regulation
and storage
${{V}_{8}}=I\times P$
where theV8 is the value of flood regulation and storage (million yuan), I is the reservoir storage area (m3), and P is the flood regulation and storage unit price. The investment in building a reservoir with a certain storage capacity was taken as the flood regulation and storage unit price, which was 6.11 yuan m–3
Gas regulation
products
(GRS)
Gas regulation ${{V}_{9}}=\frac{J\times ET\times P}{{{10}^{5}}}\times \left( \frac{r}{3600\times s}+t \right)$
where V9 is the value of gas regulation (million yuan), J is the water area within the provincial territory (km2), and ET is the annual average evaporation amount of the water area in each province. The P is the residential electricity price, taken as 0.53 yuan (kWh) –1. The r is a standard atmospheric pressure saturated water vapor latent heat of 2.82×10⁶ J kg–1. The s is a standard energy and was taken as 3. The t is electricity consumption for 1 m3 of water to be converted into steam and was taken as 125 kWh
Cultural services
(CS)
Tourism revenue
products
(TRP)
Tourism revenue ${{V}_{10}}=K\times L$
where V10 is the value of cultural services (million yuan), and K is the total tourism revenue (million yuan). The L is the proportion of tourism revenue in the total and was taken as 12.3%

2.2.2 Evaluation of WEPSE

(1) Constructing the evaluation index for WEPSE
Based on the above analysis, the evaluation index system of the WEPSE in Qingpu District (Table 2) was constructed, and the value accounting results of water ecological products were taken as the output index in the evaluation index of WEPSE. Based on the whole process of water ecological product supply, the corresponding input indexes were selected from three aspects: human, material and financial resources (including human input I and human input II). 1) Human beings are the main body of production, life and environmental protection. Through the collection, purification and treatment of water, the construction of water conservancy infrastructure, and the promotion of fishery development, they can not only continue to promote the production of more high-quality primary water ecological products in the water ecosystem, but also transform the primary water ecological products to produce more final water ecological products that meet the needs of human society. This study selected the number of employees in the water production and supply industry, local water conservancy employees and freshwater fishery professionals as the human input for the evaluation index system of the supply efficiency of water ecological products, and it took the total value of these three as the human input value. 2) Pollution control facilities can remove organic matter and pollutants from sewage and directly reduce the discharge of wastewater. They reduce the pollution of the water ecological environment and can enhance the supply of final water ecological products and primary water ecological products. Industrial wastewater treatment is a key part of wastewater treatment in China. Therefore, choosing the number of industrial wastewater treatment facilities to represent the material input of water ecological product supply is representative and reasonable. 3) Water conservancy is the foundation of the national economy and social development. Water conservancy construction investment involves the development, utilization, conservation and protection of water resources, including the whole process of water ecological product supply, which directly affects the supply of primary water ecological products and final water ecological products. Therefore, this study selected the completion of investment in water conservancy construction and the completion of investment in cultural tourism as the financial input for the supply efficiency of water ecological products.
Table 2 Evaluation index of WEPSE and its descriptive statistics
Type Primary indicator Secondary indicator Unit Sample Ave S.D. Max Min
Input Human
resources
Employees in water production and supply 102 persons 184 1.84 0.92 3.88 0.52
Employees in local water conservancy departments 102 persons 184 3.12 1.75 8.65 0.51
Professional employees in freshwater fishery 102 persons 184 29.54 34.55 85.21 0.48
Material resources Wastewater treatment facilities sets 184 856 458 1456 521
Ecological restoration areas ha 184 65.55 35.11 95.51 51.21
Laying length of the water pipe network km 184 49.65 33.41 78.21 33.28
Financial resources Completed investment in water conservancy construction 108 yuan 184 1.25 1.06 3.66 0.79
Completed investment in cultural and tourism 108 yuan 184 0.55 0.63 0.85 0.42
Output Value of water ecological products 109 yuan 184 0.77 1.53 1.21 0.58
(2) The DEA model for evaluating WEPSE
The water ecosystem is essentially a complex and open ‘input-output’ system. Its process aligns with economic efficiency analysis. Therefore, this study employed Data Envelopment Analysis (DEA) to evaluate the regional water ecosystem. DEA is a classic model for assessing the efficiency of decision-making units (DMUs) with multiple inputs and outputs, and for determining whether they lie on the ‘production frontier’ to assess their DEA effectiveness (Ali, 2024; Cheng et al., 2025; Keskin et al., 2025). Considering the diversity of DEA models and their inherent limitations, the Enhanced Entropy Weight DEA (EW-DEA) model was selected for this study. This choice was made to address two specific issues. 1) The CCR-DEA model’s extreme weight allocation can artificially sever the relationships between evaluation units to avoid distinguishing between the effectiveness of multiple efficient units, which would make it difficult to rank their vulnerabilities. 2) To overcome the problem of overly large evaluation results caused by the ‘preserve the large, suppress the small’ principle in the ACE-DEA model, which calculates the optimal solution based on the highest possible efficiency values for each unit, the EW-DEA model was developed to improve upon this aspect of the ACE-DEA model. The formula of the EW- DEA model was obtained the literature (Ren et al., 2022).

2.2.3 Analysis of the spatial differentiation of WEPSE

The Dagum Gini coefficient for analyzing the spatial differentiation of WEPSE. The Dagum Gini coefficient was used to analyze regional differences in the WEPSE in Qingpu District, identify sources of regional disparities and address issues of overlapping sub-samples. The formula of the Dagum Gini coefficient was obtained from the literature (Ma et al., 2022).

2.2.4 Analysis of factors influencing WEPSE

(1) Variable selection for WEPSE
The dependent variable of the model was the WEPSE values of 184 administrative villages. The central coordinates used for each village were the coordinates of the location of the village committee. This study used the three-factor theory to divide the factors into three categories: economic factors, social factors and farmer livelihood capital. Combined with previous research results (Narita et al., 2018; Yang et al., 2019; Zhang et al., 2024; Xie and Ouyang, 2025) and the actual situation of Qingpu District, 15 independent variables and the supply efficiency of water ecological products were selected for a multicollinearity test to eliminate any redundancy in the variables, which yielded 12 independent variables. The basic statistical characteristics of the variables are shown in Table 3.
Table 3 The factors influencing WEPSE and their descriptive statistics
Type Variable Calculation method and unit S.D. Max Min VIF Sample size
Economic
factors
Agricultural GDP per unit area
(AGPA)
Agricultural GDP/Village area (104 yuan ha-1) 2.57 8.74 2.31 1.58 184
Agricultural labor productivity
(AL)
Gross agricultural output value/number of agricultural practitioners (yuan person-1) 2358 9754 4547 1.99 184
Industrialization degree (ID) Industrial added value/gross village product (%) 30.12 81.54 45.44 5.48 184
Disposable income (PE) The per capita net income of rural farming families (yuan) 7458 5894 12574 4.59 184
Social
factors
Urbanization rate (UR) Total village construction land/total village area (%) 24.89 70.42 45.15 7.85 184
Per capita road mileage (PR) Rural road length/total village population (km person-1) 0.05 0.62 1.01 6.58 184
Population density (PD) Population/ area of village (person km-2) 478 2467 1045 2.04 184
Engel coefficient (EG) Food expenditure/personal consumption expenditure (%) 21.51 49.87 13.57 1.44 184
Agricultural mechanization level
(AM)
Total power of agricultural machinery/cultivated land area (kW ha-1) 0.16 0.45 0.21 3.24 184
Livelihood
capital
Material capital (MC) Original value of productive fixed assets per household (104 yuan) 5334 124.5 8.52 3.56 910
Human capital (HC) Years of education received by the labor force (yr) 8.246 22 9 4.51 910
Social capital (SC) Proportion of farmers participating in cooperative
economic organizations (%)
41.55 91.58 31.85 2.95 910
(2) The GWR model for analyzing the factors influencing WEPSE
The traditional linear regression OLS model, based on the least square method, is commonly used to estimate ‘average’ and ‘global’ parameters. After OLS defines the relationship between the global dependent variable and the independent variable, it calculates the parameter estimation value of the equation through the minimum error square sum, which provides a good estimation of the spatial stationary data regression. However, when the independent variable is spatial data and there is spatial autocorrelation between the independent variables, so it cannot meet the assumption that the residual term of the traditional OLS model is independent, and the ordinary least squares parameter estimation is no longer applicable (Xiao et al., 2025; Yang et al., 2025). The GWR model introduces the estimation of influencing factors in different regions, which allows local parameter estimation to make the relationships between variables change with spatial location, so the results are more aligned with objective reality. To avoid the estimation error caused by the sparseness of adjacent sample data for individual sample points, the Gaussian kernel function was used to determine the weights. Meanwhile, considering the relatively small number of survey samples in this study, the AICc method was used to determine the bandwidth. The formula of the GWR model was obtained from the literature (Yang et al., 2025).

2.3 Data sources and processing

2.3.1 Data sources

1) The geospatial data were obtained from the 1:5000 land use map of Qingpu District for the year 2023. 2) The social data were obtained from the Statistical Yearbook of Qingpu District (2024), the National Economic and Social Development Statistical Bulletin of Qingpu District (2024), the Township Statistical Yearbook of Qingpu District (2024), the Agricultural Statistical Yearbook of Qingpu District (2024), the Industrial Development Report of Qingpu District (2024), and the Forestry Statistical Yearbook of Qingpu District (2024). 3) The investigation data came from several sources. Land data at the village scale came from the ‘Rural Collective Construction Land Census’, which was organized by the Qingpu District Natural Resources Bureau. The social and economic data of farmers came from the rural fixed observation points of Qingpu District and survey data. In addition, five members from the research group conducted a participatory farmer survey from March to October in 2023. A total of 1579 questionnaires were distributed, with an effective recovery rate of 97%.

2.3.2 Data processing

1) The land categories of Qingpu District were transformed and divided into eight types: cultivated land, garden land, forestland, grassland, construction land, transportation land, water area and unused land. 2) The vector maps of Qingpu District were converted into grid maps with pixels of 30 m×30 m, and the values for unused land patches, landscape dimension index and patch density index were calculated using Fragstats 3.3 software. 3) Water areas and vegetation coverage were calculated using the spatial statistical function of ArcGIS 10. 4) The missing or eliminated data of individual evaluation units were interpolated by SPSS software. 5) The range standard method was used to standardize the indicators. 6) The obtained data of farm family members were calculated to generate the index value of farmers’ livelihood capital required for the analysis. The data of family members, household data and geospatial coordinates were tagged with the head of household as the identification code, and any unusual values and missing data were averaged to establish a database of ‘farmers-GIS-livelihood capital’. 7) The road length data and village area data within the boundary of each administrative village were extracted from the 2023 land use status map of Qingpu District of Shanghai by using the spatial analysis function of ArcGIS, and the village center coordinates adopted the coordinates of the village committee. 8) Qingpu District was divided into three rings based on the distance from the study area to Dianshan Lake. The inner ring included Jinze, Zhujiajiao, and Liantang. The middle ring included Yingpu, Xianghuaqiao, and Xiayang. The outer ring included Zhaoxiang, Xujing, Huaxin, Chonggu, and Baihe.

3 Results and analysis

3.1 Results of the water ecological product value

Using the value accounting index of the water ecological product value (WEPV), the supply service values, adjustment service values and cultural service values of 184 administrative villages and 11 townships in Qingpu District were summed, and the following results were obtained. In 2023, the value of WEPV in Qingpu District was 14.793× 10⁹ yuan, and the spatial differentiation was obvious (Table 1 and Table 4). 1) In the regional dimension, the WEPV values in Qingpu District in the inner, middle and outer rings were 7.445×10⁹ yuan, 2.574×10⁹ yuan and 4.774×10⁹ yuan, respectively, so the value of WEPV in the inner ring was the largest. Among them, the largest value of WEPV was for Zhujiajiao (2.984×10⁹ yuan), and the smallest value was for Yingpu (0.362×10⁹ yuan). 2) In the dimension of water ecological product type, the values of supply service, regulation service and cultural service were 9.896×10⁹ yuan, 3.409×10⁹ yuan and 1.488×10⁹ yuan, respectively, so the WEPV value in the inner ring was the maximum. 3) In the dimension of water ecological product index, the value of water resource supply (PS) was the largest (8.225×10⁹ yuan), while the value of gas regulation (GRS) was the smallest (0.156×10⁹ yuan).
Table 4 Spatial distribution of the WEPV in Qingpu District of Shanghai in 2023 (Unit: 109 yuan)
Regions PS RS CS
WSP FWP HGP IWT WPP SWS GWS FRS GRS TRP
Jinze 1.334 0.030 0.135 0.106 0.224 0.149 0.032 0.123 0.025 0.241
Zhujiajiao 1.659 0.037 0.168 0.132 0.278 0.185 0.039 0.153 0.032 0.300
Liantang 1.147 0.026 0.116 0.091 0.192 0.128 0.027 0.106 0.022 0.207
Yingpu 0.201 0.004 0.020 0.016 0.034 0.022 0.005 0.019 0.004 0.036
Xianghuaqiao 0.765 0.017 0.078 0.061 0.128 0.085 0.018 0.071 0.015 0.138
Xiayang 0.465 0.010 0.047 0.037 0.078 0.052 0.011 0.043 0.009 0.084
Zhaoxiang 0.498 0.011 0.051 0.039 0.083 0.056 0.012 0.046 0.009 0.090
Xujing 0.476 0.011 0.048 0.038 0.080 0.053 0.011 0.044 0.009 0.086
Huaxin 0.586 0.013 0.059 0.046 0.098 0.065 0.014 0.054 0.011 0.106
Chonggu 0.372 0.008 0.038 0.029 0.062 0.041 0.009 0.034 0.007 0.067
Baihe 0.723 0.016 0.073 0.057 0.121 0.081 0.017 0.067 0.014 0.131
Inner ring 4.139 0.093 0.420 0.328 0.694 0.462 0.098 0.382 0.079 0.749
Middle ring 1.431 0.032 0.145 0.114 0.240 0.160 0.034 0.132 0.027 0.259
Outer ring 2.654 0.059 0.269 0.211 0.445 0.296 0.063 0.245 0.050 0.480

3.2 Results of WEPSE

3.2.1 Spatial distribution of WEPSE

The EW-DEA model was used to analyze the values of WEPSE in Qingpu District, and the natural breakpoint method was used to classify the evaluation results (Figure 1 and Table 5). The range of variation in the values of WEPSE in Qingpu District in 2023 was [0.497,1.000], and it showed a decreasing trend from west to east. 1) In the overall dimension of the region, the areas of high-value WEPSE (first class and second class) were concentrated in 74 administrative villages around the Dianshan Lake, with a total area of 22301.32 ha. The median value of WEPSE (third class) was concentrated in 57 administrative villages in the south and north, accounting for 29.93% of the total area. However, the areas of low-value WEPSE (fourth class and fifth class) were mainly distributed in 53 administrative villages in the central and eastern regions. 2) In the ring partition dimension, the WEPSE values showed a decreasing trend from the inner ring to the outer ring. Among them, the number of administrative villages having the high WEPSE values (0.895-1.000) of the inner ring was 13, accounting for 46.43% of the total high-value area. The area with low WEPSE values (0.349-0.613) of the outer ring accounted for 69.25% of the total area. The possible reasons for this spatial pattern differentiation of WEPSE are as follows. 1) The water area of the outer ring was small, and its climate regulation and freshwater products were of low value. At the same time, there was a certain amount of input redundancy in the material and financial resources, resulting in a lower value for WEPSE. 2) The outstanding advantage of the middle ring was that the allocation of material and financial input factors was more reasonable, resulting in WEPSE values higher than those of the outer ring. However, the inner ring region was far superior to other regions in terms of water resource endowment, number of supply services and degree of cultural tourism development, resulting in the highest WEPSE values. The above spatial pattern was also in line with the real situation. The outer ring of Qingpu District is close to Shanghai, so the economy is more developed and the water environmental problems are more serious. A large amount of material and financial resources have been invested in the protection and restoration of water ecosystems. However, there may be unreasonable allocation of those material and financial resources.
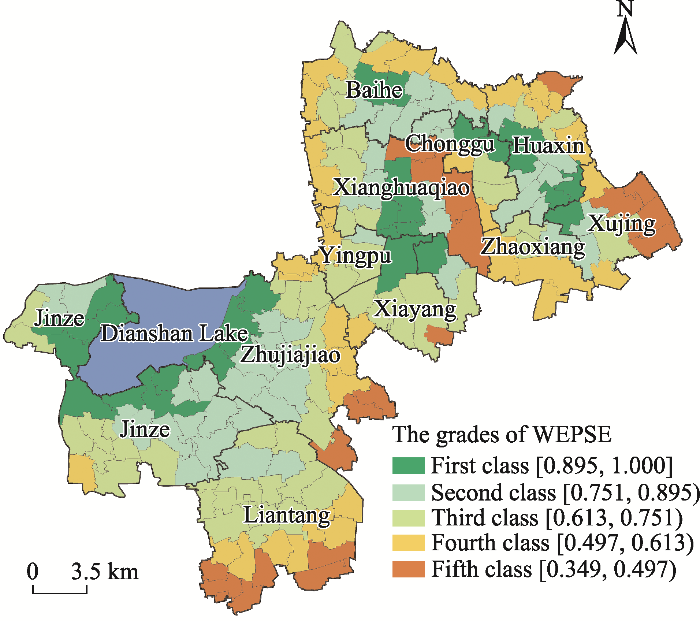
Figure 1 Spatial distribution of the WEPSE in Qingpu District of Shanghai in 2023
Table 5 Classification criteria and grades of the WEPSE values in Qingpu District
Grade Criteria WEPSE WEPSE inner ring WEPSE middle ring WEPSE outer ring
Quantity Area (ha) Quantity Area (ha) Quantity Area (ha) Quantity Area (ha)
First class [0.895, 1.000] 28 8981.56 13 4170.01 6 1737.36 9 3074.19
Second class [0.751, 0.895) 46 13319.76 22 7458.68 7 2456.93 17 3404.15
Third class [0.613, 0.751) 57 20006.43 27 8660.79 10 3089.90 20 8255.74
Fourth class [0.497, 0.613) 36 12419.64 14 4053.84 8 2316.48 14 6049.32
Fifth class [0.349, 0.497) 17 12124.61 7 2280.35 5 1447.80 5 8396.46

3.2.2 Spatial differentiation of WEPSE

The Dagum Gini coefficient and decomposition method were used to measure the regional differences and contribution rates of the WEPSE in Qingpu District, and the results are shown in Table 6. In 2023, the overall difference of the WEPSE in Qingpu District was 0.195, among which the interregional contribution rate (49.205%) was greater than the intraregional contribution rate (26.869%) and the S.V.D contribution rate (23.926%). The results showed that the main reasons for the spatial differentiation of the WEPSE in Qingpu District were related to regional heterogeneity. 1) In terms of the type difference and contribution dimension, the values were in the order of CS (0.215)>PS (0.203)>RS (0.182). Among them, the value of the WSP had the largest difference (0.225), and the rate of interregional contribution was 37.323%. The value of the FRS difference was the smallest (0.162), and the rate of interregional contribution was 39.191%. 2) In terms of the intraregional difference and contribution dimension, the mean value of the intraregional WEPSE difference was 0.153, with the values ranking as outer ring (0.218)>inner ring (0.167)>middle ring (0.075). Among them, the value of the PS difference in the middle ring was the smallest (0.065), and the rate of interregional contribution was 48.582%. The value of the CS difference of the outer ring was the largest (0.268), and the rate of interregional contribution was 37.952%. The possible reasons for the difference in the spatial distribution of WEPSE were as follows. 1) The economic location of Qingpu District is different, the social and economic development status is heterogeneous, and the natural endowment is different. When improving the water ecological supply efficiency, the allocation of input factors such as human, material and financial resources, and the supply level of various types of water ecological products such as material products, adjustment services, and cultural services, are significantly different. 2) Many departments have been involved in the protection and restoration of water ecological environment, and each department pays too much attention to local or departmental interests. The lack of cross-sectoral and cross- regional coordination mechanisms has resulted in higher costs of interregional communication and collaboration. Therefore, the cooperation of various regions in Qingpu District should be strengthened to promote the continuous improvement of the supply efficiency of water ecological products in this area.
Table 6 Gini coefficient and its decomposition of the WEPSE in Qingpu District of Shanghai in 2023
Type Overall
difference
Intraregional differences Interregional differences Contribution rate (%)
Inner ring Middle ring Outer ring Inner-mid ring Mid-outer ring Inner-outer ring Intra Inter S.V.D
WEPSE 0.195 0.167 0.075 0.218 0.184 0.243 0.215 26.869 49.205 23.926
PS 0.203 0.197 0.065 0.217 0.237 0.251 0.182 27.291 48.582 24.127
WSP 0.225 0.236 0.077 0.248 0.219 0.291 0.201 29.602 37.323 33.075
FWP 0.192 0.213 0.054 0.205 0.216 0.247 0.158 29.019 45.351 25.630
HGP 0.205 0.197 0.065 0.208 0.254 0.223 0.195 25.919 46.015 28.066
IWT 0.191 0.143 0.065 0.207 0.259 0.241 0.173 24.625 37.637 37.738
RS 0.182 0.155 0.082 0.181 0.156 0.236 0.231 25.433 40.673 33.894
WPP 0.182 0.163 0.064 0.215 0.206 0.237 0.168 27.449 47.671 24.880
SWS 0.185 0.157 0.115 0.158 0.164 0.223 0.245 24.629 34.425 40.946
GWS 0.185 0.156 0.117 0.158 0.169 0.231 0.251 24.632 45.433 29.935
FRS 0.162 0.133 0.044 0.185 0.106 0.217 0.228 25.909 39.191 34.900
GRS 0.195 0.167 0.072 0.188 0.134 0.273 0.265 24.545 42.645 32.810
CS/TRP 0.215 0.177 0.125 0.268 0.164 0.273 0.255 29.409 37.925 32.666

Note: The S.V.D represents super variable density, which refers to the sensitivity of the Gini coefficient over time.

3.2.3 Spatial agglomeration of WEPSE

To ensure the validity of the GWR model results, it is necessary to analyze the spatial correlation of WEPSE. In this study, GeoDa software was used to calculate the spatial correlation of the WEPSE in each administrative village of Qingpu District in 2023, and the following results were obtained. The Moran’s I index was 0.45, and the value of Z(I) was 5.11, which was higher than the critical value of 1.96, so it passed the test at the 5% significance level. The results indicated that WEPSE did not show a completely random state, but there was a significant spatial correlation, and villages with similar WEPSE values were relatively concentrated.
To further study the spatial correlation of WEPSE values in the administrative villages of Qingpu District and intuitively understand the spatial distribution pattern, the LISA significance distribution map was drawn (Figure 2). There were four types of WEPSE in the administrative village of this area: high and high agglomeration (HH), low and low agglomeration (LL), high and low discretization (HL), low and high discretization (LH). Among them, the HH and LL areas were mainly distributed in Jinze and Liantang in the west and Xujing in the east. In those cases, the WEPSE values of the two areas were higher (or lower), the degree of spatial difference was small, and there was a positive spatial correlation. The HL and LH areas were mainly distributed in Baihe in the northeast and Zhaoxiang in the southeast. The WEPSE values of these two areas were higher (or lower), but the landscape ecological quality index of the surrounding area was lower (or higher). The degree of spatial difference was small, and there was a spatial negative correlation. These results lay a feasible foundation for the construction of a GWR model.
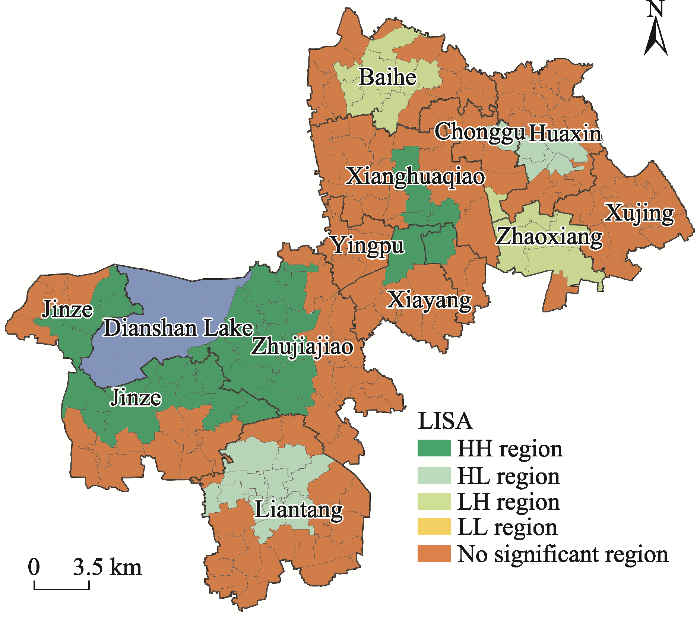
Figure 2 Spatial agglomeration of the WEPSE in Qingpu District of Shanghai in 2023

3.3 Results of the factors influencing WEPSE

The estimated coefficient of the GWR model can better reveal the complex relationship between WEPSE and various influencing factors, and it can also reflect the spatial variation of the influence of each influencing factor on WEPSE with the change of region. To reveal the relationships between specific regions, we used the spatial pattern visualization characteristics of the GWR model parameter estimation to graphically process the regression coefficients of the influencing factors affecting WEPSE (Figure 3 and Table 7).
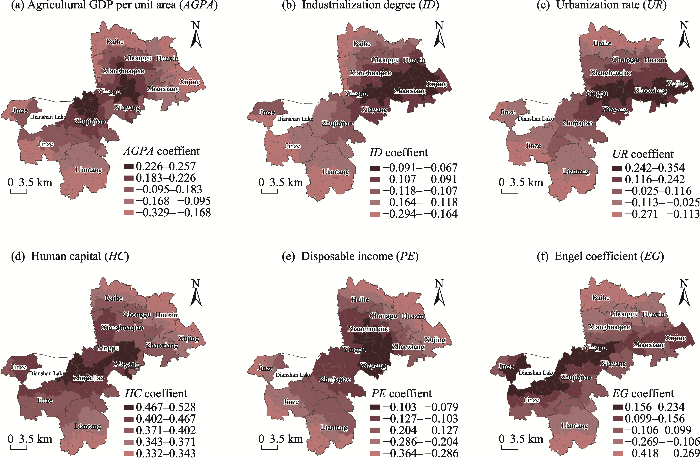
Figure 3 Spatial distribution of regression coefficients of the affecting factors in the GWR model
Table 7 Estimation results of the GWR model
Independent variable Regression coefficient t value Min Lower quartile Mid Upper quartile Max P
AGPA 0.219*** 2.338 -0.329 -0.107 0.089 0.192 0.257 0.001
ID -0.183** -0.465 -0.294 -0.165 -0.099 -0.084 -0.067 0.005
UR 0.315*** 0.664 -0.271 -0.139 0.109 0.268 0.354 0.001
HC 0.411*** 6.398 0.332 0.388 0.396 0.486 0.528 0.001
PE -0.245* 4.257 -0.364 -0.257 -0.129 -0.101 -0.079 0.010
EG 0.206** 6.251 -0.418 -0.331 -0.118 0.109 0.234 0.005
PD 0.512 5.559 0.252 0.294 0.309 0.457 0.664 0.051
PR 0.708 3.241 0.556 0.598 0.608 0.611 0.821 0.099
AL 0.811 2.687 0.448 0.565 0.599 0.648 0.872 0.062
Constant 0.155 21.568 -0.758 -0.568 -0.335 0.624 0.709 0.000

Note: *, ** and *** indicate significance at the levels of 10%, 5% and 1%, respectively.

(1) Agricultural GDP per unit area. The WEPSE was positively correlated with AGPA. This factor had a significant effect on WEPSE, and WEPSE will increase by 0.219 for every one standard unit of increase in its logarithm. In the spatial distribution of the regression coefficient, the area showed a gradual decline from east to west, in which the eastern high-value area appears as a ‘saddle-shaped’ distribution, the maximum values appeared in Tianyi Village of Xianghuaqiao and Lujiazui Village of Xujing, and the minimum value appeared in Nanxin Village of Jinze (Figure 3a). This distribution was consistent with the actual situation in Qingpu District. As the main area for the development of Qingpu New Town, Xianghuaqiao had been citizenized by farmers, and the proportion of material product supply and cultural service supply was relatively large. Xujing was closed to the central business district of Shanghai, and it has actively accepted the radiation of the central urban area of Shanghai. It undertook the functions of population import and industrial spillover, resulting in the rapid appreciation of regulatory services. However, the urban traditional agricultural area in the eastern part of the district had more capital than expected in the composition of livelihood capital but was relatively lacking in financial capital, resulting in a smaller WEPSE.
(2) Industrialization degree. The ID was negatively correlated with WEPSE. This factor had a significant effect on WEPSE, and for every one standard unit of increase in its logarithm, the WEPSE will decrease by 0.183. The regression coefficient of ID declined obviously from the east to the west, and there was also a decreasing trend from the high-value area to the surrounding area (Figure 3b). The results showed that although government subsidies for agricultural development and infrastructure construction are strong in metropolitan villages, their impact on WEPSE was still insufficient compared to the contribution of industrial development.
(3) Urbanization rate. The UR was positively correlated with WEPSE, but the regression coefficient showed a transition from negative to positive. For every one unit of increase in this index, WEPSE increased by 0.315 (Figure 3c). The high-value center of the regression coefficient was located on the transverse axis of ‘Yingpu-Zhaoxiang-Xujing’, and the regression coefficient value was [0.116,0.354]. On the one hand, this axis is close to the center of the area and Shanghai is an economic activity-intensive area with good traffic location advantages and strong accessibility. The cutting effect of traffic lines led to the fragmentation of landscape ecosystems, fragile ecological habitats and reduced biodiversity, resulting in a significantly higher input level in this region than in other regions. On the other hand, Xianghuaqiao, Xiayang and Yingpu in the middle are political and economic centers, which are dominated by non- agricultural professional development. Therefore, spatial radiation and location advantages had caused the WEPSE to increase.
(4) Human capital. The HC is positively correlated with WEPSE. This factor had a significant effect on WEPSE. For each additional standard unit of this factor, WEPSE will increase by 0.411. The high-value center of the regression coefficient declined from the middle to the periphery (Figure 3d). On the one hand, with the rapid development of the urban economy and urbanization, the rural surplus labor force moved from the township to the town center, resulting in an increase in population density in the district center and the town center. The diffusion of construction land to surrounding villages and towns promoted the transformation of rural areas from homogeneous space to diversified space, and the transformation of livelihood capital types from agricultural to non-agricultural. However, the rapid losses of natural capital, productive material capital and human capital, coupled with excessive population inflows, had reduced the total amount of livelihood capital in the region. Therefore, in the future, this region should balance the development of various industries, increase subsidies for agriculture in the west, raise the entry threshold for industry in the central and eastern regions, appropriately limit excessive population movements, and achieve a balanced livelihood capital structure to enhance its WEPSE. On the other hand, the strong pull of the urban economy attracted rural factors to move closer to the city, changing the direction of the rural economy, and then changing the total amount and structure of farmer livelihood capital. The change in the consumption structure forced farmers to influence the final effect of water ecological product supply through continuous learning.
(5) Disposable income. The PE is negatively correlated with WEPSE. This factor had a significant effect on WEPSE, and for every one standard unit of increase in its logarithm, WEPSE will decrease by 0.245. The regression coefficient of PE has a high-value area in space (Figure 3e) and tends to decrease around Xiayang and Xujing. Of the two Xiayang is the economic center of the area, and its disposable income is the highest in the whole area. Xujing is a commercial service area, with the next lower disposable income. The high-value area was the key area of Qingpu New Town planning. Due to the rigidity of industrial structure and the existence of a ‘lock-in effect’, the construction and demolition in the area were frequent, and many demolition households and unemployed people were generated in the town. Even with the adoption of numerous urban ecological environment maintenance and governance measures, WEPSE was still small under the cumulative causal cycle.
(6) Engel coefficient. The EG is positively correlated with WEPSE. This factor had a significant effect on WEPSE. For each additional standard unit of this indicator, the WEPSE will increase by 0.206. The high-value center of the regression coefficient was in Zhujiajiao and around Dianshan Lake in the southwest (Figure 3f). On the one hand, this area is a famous cultural town in the west. The natural ecological barrier and the better ecological environmental consciousness of residents have led to better landscape ecological quality. At the same time, the cultural and tourism development in this region was prominent, greatly increasing the supply of cultural services. On the other hand, with the rapid increases in urban expansion and construction land, the agricultural land and forestry land were rapidly reduced, and high-intensity disturbances acted on the landscape ecological structure. This resulted in poor stability of the system structure, which ultimately led to a decline in WEPSE. These results were in good agreement with the reality in Qingpu District.

4 Discussion and policy implications

Qingpu District of Shanghai is one of the most economically developed urban suburbs in China. Under the combined action of natural, social and economic factors, the WEPSE of the administrative villages in this region is highly variable. The traditional OLS model estimates the average and global parameter values by the least square method, but it ignores the spatial heterogeneity and instability of the factors influencing WEPSE, which made it difficult to properly explain the variation in WEPSE accuracy in the geographical units. To overcome the instability of spatial data, the GWR model was used to estimate the factors affecting WEPSE in different administrative villages, which allowed local parameter estimation to make the relationship between variables change with the location of administrative villages, and the results were more consistent with objective reality. The results of this study also verified that the GWR model could effectively reveal the spatial nonstationary and spatial dependence of the observer.
One important finding is that the three factors of agricultural labor productivity (AL), population density (PD) and per capita highway mileage (PR) in the estimation results of the GWR model had no significant correlation with the changes in WEPSE in Qingpu District of Shanghai. 1) Agricultural labor productivity was negatively correlated with WEPSE. Although the region has provided subsidies for the development of water ecosystems and carried out infrastructure construction, its impact has been insufficient compared to the contribution of industrial and service development to WEPSE. In the future, this region should promote the development path of ‘technology upgrading, quality improvement and comprehensive development’. 2) Per capita highway mileage was positively correlated with WEPSE. The results show that rural industrialization promotes changes in the regional production mode, intensifies the connections between regions, and strengthens the dependence on transportation. As a medium of functional network construction, the convenience of transportation has a profound impact on changes in WEPSE. In the future, we should continue to increase the construction of infrastructure, especially the traffic network. 3) Population density was negatively correlated with WEPSE. With the rapid development of the urban economy and urbanization, the rural surplus labor force has moved from townships to Qingpu Town and town centers, resulting in a population density increase in the district centers and town centers. The rapid loss of natural capital, productive material capital and human capital, coupled with excessive population inflows, has reduced WEPSE. Therefore, in the future, this region should balance the development of various industries, increase subsidies for agriculture in the west, increase the entry threshold for industry in the central and eastern regions, appropriately limit excessive population movements, and achieve the promotion of WEPSE.
Based on the above findings, this study puts forward the following suggestions to further promote WEPSE in Qingpu District of Shanghai and promote the protection of the water ecological environment in the Yangtze River Economic Belt.
(1) Promote the construction of a water-saving society, strengthen the protection of water resources, and improve the utilization efficiency and benefit of water resources. First, adhere to the priority of water conservation, actively promote the establishment of water-saving production and lifestyles, and enhance the awareness of water conservation in the whole society. Deepen water price reform, promote water ecological compensation and water rights trading, and promote economical and intensive water use. Second, adhere to the strictest water resource management system, strengthen the rigid constraints of the ‘three red lines’ of water resource management, strengthen the scheduling, distribution, management and monitoring of water resources, and improve the utilization efficiency and efficiency of water resources.
(2) Continuously optimize the industrial structure, strengthen technological innovation, and improve the capabilities of water pollution treatment and water ecological environment restoration. We should adhere to two important points. First, actively adjust the industrial structure. By optimizing the industrial layout and delineating the red line of ecological protection, we will promote the energy-saving and low-carbon transformation of key industries and force industrial transformation and upgrading. Second, continue to promote the application of new technologies such as big data, cloud computing, and artificial intelligence. The continuous improvement of water pollution technology will strengthen the protection and restoration of the water environment, water ecology, water resources, water security and the shoreline.
(3) Actively promote the Yangtze River water culture, highlight local characteristics, and promote the harmonious development of man and nature. First, establish the Yangtze River water culture platform, strengthen water culture research, and promote the construction of the Yangtze River National Cultural Park. Water culture can help with the ecological environmental protection and restoration of the Yangtze River Economic Belt and improve the supply level of water ecological products. Second, adjust measures to local conditions, combine water culture with local history and topography, and highlight regional characteristics. Create a regional tourism brand and enhance the competitiveness of water tourist attractions.

5 Conclusions

Based on the whole process of water ecological product supply, this study has clarified the conceptual connotation of water ecological products and WEPSE. On this basis, two sets of index systems for water ecological product value accounting and WEPSE evaluation were established to calculate the value of water ecological products in Qingpu District of Shanghai in 2023, and to explore its regional differences and influencing factors. The main conclusions were as follows.
(1) WEPSE is characterized by spatial heterogeneity. The range of variation in WEPSE in Qingpu District in 2023 was [0.497,1.000], and it showed a decreasing trend from west to east in the region. WEPSE also showed a decreasing trend from the inner ring to the outer ring.
(2) WEPSE is spatially unbalanced and dependent. In 2023, the overall difference of WEPSE in Qingpu District was 0.195. The interregional contribution rate (49.205%) was greater than the intraregional contribution rate (26.869%) and the S.V.D contribution rate (23.926%), so it was the main contributor to the spatial differentiation of WEPSE in Qingpu District.
(3) The change in WEPSE showed regional differences and sensitivity. The economic factors and social factors were stronger than the livelihood capital factors at driving changes in WEPSE in Qingpu District. The influencing factors positively correlated with WEPSE were HC, UR, AGPA and EG in sequence. The influencing factors negatively correlated with WEPSE were PE and ID in sequence.
[1]
Ali A. 2023. Linking forest ecosystem processes, functions and services under integrative social-ecological research agenda: Current knowledge and perspectives. Science of the Total Environment, 892: 164768. DOI: 10.1016/J.SCITOTENV.2023.164768.

[2]
Ali M, Ali J, Mostafa H K. 2024. An analysis of the sensitivity and stability of an uncertain SBM DEA model based on belief degree. Expert Systems with Applications, 255(PD): 124778. DOI: 10.1016/J.ESWA.2024.124778.

[3]
Bao Y S, Cheng L L, Lu Q. 2019. Assessment of desert ecological assets and countermeasures for ecological compensation. Journal of Resources and Ecology, 10(1): 56-62.

DOI

[4]
Bashir M A, Qing L, Raza S Q, et al. 2024. Resources policy from extraction to innovation: The interplay of minerals, geothermal energy technological advancement sand ecological footprint in high-ecological footprint economies. Resources Policy, 95: 105182. DOI: 10.1016/J.RESOURPOL.2024.105182.

[5]
Cheng X, Bian J, He D, et al. 2025. An analysis of agricultural production efficiency of Yellow River Basin based on a three-stage DEA Malmquist model. Humanities and Social Sciences Communications, 12(1): 1343. DOI: 10.1057/S41599-025-05541-0.

[6]
Costanza R, D’arge R, de Groot R, et al. 1997. The value of the world’s ecosystem services and natural capital. Nature, 387: 253-260.

DOI

[7]
Costanza R, de Groot R, Braat L, et al. 2017. Twenty years of ecosystem services: How far have we come and how far do we still need to go? Ecosystem Services, 28: 1-16.

DOI

[8]
Droogers P, Allen R G. 2022. Estimating reference evapotranspiration under inaccurate data conditions. Irrigation and Drainage Systems, 16: 33-45.

DOI

[9]
Edens B, Hein L. 2013. Towards a consistent approach for ecosystem accounting. Ecological Economics, 90: 41-52.

DOI

[10]
Hein L, Bagstad K, Edens B, et al. 2016. Defining ecosystem assets for natural capital accounting. PloS One, 11(11): e0164460. DOI: 10.1371/journal.pone.0164460.

[11]
Keskin B, Zhu J, Yu A. 2025. Performance analysis of sustainable development goals: A multi-component additive network DEA approach. Journal of the Operational Research Society, 76(9): 1749-1764.

DOI

[12]
Ma T, Liu Yi S, Yang M. 2022. Spatial-temporal heterogeneity for commercial building carbon emissions in China: Based the Dagum Gini coefficient. Sustainability, 14(9): 5243. DOI: 10.3390/SU14095243.

[13]
Narita D, Lemenih M, Shimoda Y, et al. 2018. Economic accounting of Ethiopian forests: A natural capital approach. Forest Policy and Economics, 97: 189-200.

DOI

[14]
Obst C, Hein L, Edens B. 2016. National accounting and the valuation of ecosystem assets and their services. Environmental & Resource Economics, 64(1): 1-23.

[15]
Ouyang Z Y, Song C S, Zheng H, et al. 2020. Using gross ecosystem product (GEP) to value nature in decision making. Proceedings of the National Academy of Sciences of USA, 117(25): 1911439. DOI: 10.1073/pnas.1911439117.

[16]
Ren G P, Liu L M, Li H Q, et al. 2022. Pattern optimization for integrated rural land management with an improved entropy weight DEA-TOPSIS model. Journal of Geo-information Science, 24(2): 280-298. (in Chinese)

[17]
Sangha K K, Ahammad R, Russell-Smith J, et al 2024. Payments for ecosystem services opportunities for emerging nature-based solutions: Integrating in digenous perspectives from Australia. Ecosystem Services, 66: 101600. DOI: 10.1016/J.ECOSER.2024.101600.

[18]
Wang C D, Li X, Yu H J, et al. 2019. Tracing the spatial variation and value change of ecosystem services in Yellow River Delta, China. Ecological Indicators, 96: 270-277.

DOI

[19]
Wang K F, Liu P, Sun F S, et al. 2023. Progress in realizing the value of ecological products in China and its practice in Shandong Province. Sustainability, 15(12): 9480. DOI: 10.3390/su15129480.

[20]
Wang Y Q, Hu R W, Zhen W Q. 2025. Study on ecological compensation zoning in the Yellow River Basin based on ecological product value accounting. Acta Ecologica Sinica, 45(11): 5340-5350. (in Chinese)

[21]
Wang Y Y, Atallah S, Shao G F. 2017. Spatially explicit return on investment to private forest conservation for water purification in Indiana, USA. Ecosystem Services, 26: 45-57.

DOI

[22]
Xiao Y, Wen H, Wang S. 2025. Measuring spatial mismatch in education capitalization via the housing market: An empirical study based on geographically weighted regression and Geodetector. Applied Geography, 182: 103716. DOI: 10.1016/J.APGEOG.2025.103716.

[23]
Xie H L, Ouyang Z Y. 2025. Mechanisms and modes of ecological product value realization: An analysis based on social-ecological system framework. China Population, Resources and Environment, 35(1): 170-179. (in Chinese)

[24]
Yang D, Liu W, Tang L, et al. 2019. Estimation of water provision service for monsoon catchments of South China: Applicability of the InVEST model. Landscape and Urban Planning, 182: 133-143.

DOI

[25]
Yang Q, Qian H, Gao Y, et al. 2025. Spatio-temporal evolution and driving mechanism of ecosystem services in typical hilly and gully areas of the loess Plateau: A case study in Yan’an Region, Shaanxi Province. Ecological Indicators, 177: 113773. DOI: 10.1016/J.ECOLIND.2025.113773.

[26]
Zadehdabagh N, Monavari S M, Kargari N, et al. 2022. Sustainability of agroecosystems by indices: A comparative study between indicators of ecological footprint sustainability and energy analysis, a case study in Dez Catchment, Iran. Ecological Modelling, 474: 110165. DOI: 10.1016/j.ecolmodel.2022.110165.

[27]
Zhang H P, Liu S. 2024. Exploring the spatial-temporal patterns of urban ecosystem service relationships and their driving mechanisms: A case study of Wuhu City, China. Ecological Indicators, 167: 112726. DOI: 10.1016/J.ECOLIND.2024.112726.

[28]
Zhang J L, Li Z G, Zhang D, et al. 2024. An evaluation framework for urban ecological compensation priority in China based on meta-analysis and fuzzy comprehensive evaluation. Ecological Indicators, 158: 111284. DOI: 10.1016/J.ECOLIND.2023.111284.

[29]
Zhang R Q, Li P H, Xu L P, et al. 2022a. An integrated accounting system of quantity, quality and value for assessing cultivated land resource assets: A case study in Xinjiang, China. Global Ecology and Conservation, 36: e02115. DOI: 10.1016/j.gecco.2022.e02115.

[30]
Zhang T J, Zhang S Q, Cao Q, et al. 2022b. The spatiotemporal dynamics of ecosystem services bundles and the social economic-ecological drivers in the Yellow River Delta region. Ecological Indicators, 135: 108573. DOI: 10.1016/J.ECOLIND.2022.108573.

[31]
Zhang W S, Li H P, Kendall A D, et al. 2019. Nitrogen transport and retention in a headwater catchment with dense distributions of lowland ponds. Science of the Total Environment, 683: 37-48.

DOI

[32]
Zhou H, Yuan J, Zhao Y, et al. 2025. Geospatial variations in the influence of urban environmental attributes on positive emotions. International Journal of Environmental Research, 19(5): 196. DOI: 10.1007/S41742-025-00835-2.

Outlines

/