Agricultural Ecosystem

Management for Improved Soil Quality, Tree Diversity and Building Resilience in Panchase Protected Forest, Gandaki Province, Nepal

  • Shakti GURUNG , 1 ,
  • Krishna Prasad POUDEL 2 ,
  • WU Yanhong 3 ,
  • Udhab Raj KHADKA , 1, *
Expand
  • 1. Central Department of Environment Science, Tribhuvan University, Kathmandu 44600, Nepal
  • 2. Central Department of Education, Tribhuvan University, Kathmandu 44600, Nepal
  • 3. Institute of Mountain Hazard and Environment, Chinese Academy of Sciences, Chengdu 610299, China
* Udhab Raj KHADKA, E-mail:

Shakti GURUNG, E-mail:

Received date: 2025-05-04

  Accepted date: 2025-12-06

  Online published: 2026-02-02

Supported by

The Faculty Research Grant Tribhuvan University(TU-NPAR-078/79-ERG-02)

Abstract

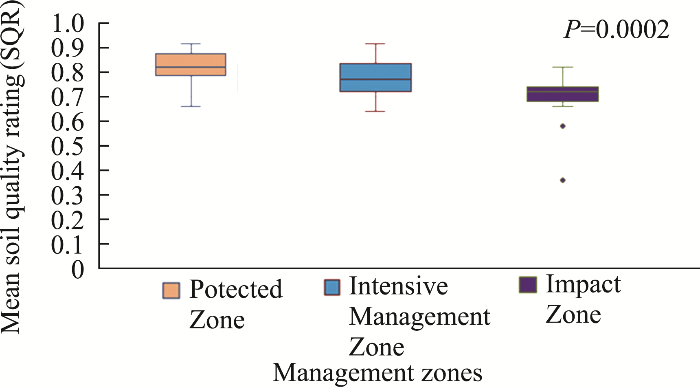
Forest ecosystem enhances environmental resilience by maintaining ecosystem stability and supporting natural processes. In Nepal, the rising temperature has exerted immense pressure on people’s livelihoods and ecosystems. In a forest, soil characteristics and tree diversity are the key components that enhance its resilience in response to various disturbances such as drought, fire, erosion, and landslides. However, the role of forest management in improving soil quality, fostering tree diversity, and building resilience is less investigated in Nepal. The present study aims to assess the role of forest management in soil quality, tree diversity, and building resilience. For this purpose, the soil quality was determined and soil quality rating (SQR) was computed across three management zones of the Panchase protected forest, using a semi-quantitative equation model. The observed tree richness was obtained from transect walk and tree counts around soil sample points. The community resilience adjoining the forest was assessed through participatory approach employing a scoring method. The results showed that SQR was higher in the Protected Zone (0.82) followed by the Intensive Management Zone (0.77) and the Impact Zone (0.69). The highly significant differences in SQR among the three management zones (P<0.001) and the highly significant difference in mean SQR between the Protected Zone and the Impact Zone (P<0.001) highlighted the role of forest management in fostering soil quality. The Protected Zone exhibited higher tree richness compared to the Intensive Management and the Impact Zones, suggesting the need for soil quality enhancement through management measures that also promote tree diversity. Furthermore, the community residing near the forest, which encompasses larger forest area demonstrated higher resilience score of 3.94 than the community residing relatively far, scoring 3.53. This suggests the contribution of forest ecosystem in building community resilience and recommends to strengthen agricultural diversity, agriculture innovation, and biodiversity-based livelihoods in community with low resilience score.

Cite this article

Shakti GURUNG , Krishna Prasad POUDEL , WU Yanhong , Udhab Raj KHADKA . Management for Improved Soil Quality, Tree Diversity and Building Resilience in Panchase Protected Forest, Gandaki Province, Nepal[J]. Journal of Resources and Ecology, 2026 , 17(1) : 322 -334 . DOI: 10.5814/j.issn.1674-764x.2026.01.025

1 Introduction

The global climate change phenomenon in recent decades has led to adverse ecological and socio-economic impacts. As ecosystems and communities are interdependent, socio- economic capability heavily relies on health and integrity of the natural systems (UNDP, 2022). The increasing climatic extremes are seen as a prevalent and growing concern for biodiversity loss and ecosystem damage (Diaz et al., 2019). For instance, ecosystem degradation, faunal loss, and habitat fragmentation significantly impact ecosystem health (Malhi et al., 2020). The existing trend of species loss has resulted in alteration of ecosystem structure and function in many parts of the world (Pecl et al., 2017). These influences may reduce the capacity of the ecological systems to fight and build back from the disturbances which is considered as the ecological resilience (Hodgson et al., 2015). As ecosystems and communities are inter-dependent, building ecosystem resilience in the existing environmental challenges must be the key conservation priority in order to enhance community resilience.
With regard to terrestrial natural systems, forests are the key component to stabilizing the climate and reducing the impacts of climate change (IUCN, 2021). Forests are vital in supporting community resilience, mainly in areas that are highly dependent on natural resources. Forests safeguard communities, providing safety nets to disasters like cyclones, landslides, and avalanches (FAO, 2019). In the context of existing environmental challenges, it is crucial to strengthen forests’ capacity to provide diverse services like carbon sequestration, habitat support, and sustainable livelihoods to foster social and ecological resilience (Cantarello et al., 2024). However, the 21st century forests are under pressure due to climate extremes, which is further intensified by anthropogenic disturbances like environmental pollution (Millar and Stephenson, 2015). In view of the existing changed climate phenomena and increased extreme events, forests face challenges in continuing their vital functions and sustaining biological diversity (Singh, 2024). In recent decades, undisturbed and non-fragmented natural forests as well as people-managed forests have faced a change in their capacity to withstand climate-induced disturbances (Forzieri et al., 2022). Thus, forest resilience is one of the key response strategies to tackle the uncertainty caused by global change (Nikinmaa et al., 2020).
The contribution of forests towards resilient livelihoods greatly depends on their management (FAO, 2019). For sustainable management of the forests, it demands effective and well-adjusted remedies to foster people’s prosperity and forest conservation engaging the local communities (Haji et al., 2021). Reducing deforestation has been considered the best possible conservation option to mitigating climate change (IPCC, 2019). In forest ecosystems, managing the soil quality is vital to forest growth and its continuous services. Unsustainable harvesting and improper preparation of plantation sites in forests affect soil quality substantially (Page-Dumroese et al., 2021). Human-induced soil erosion and landslides are the key factors that degrade the forest soil quality. Practices used for the conservation of forests have a major influence on nutrient availability in the soil (Kumi et al., 2021). Forest harvesting often decreases litter content reducing the soil carbon, while sustainable management practices like native species plantation, preparing suitable plantation sites, and managing forest fires can significantly contribute to carbon sequestration (Lal, 2005; Qian et al., 2024). Afforestation of diverse species promotes sustainable nutrient cycling and balancing soil nutrients (Jandl et al., 2007). Agroforestry practices with Pectona grandis, Acacia nilotica, and Delbergia sissoo help enhance soil quality (Rijal, 2020). The biomass removal and post-harvest practices in the forests impact the plant diversity (Battle et al., 2001).
Assessing forest soil quality and tree diversity in relation to forest management practices is important for effective conservation measures and fostering socio-ecological resilience. Globally, only few studies have been carried out on the quantitative assessment of ecosystem resilience considering its influencing factors (Yan et al., 2011). Study conducted in differently managed peri-urban forests of Indian Himalayan hills highlights need for the targeted forest management measures to enhance soil health and continue ecosystem service (Rana et al., 2025). In Nepal, afforestation and agroforestry with community engagement are among the major forest management practices. Some study has been conducted in differently managed tropical forests in Nepal. Neupane et al. (2024) recommends specific management interventions to improve soil organic carbon in leasehold forests, religious forests, and community forests in Mahottari District. Nepal’s mountain forests being an important biological hotspot, the consideration of the context-specific approaches of forest management by assessing soil quality and tree diversity seems gap. The concept of forest management in enriching soil quality, tree diversity, and their linkage in building community resilience still lacks adequate scientific investigation and discussion.
The present study aims to fulfill the research gap measuring soil quality rating (SQR) and tree richness for diversity in the three management zones within the Panchase protected forest, a mountain forest of Nepal. The soil quality rating (SQR) model is a semi-quantitative, adaptable, and context specific model that integrates soil physicochemical properties to classify the soil class. Relevant across different land use types such as forests, rangelands, and agriculture land, the SQR model has been applied in various national and international soil quality researches (Bajracharya et al., 2007; Yazdanshenas et al., 2015; Feleke et al., 2019; Thapa et al., 2019; Herniyanti et al., 2023; Yeneneh et al., 2024). Extended within the range of 900 m to 2800 m, the Panchase protected forest reveals landscape heterogeneity as it constitutes three management zones, and varying community interactions, which impacts soil quality, tree diversity and overall forest resilience. Furthermore, the study intends to evaluate the community resilience adjoining the forest at varying distances by understanding an ecological and social aspects integrating in elements of resilience (UNU-IAS, 2013). WWF (2015) reports varying levels of resilience among the communities having different levels of natural resource base along the Seti River basin. For the study, we hypothesized that soil quality and observed tree richness significantly decreases from protected to impact zones. Furthermore, communities lying close to intact forests reveals significantly higher resilience scores.

2 Materials and methods

2.1 Study area

The Panchase Forest is one of the protected forests at the intersection of the Kaski, Parbat, and Syangja districts of Gandaki Province, Nepal. It is located between 28°10'55”N to 28°15'56”N and 83°48'03”E to 83°49'53”E, covering an area of 5775.73 ha and the forest was declared a protected forest in 2012. It ranges from 900 m to 2800 m in elevation with moderate to steep topography having a 30° to 90° slope (MoFSC, 2017). It is renowned for its cultural and aesthetic values featuring the holy Panchase Lake at its central peak, a popular eco-tourism destination, which is considered as a biological passage between Chitwan National Park and Annapurna Conservation Area. Climatically, the forest lies in sub-tropical to temperate zones with average annual rainfall above 2400 mm (Climate Hazards Group Infra-Red precipitation data of 2000-2020) and an average annual temperature of 14.32 ℃ (temperature data of 1979-2020) with slightly increasing trend. The forest’s varied topography and climatic zones are represented by its enriched biological diversity and ecological services. The protected forest provides various ecosystem services to its adjoining communities and regulates the microclimate. It delivers numerous environmental benefits locally and globally through carbon sequestration and habitat services. The forest helps regulate the water flow, prevents soil loss from erosion, and helps enhance soil and water quality. The 35 plant species from the forest are reported to be used as food; 40 species as traditional medicines; 16 species as timber; and 17 tree species as fuel wood (Bhandari et al., 2018). Furthermore, the Panchase forest provides habitat to 113 orchid species with 2 species endemics to Nepal, 107 herb species, 56 mushrooms, and 98 ferns (DoF, 2012). The forest is rich in amenity services, providing recreational space, tourism, and educational opportunities to researchers and students at national and international levels. Moreover, the Panchase forest is the major source of water for irrigation and household use in its adjoining communities. It is the main source of local watersheds like the Harpan River, which flows down to the Phewa Lake, one of the ecologically and economically important Ramsar sites in the Pokhara Valley.
For conservation purposes, the forest is divided into three management zones; Protected Zone, Intensive Management Zone, and Impact Zone (DoF, 2012) (Figure 1). The inner undisturbed Protected Zone (core area) covers 2035.13 ha and is specifically managed for the sustainable conservation of its biological diversity and forest resources. Similarly, the Intensive Management Zone (fringe area) covers 3740.60 ha lying outside the Protected Zone, which is extended to the existing human settlements, exposing it to moderate an thropogenic disturbances. The forests in this zone have been handed over to the local communities as ‘community forests’ for biodiversity conservation and sustainable forest management practice, which includes 108 community forests (MoFSC, 2017). The Impact Zone primarily consists of human settlements, rural roads, and some private and community forests. The forests in this zone are exposed to various anthropogenic influences due to day-to-day human interference for forest services and haphazard rural road construction activities. This zone also consists of plantation forests, most of which are monoculture forests of Pinus roxburghii, which is reported to be fire-prone. The Panchase Protected Forest Management Plan of 2012 and 2016 (DoF, 2012; DFO, 2016) have listed 49 tree species from the Panchase forest. After the implementation of the 5-year Panchase Protection Forest Management Plan of 2012, the 10-year Panchase Protected Forest Management Plan of 2016 has been formulated and implemented (MoFSC, 2017).
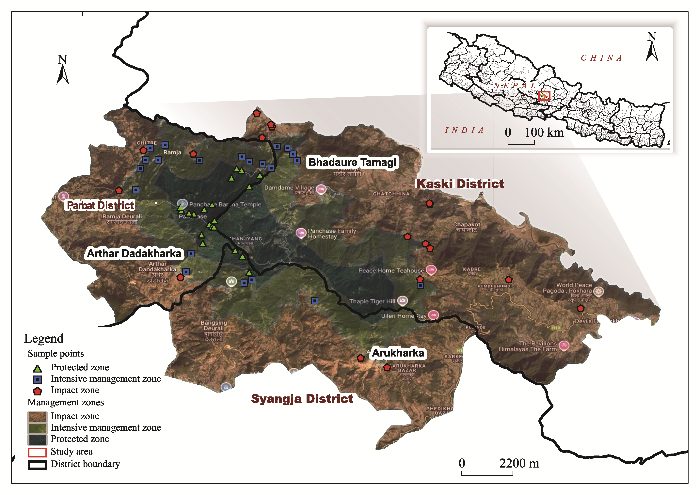
Figure 1 Panchase protected forest with three management zones and sample points
Despite its high species diversity and forest services, the Panchase protected forest is facing various climatic and non-climatic threats and is exposed to various extreme weather-related phenomena. The local people are experiencing a rise in temperature, prolonged dry winter days, and erratic rainfall during the monsoon season. Landslides and soil erosion are the major hazards identified in the Panchase protected forest area, which is further increased due to anthropogenic activities like haphazard road construction. The forest is exposed to soil erosion hazards in monsoon seasons, especially along the roadside areas due to a lack of proper drainage systems and mitigation measures. According to Budha et al. (2020), the greatest landslide hazards occur in areas receiving average annual rainfall >4000 mm and having elevation between 1000 m and 1500 m, and slopes steeper than 30°. The south-facing forests and areas near streams and roads are more prone to landslides. The uncontrolled open grazing observed around the Intensive Management Zone may result in forest degradation in future due to the browsing of saplings by livestock. In addition, the increasing population of Daphniphyllum himalayense observed in the Panchase protected forest also reveals the necessity of conservation measures for managing biodiversity and ecosystem balance. Moreover, forest encroachment requires special attention to control future forest land cover change (DoF, 2012).
The adjoining communities in the Impact Zone belong to three districts; Kaski, Parbat, and Syangja. In order to assess the community resilience, one community in each district was considered. The community lying relatively close to the forest (here Bhadaure Tamagi) represents Kaski District, which also encompasses a larger portion of the Panchase forest comprising 44 community forests. This community reveals better road networks, physical infrastructures, functional homestays, and other tourism activities. Likewise, another nearby community (here Arther) represents Parbat District and this portion of the Panchase forest consists of 35 community forests. Similarly, the community lying relatively far from the Panchase forest (here Arukharka) represents Syangja District, comprising 29 community forests. This community has an underdeveloped road network connection in some areas, which might limit people’s access to the essential services, market facilities, and emergency assistance.

2.2 Methods

The data were collected using primary and secondary methods. Soil analysis, key informant interviews, stakeholder consultations, and transect walks across the forests were carried out for gathering the primary data. For the soil quality, physical parameters (texture and bulk density) and chemical parameters (pH, organic matter, organic carbon, total nitrogen, available phosphorus, and available potassium) were analyzed. The soil quality rating (SQR) was computed using the parameters; texture, pH, soil organic carbon (SOC), total nitrogen (TN), available phosphorus (AP), and available potassium (AK). The soil parameters ranking values were used for the computation of SQR applying semi-quantitative equation model suggested by Bajrcharya et al. (2007). The tree species diversity was obtained from the transect walk and tree species list around sample points, which was validated with the Panchase Protected Forest Management Plan 2012 and 2016 (DoF, 2012; DFO, 2016). For community resilience, the four elements of resilience, i.e., ecosystem protection and biodiversity maintenance; agriculture diversity; knowledge, learning, and innovation; and social equity, infrastructure, and livelihoods were analyzed (UNU-IAS, 2013; UNU-IAS, 2014). These indicators have been used in Yanuo Village, Southwest China (Yang et al., 2020) and also tested in the Begnas landscape, Gandaki Province, Nepal (Bergamini et al., 2013) for socio-ecological resilience assessments.

2.2.1 Soil sampling

In total, 61 bulk soil samples at 0-20 cm depth were collected using a non-corrosive metal corer and soil samples from the same depth were collected for physico-chemical analysis. A simple random sampling method was used to collect samples from three management zones respectively; Protected Zone (22 samples), Intensive Management Zone (24 samples), and Impact Zone (15 samples), based on the forest coverage. The samples were collected across different elevation gradients and aspects of the forest. The three management zones were covered from three district sections (Kaski, Parbat and Syangja). Inaccessible steep areas and densely forested high-risk places were excluded. However, the comparable alternate sites were selected to mitigate potential bias with assumption that there will be no significant difference in the result. The spatial distribution of each soil sample pit was tracked with a global positioning system (GPS) with easting and northing geographical coordinate systems. The soil samples were stored in an airtight zip-lock bag, air-dried for 2-3 days, and stored for further analysis at the Central Department of Environment Science, Tribhuvan University, Kathmandu, Nepal.

2.2.2 Soil characteristics

The physical parameters (texture and bulk density) and chemical parameters (pH, organic matter, soil organic carbon, nitrogen, phosphorus, and potassium) were determined. The soil texture was analyzed using the Buoyoucos Hydrometer method (Gee and Bauder, 1986) with a hydrometer of model 55 mN/m 68/68°F ASTM 152 H. The bulk density (BD) was determined by oven drying method drying the soil in a hot-air oven for 24 hours at 105 ℃ (Blake and Hartge, 1986). For soil chemical parameters, pH was determined using dilution method at the 1:5 soil: water ratio using a glass electrode pH meter (McLean, 1982) of model Milwaukee pH 55 PRO calibrated at pH 7 and pH 4 buffer. The organic matter (OM) was determined by titration method (Walkley and Black, 1934). The soil organic carbon (SOC) was determined from the organic matter (OM) adapting the conversion factor (1.724) based on the assumption that organic matter in soil comprises 58 percent of carbon (Kerven et al., 2000). Similarly, the total nitrogen (TN) was determined by Kjeldahl digestion distillation method (Bremner and Mulvaney, 1982). The available phosphorus (AP) was determined using Modified Olsen’s bicarbonate method (Olsen and Sommers 1982). Likewise, available potassium (AK) was determined using a microprocessor-based flame photometer (Thomas, 1982) of model 1382/1385. These methods are used in the various soil quality researches and adopted by Nepal Government in its Manual for Soil and Fertilizer Analysis (MoALMC, 2017). The average soil parameters across the three management zones were calculated and compared. The Principal Component Analysis (PCA) was conducted in R studio to assess the variation in soil characteristics among the three management zones.

2.2.3 Soil quality

The soil quality rating (SQR) of the three management zones was computed using soil quality parameters’ fertility ranking values. For this purpose, the soil parameters: soil texture, pH, soil organic carbon (SOC), total nitrogen (TN), available phosphorus, (AP), and available potassium (AK) were used. The SQR of each sample was calculated using a semi-quantitative equation (Bajracharya et al., 2007) (Equation 1).
$SQR=a\times RSTC+b\times RpH+c\times RSOC+d\times RNPK$
where, RSTC is the ranking value for soil texture; RpH is the ranking value for pH; RSOC is the ranking for soil organic carbon; RNPK is the ranking for total nitrogen, available phosphorus, and available potassium. Similarly, a, b, c, and d are assigned weighting values for RSTC, RpH, RSOC, and RNPK, where a=0.2, b=0.1, c=0.4, and d=0.3.
The ranking values, weighting values (a-d) and soil quality classification were used as suggested by Bajracharya et al. (2007). The sensitivity analysis of weighting values of the soil parameters was performed in R studio keeping the assigned weights as a baseline. The analysis revealed SOC highly sensitive to SQR and soil class, the slight changes in the weighting value resulted significant difference in the SQR. Similarly, the STC revealed moderate sensitivity to SQR and pH revealed low sensitivity. Furthermore, the NPK showed very low sensitivity to SQR in the study samples, however the weighting value were assigned 0.3 as NPK together represents soil fertility. Therefore, the parameters assigned weighting values (a-d) were found relevant that integrated both expert judgement and theoretical importance. The soil quality was classified as “very poor” (0.20-0.39), “poor” (0.40-0.59), “fair” (0.60-0.79), “good” (0.80-0.99), and “best” (1.0) class based on the SQR values. After computation of the SQR, the statistical significance was tested using one-way ANOVA at 5% level of significance (α=0.05) for the comparative study of SQR among three management zones of Panchase protected forest. The SQR across the three management zones was presented using a box plot. The one-way ANOVA analysis was followed by the Tukey Honest Significance Difference (HSD) post-hoc test at 5% level of significance (α=0.05) for the multiple comparison of the mean SQR among the three management zones using R studio. The SQR across the three management zones were spatially visualized for comparison.

2.2.4 Resiliency

In order to assess ecosystem resilience, the soil parameters, SQR and tree diversity across the three management zones were considered. The tree diversity was considered as a proxy indicator and measured in terms of observed tree richness. The observed tree richness across the three management zones was obtained from transect walk and tree species count around soil sampling points. The zone-wise tree species were recorded, counted, and triangulated with the tree species list of Panchase Protected Forest Management Plan 2012 and 2016 (DoF, 2012; DFO, 2016). The management zone-wise total number of tree species calculated for observed richness. For community resilience, the adjoining communities lying at varying distances with different socio-economic conditions were scored and quantitatively evaluated using 22 indicator questions in accordance to the indicators of resilience (UNU-IAS, 2013; UNU-IAS, 2014) and expert consultations. The collected information from the interviews with key informants was validated with relevant stakeholder and field observations before subjected to scoring to avoid potential response bias. Each indicator was scored on a 5-point (1–5) scale for the average resilience score comparison. Based on the average score, the resiliency was classified as very high (4.1–5.0), high (3.1–4.0), medium (2.1–3.0), low (1.1–2.0), and very low ($\le 1.0)$ (UNU-IAS, 2014).

3 Results

3.1 Soil characteristics

The average value of the soil quality parameters among the three management zones were compared (Figure 2a-f). In the Panchase protected forest, soil texture was commonly dominated by loamy sand type across the three management zones. In terms of bulk density, the Impact Zone revealed the highest (0.86 g cm-3), followed by the Intensive Management Zone (0.78 g cm-3), and the Protected Zone with lowest bulk density (0.76 g cm-3) (Figure 2a). In terms of physico-chemical parameters, the Panchase protected forest revealed moderately acidic soil (pH<7) (Figure 2b) across all three management zones. Likewise, the Protected Zone revealed significantly higher (4.63%) soil organic carbon (SOC) followed by the Intensive Management Zone (3.99%), and the Impact Zone with lowest organic carbon (3.19%) (Figure 2c). The total nitrogen (TN) was found to be highest (0.22%) in the Protected Zone, followed by the Intensive Management Zone (0.17%), and the Impact Zone (0.12%) (Figure 2d). The forest revealed high available phosphorus (AP) (>55 kg ha-1) (NARC, 1993), with values ranging from 137.74 kg ha-1 to 154.03 kg ha-1. By management regime, the Intensive Management Zone revealed the highest (154.02 kg ha-1) available phosphorus, followed by the Protected Zone (139.38 kg ha-1) and the Impact Zone (137.73 kg ha-1) (Figure 2e). The available potassium (AK) value was found high (>280 kg ha-1) (NARC, 1993) across the three management zones, ranging from 479 kg ha-1 to 646.83 kg ha-1. The highest (646.83 kg ha-1) was found in the Protected Zone, followed by the Intensive Management Zone (620.71 kg ha-1), and the Impact Zone (479 kg ha-1) (Figure 2f).
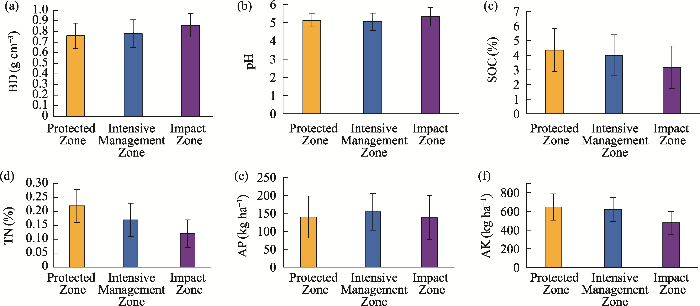
Figure 2 Average soil parameters in the three management zones

Note: a=BD, bulk density; b=pH; c=SOC, soil organic carbon; d=TN, total nitrogen; e=AP, available phosphorus; f=AK, available potassium. Error bars represent ± SD.

The Principal Component Analysis (PCA) of the soil parameters revealed clear variation across the three management zones (Figure 3). The Protected Zone was found to have higher SOC (%), TN (%), and AK (kg ha-1), whereas the Impact Zone was found to be linked to higher BD (g cm-3) and pH. The Intensive Management Zone showed intermediate values, which indicated transitional soil characteristics, suggesting a significant difference in soil parameters due to the forest management measures.
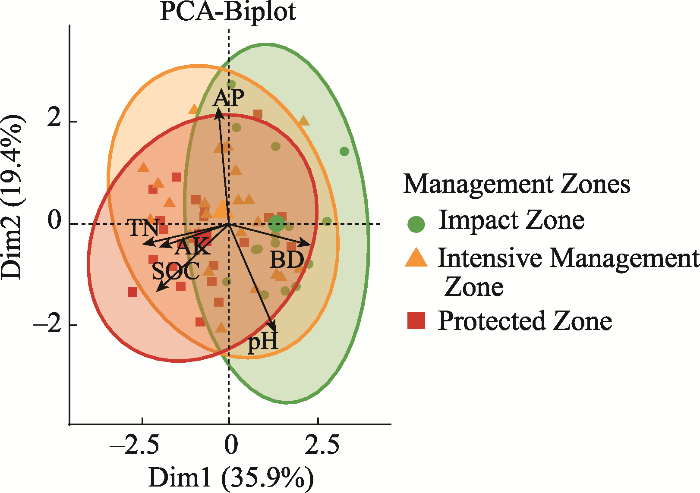
Figure 3 Principal Component Analysis (PCA) biplot of soil parameters with labeled vectors and grouped ellipses in three management zones
The loading scores of the six principal components (Table 1) revealed a positive loading of BD (0.50) on PC1, whereas TN (-0.53), SOC (-0.45), and AK (-0.42) demonstrated negative loadings. This highlighted the distinction between soil compaction and nutrient content captured by PC1. PC2, showed strong positive loading of AP (0.66) and strong negative loading of pH (-0.61), which indicating relationship between soil phosphorus content and acidity. In terms of PC3, BD (0.44), SOC (0.39), AP (0.43), and AK (0.57) showed positive loadings, whereas TN (-0.37) exerted negative loading. These three PCs played major role for causing variation in soil properties, whereas the remaining PCs (PC4 to PC6) accounted for the less variation in soil properties.
Table 1 PCA loading score of six soil parameters
Soil parameters PC1 PC2 PC3 PC4 PC5 PC6
BD (g cm-3) 0.50 -0.12 0.44 0.30 -0.11 -0.67
pH 0.29 -0.61 0.09 -0.62 -0.34 0.17
SOC (%) -0.45 -0.38 0.39 -0.20 0.65 -0.22
TN (%) -0.53 -0.11 -0.37 -0.11 -0.45 -0.60
AP (kg ha-1) -0.07 0.66 0.43 -0.58 -0.13 -0.13
AK (kg ha-1) -0.42 -0.12 0.57 0.37 -0.48 0.33
The principal gradients of soil variation were identified through PCA (Table 2), where PC1 explained 35.90% of total variance. The PC2 accounted for 19.43% of the variance, and PC3 explained 17.87% of the variance. These three principal components together explained 73.21% of the total variance and played major role in the soil variability. In contrast, PC4 to PC6 explained less variance and contributed less in the soil variability.
Table 2 Eigenvalue, percentage variance and cumulative percentage from PCA
Principal components Eigenvalue Variance (%) Cumulative (%)
PC1 2.15 35.90 35.90
PC2 1.17 19.43 55.33
PC3 1.07 17.87 73.21
PC4 0.79 13.15 86.36
PC5 0.44 7.41 93.76
PC6 0.37 6.24 100

3.2 Soil quality

The soil quality rating (SQR) and soil class showed distinct variation among the three management zones (Figure 4). In the Protected Zone, most of SQR values ranged from 0.8-0.99, indicating a “good” soil class. In the Intensive Management Zone, the majority of the SQR values fell within the range of 0.6-0.79, revealing a “fair” soil class, although a few sites revealed SQR values at the range of 0.8-0.99, corresponding to a “good” soil class. In contrast, the Impact Zone revealed most of the SQR values at the range of 0.6-0.79, indicating a “fair” soil class. This zone also had a few sites with SQR values ranging from 0.4-0.59, indicating a “poor” soil class, and a few sites with SQR values ranging from 0.2-0.39, indicating a “very poor” soil class.
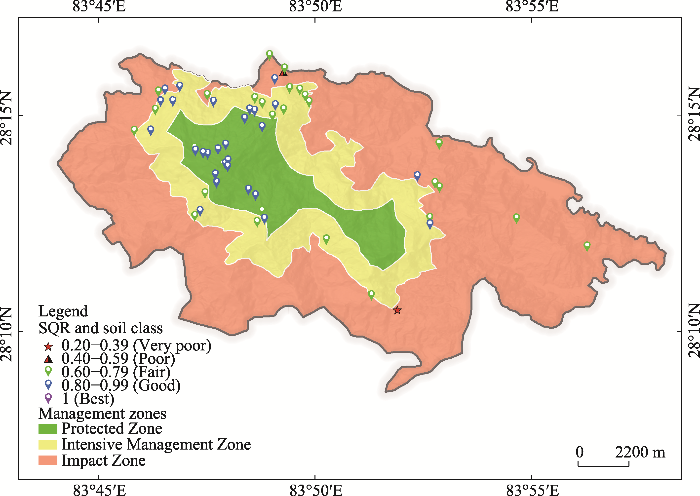
Figure 4 Soil quality rating (SQR) and soil class in three management zones
The one-way ANOVA at a 5% level of significance (α=0.05) revealed a statistically highly significant difference in the mean soil quality rating (SQR) among the three management zones (P<0.001) and as indicated by the higher value of the F-statistic (9.962) compared to the F-critical value (3.156). The highest SQR (0.82) was found in the Protected Zone, followed by the Intensive Management Zone (0.77) and the Impact Zone (0.69) (Figure 5). The results showed that the undisturbed Protected Zone had the “good” soil class, while the moderately exposed Intensive Management Zone and highly exposed Impact Zone fell under the “fair” soil class. The box plot analysis of the Impact Zone revealed two SQR outliers (0.36 and 0.58), which was attributed to low nitrogen and reduced or negligible concentrations of soil organic carbon, particularly from degraded sites near human settlements and rural roads.
Figure 5 Mean soil quality rating (SQR) in three management zones
The Tukey HSD post-hoc analysis at the 5% level of significance (α=0.05) revealed a significant difference in mean SQR among the three management zones. The results revealed a statistically significant difference in mean SQR of the Protected Zone and the Intensive Management Zone compared to the Impact Zone (Table 3). A highly significant difference in SQR was found between the Protected Zone and the Impact Zone (P<0.001, mean difference=0.122) and a significant difference was observed between the Intensive Management Zone and the Impact Zone (P<0.05, mean difference=0.079). Although the results indicated a non-sig- nificant difference in the mean SQR between the Protected Zone and the Intensive Management Zone (P> 0.05, mean difference=0.043), they exhibited ecologically important results. The mean SQR and “good” soil class of the undisturbed Protected Zone compared to the moderately disturbed Intensive Management Zone with a “fair” soil class, indicated the impact of forest litter collections and uncontrolled livestock grazing, in the soil quality conditions.
Table 3 Comparison of mean SQR in three management zones
Management zones Mean difference Lower CI (95%) Upper CI (95%) P-value Significance at α=0.05
Intensive Management zone vs. Impact Zone 0.079 0.014 0.143 0.0133 Significant
Protected Zone vs. Impact Zone 0.122 0.056 0.187 0.0001 Highly significant
Protected Zone vs. Intensive Management Zone 0.043 -0.015 0.101 0.1831 Not significant

3.3 Resiliency

In terms of forest ecosystem resilience, the Protected Zone had relatively higher SOC, TN and AK, and lower BD, indicating better soil quality. The Intensive Management Zone exhibited intermediate levels of SOC and TN but higher AP compared to the other two zones. In contrast, the Impact Zone showed higher BD and relatively lower SOC, TN, AP and AK, resulted poor soil quality. The higher mean SQR of the Protected Zone reflected a “good” soil class. The Intensive Management Zone with mean SQR lower than the Protected Zone but higher than the Impact Zone revealed a “fair” soil class. In contrast, the Impact Zone with lower mean SQR, also fell in a “fair” soil class, but exhibited soil quality degradation. Regarding the tree diversity, 24 tree species were observed in the Protected Zone, 22 tree species in the Intensive Management Zone, and 18 tree species in the Impact Zone (Annex I). The 49 tree species documented in the Panchase Protected Forest Management Plan 2012 and 2016 (DoF, 2012; DFO, 2016) found consistent with the 40 tree species observed across the three management zones. Hence, the Protected Zone showed relatively higher observed tree richness, followed by the Intensive Management and the Impact Zones. In terms of the resilience of three communities adjoining the forest, the result revealed difference in the average resilience score. Although, all three communities fell under a “high” resilience class, the average resilience score calculated based on the four resilience elements varied. It was indicated that Bhadaure Tamagi of Kaski District had the highest score of 3.94, followed by Arther of Parbat District with a moderate score of 3.69, and Arukharka of Syangja District with a lower score of 3.53 (Table 4).
Annex I List of tree species in three different management zones of Panchase protected forest
S.N. Tree species Management zones
Protected zone Intensive management zone Impact zone
1 Daphniphyllum himalense
2 Schima wallichii
3 Symplocos ramoissima
4 Castanopsis tribuloids
5 Quercus semicarpifolia
6 Eurya cerasifolia
7 Eurya acuminata
8 Myrsine semiserrata
9 Maesa macrophylla
10 Rhododendron arboreum
11 Michelia champaca
12 Elaeagnus parvifolia
13 Quercus glauca
14 Quercus lamelossa
15 Unknown sp1
16 Alnus nepalensis
17 Prunus cerasoides
18 Masea chisia
19 Prunus cornuta
20 Prunus nepaulensis
21 Viburnum mullaha
22 Ilex dipyrena
23 Ficus neriifolia
24 Viburnum erubescens
25 Ficus auriculata
26 Pinus wallichiana
27 Maesa macrophylla
28 Choerospondias axxilaris
29 Macaranga pustulata
30 Myrica esculenta
31 Cyathea spinulosa
32 Emblica officinalis
33 Fraxinus floribunda
34 Pinus roxburghii
35 Albizia julibrissin
36 Unknown sp2
37 Macaranga pustulata
38 Engelhardia spicata
39 Myrica esculenta
40 Castanopsis indica
Table 4 Community resilience adjoining Panchase protected forest
Resilience elements Community resilience score
Bhadaure Tamagi Arther Arukharka
Ecosystem protection and biodiversity 3.75 3.75 3.25
Agriculture diversity 4.00 3.50 3.50
Knowledge learning innovation 4.00 3.62 3.50
Social infrastructure and livelihood 4.00 3.87 3.87
Average resilience score 3.94 3.69 3.53

4 Discussion

4.1 Forest management and soil quality

Among the three management zones of the Panchase protected forest, the undisturbed Protected Zone exhibited relatively higher soil quality parameters compared to the Intensive Management and the Impact Zones. The low bulk density in this zone may be attributed to the decomposition of fallen litter, contributing to high SOM and organism activity leading to loose soil condition (Weil and Brady, 2017). In the undisturbed Protected Zone, organic matter accumulation likely contributed to lower soil compaction, thereby enhancing overall soil health. Increased soil bulk density suggests a reduction in larger pores and an increase in the small pores, which hinders soil’s hydraulic movement (Horn and Smucker, 2005). The higher bulk density in the Impact Zone might be attributed to relatively higher anthropogenic disturbances, such as unmanaged harvesting and unplanned road constructions leading to soil compaction. The negative relationship of BD with SOC, TN, and AK observed in PCA also justifies the reduced nutrient content with increased soil compaction in disturbed Impact Zone. Generally, a bulk density below 1.5 g cm-3 is desirable for optimal water and air movement through soil, which is critical for root growth and nutrient availability (Hunt and Gikles, 1992). In terms of soil pH, the moderately acidic soil across the three management zones aligns with findings by Vista et al. (2021), who reported that 53 percent of Nepal’s soil is acidic in nature and considered the general soil type of Nepal. Likewise, Kalu et al. (2015) reported an acidic soil type in the Panchase protected forest. The acidic soil may have future implications on nutrient cycling and vegetation composition, highlighting the need for targeted soil quality enrichment practices.
The higher SOC is evidently an outcome of high organic matter accumulation in the undisturbed Protected Zone. The soil organic matter reported to be positively correlated with the productive capacity of the forests, which is often influenced by management practices (Johnson, 1992). In the Central Himalayan of India, Semwal et al. (2009) reported higher SOC in undisturbed protected forests compared to the disturbed community forests. In terms of total nitrogen, the relatively high level in the undisturbed Protected Zone can be attributed to factors such as forest litter deposition, biological nitrogen fixation, recycling of plant residues, and microbial transformations (Sponseller et al., 2016). Conversely, litter and fuel wood collection in the Intensive Management Zone and the Impact Zone possibly reduced the organic matter content in soil and may impact the nitrogen pool in future. As a vital component of soil, organic matter contributes to water filtration, improvement in soil porosity, and nutrient availability (Page-Dumroese et al., 2021). The higher available phosphorus in the Intensive Management Zone may be attributed to the accumulation of animal manure from grazing, which act as a source of phosphorus (Liang et al., 2017; Mackay et al., 2017). The higher available potassium in the undisturbed Protected Zone is likely due to significant organic matter decomposition in the soil. This finding aligns with Semwal et al. (2009), who reported higher available potassium in the undisturbed protected forests of Cedar, Pine, and Oak compared to the disturbed community forests in the Central Himalayan part of India.
The relatively higher soil quality parameters in the undisturbed Protected Zone, compared to other two zones, indicated good soil quality with a “good” soil class. The Intensive Management Zone, which mostly comprised of community forests and located near to the human settlements, contributed to better soil quality than the Impact Zone. Exposed to moderate disturbances such as grazing, litter collection, and rural road construction in some parts, Intensive Management Zone, indicated reasonable soil quality with a “fair” soil class. In contrast, the Impact Zone, comprising private and community-managed forests and monoculture plantation sites with higher exposure to haphazard road construction, unmanaged grazing, and daily forest resource extraction, revealed relatively poor soil quality despite being classified as a “fair” soil class. The comparative results highlighted the important role of forest management in maintaining and strengthening soil quality parameters, which in turn impacts soil quality and overall soil class. This underscores the effectiveness of forest management in maintaining soil health, which in turn contributes to tree diversity and long-term stability as well as adaptability of the forest ecosystems. These findings suggest the role of forest management measures in advancing soil quality which contributes the forest ecosystem resilience.

4.2 Forest management and tree diversity

The higher tree species observed in the undisturbed Protected Zone compared to the Intensive Management and the Impact Zones highlighted the association of forest management in observed tree richness which contributes tree diversity. The relatively lower tree species in the Impact Zone reflected its exposure to various anthropogenic influences. Similarly, in Eastern US National Park forests, tree diversity has been reported to be higher in protected forests than in the surrounding unprotected forests (Miller et al., 2018). Forests with rich species diversity are enriched with varied hydraulic characteristics, which contribute to building resilience against drought (Anderegg et al., 2018). The forest ecosystems with a mix of deep-rooted trees and grasses with fine root systems exhibit improved hill slope stability (Hairiah et al., 2020), and diverse tree species reduce defoliation during drought conditions (Silva et al., 2018). The higher observed tree richness in the Protected Zone may be attributed to significantly better soil quality which in turn contributes forest ecosystem resilience.

4.3 Forest management and resilience

The findings showed an important connection of forest management on soil quality and observed tree richness, as reflected in the variation of soil quality across the three management zones of the Panchase protected forest. The undisturbed and relatively far Protected Zone, with limited or no anthropogenic disturbances, revealed better soil quality, classified as “good” soil, and relatively higher tree richness, fundamental components of forest resilience. The Intensive Management Zone, with moderate exposure to anthropogenic influences, retained the soil quality and tree richness suggesting positive impact of the management practices. However, this zone exhibited a need for further management measures to enhance the soil quality. In contrast, the Impact Zone, with higher exposure to activities such as haphazard rural road construction, unmanaged harvesting, monoculture plantations, and livestock grazing, revealed relatively poor soil quality and lower tree richness. Semy et al. (2022) reported that deforestation and coal mining activities degrade soil properties and hinder soil rejuvenation in the tropical forests of Nagaland, India. Hence, the Protected Zone is well-positioned to support climate change mitigation through carbon sequestration. Overall, this comparison across the three management zones suggested that forest management practice influences soil class and tree species richness. These findings reinforced the need for advancing specific forest management measures, particularly in areas that are exposed to high anthropogenic pressure, to foster soil health and tree diversity for fostering forest resilience in long run. The resilient forests provide essential services to adjoining communities, which in turn helps building community resilience.

4.4 Community resilience

Improved resilience score of the Bhadaure Tamagi may be attributed to its larger forest area, its location in proximity to a larger portion of the Panchase forest, better ecological links in the landscapes, better ecosystem protection measures, and diversity in agricultural practices as compared to Arther and Arukharka. Furthermore, the availability of accessible infrastructure, road networks, market access, and tourism activities in Bhadaure Tamagi likely to have contributed to better resilience score compared to the other two communities. In contrast, the lower resilience of Arukharka may be associated to its relatively small forest area and its distant location from the major portions of the Panchase protected forest, which limits its regular access to forest resources and most importantly related environmental benefits. Additionally, Arukharka’s poor ecological links within the landscape, less ecosystem protection measures, and less innovation in agriculture resulted in a comparatively lower resilience.

5 Conclusions

Forest management practices impact soil parameters, soil quality, tree diversity, and overall forest resilience. The relatively better soil quality in the undisturbed Protected Zone supports better tree richness to foster tree diversity, contributing to the better forest resilience compared to the Intensive Management and Impact Zones. Therefore, there is a need to implement more effective forest management measures such as controlled livestock grazing, managing the excessive fuelwood and fodder collections in some areas, implementing soil erosion and landslide mitigation measures along the rural roads, and plantation of diverse native trees focusing the Intensive Management and the Impact Zones. Regarding community resilience, the Bhadaure Tamagi, lying relatively close to the Panchase protected forest harboring larger forest area is relatively more resilient than distantly lying Arukharka community, which harbors less portion of Panchase protected forest. This also strengthens the forest ecosystem’s contribution to enhance community resilience. Further, to enhance resilience of Arukharka and Arther communities, elements like agricultural biodiversity, agricultural innovations, and biodiversity-based livelihoods need to be strengthened.

Acknowledgements

The authors acknowledge the Central Department of Environment Science, Institute of Science and Technology, Tribhuvan University for this research opportunity. Authors acknowledge the Sichuan Science and Technology Program (2024YFHZ0248) for conference travel support. The authors appreciate the contribution of the Panchase Protected Forest Council, the Machhapuchhre Development Organization, local representatives, and community for generous support during the field work. The authors acknowledge Dr. Ananta Ram Bhandari for study area image, which was georeferenced and used for spatial analysis.
[1]
Anderegg W R L, Konings A G, Trugman A T, et al. 2018. Hydraulic diversity of forests regulates ecosystem resilience during drought. Nature, 561(7724): 538-541. DOI: 10.1038/s41586-018-0539-7.

[2]
Bajracharya R M, Sharma S, Sitaula B K, et al. 2007. Soil quality in Nepalese context—An analytical review. International Journal of Ecology and Environmental Sciences, 33(2): 143-158.

[3]
Battle J, Binkley D, Ryan M G. 2001. Biomass removal and post-harvest practices in forest ecosystems: Impacts on plant diversity. Forest Ecology and Management, 168(1-3): 3-11.

[4]
Bergamini N, Mijatovic D, Eyzaguirre P, et al. 2013. UNU-IAS policy report indicators of resilience in Socio-ecological Production Landscapes (SEPLs). Policy Report. United Nations University, Institute of Advanced Studies, Yokohama, Japan. http://www.ias.unu.edu/.

[5]
Bhandari A, Khadka U R, Kanel K. 2018. Ecosystem services in the mid-hill forest of Western Nepal: A case of Panchase Protected Forest. Journal of the Institute of Science and Technology, 23(1): 10-17.

[6]
Blake George R, Karl H H. 1986. Bulk density and particle density. In: Klute A (ed). Methods of soil analysis. Part 1: Physical and mineralogical methods (2nd ed). Agronomy Monograph 9. Madison, USA: American Society of Agronomy, Soil Science Society of America: 363-381.

[7]
Bremner John M, Charles S M. 1982. Nitrogen total. In: Page A L (ed). Methods of soil analysis, Part 2: Chemical and microbiological properties. Madison, USA: American Society of Agronomy, Soil Science Society of America: 595-624.

[8]
Budha P, Rai P, Katel P, et al. 2020. Landslide hazard mapping in Panchase Mountain of Central Nepal. Environment and Natural Resources Journal, 18(4): 387-399.

DOI

[9]
Cantarello E, Jacobsen J B, Lloret F, et al. 2024. Shaping and enhancing resilient forests for a resilient society. Ambio, 53: 1095-1108.

DOI

[10]
DFO (District Forest Office). 2016. Panchase Protected Forest Management Plan 2016: Protected Forest Program. Kaski, Nepal: District Forest Office. (in Nepali)

[11]
Diaz S, Settele J, Brondizio E S, et al. (eds). 2019. The global assessment report on biodiversity and ecosystem services: Summary for policymakers. Bonn, Germany: Intergovernmental Science-Policy Platform on Biodiversity and Ecosystem Services (IPBES).

[12]
DoF (Department of Forest). 2012. Panchase Protection Forest Management Plan 2012. Department of Forest, Kathmandu, Nepal. https://www.researchgate.net/publication/353322544. (in Nepali)

[13]
FAO (Food and Agriculture Organization). 2019. Forests for resilience to natural, climate, and human-induced disasters and crises. Rome, Italy: Forestry Department, Food and Agriculture Organization.

[14]
Feleke T G, Sharma P D, Selfeko D T. 2019. Assessing soil quality of Abargay Rangeland in Farta District, Amhara Regional State, Ethiopia. Journal of Soil Science and Environmental Management, 10(3): 46-57.

DOI

[15]
Forzieri G, Dakos V, McDowell N G, et al. 2022. Emerging signals of declining forest resilience under climate change. Nature, 608: 534-539.

DOI

[16]
Gee G W, Bauder J W. 1986. Particle size analysis. In: Klute A (ed). Methods of soil analysis. Part 1: Physical and mineralogical methods (2nd ed). Madison, USA: American Society of Agronomy, Soil Science Society of America: 383-411.

[17]
Hairiah K, Widianto W, Suprayogo D, et al. 2020. Tree roots anchoring and binding soil: Reducing landslide risk in Indonesian agroforestry. Land, 9(8): 256. DOI: 10.3390/land9080256.

[18]
Haji L, Valizadeh N, Hayati D. 2021. The role of local communities in sustainable land and forest management. In: Shit P K, Pourghasemi H R, Das P, et al. (eds). Spatial modeling in forest resources management. Environmental Science and Engineering. Cham, Switzerland: Springer: 473-503. DOI:10.1007/978-3-030-56542-8_20.

[19]
Herniyanti A, Suleman D, Namriah, et al. 2023. Influence of topo-sequence on soil quality of sugarcane plantation area in Bombana Regency, Indonesia. IOP Conference Series: Earth and Environmental Science. DOI: 10.1088/1755-1315/1253/1/012021.

[20]
Hodgson D, McDonald J L, Hosken D J. 2015. What do you mean, ‘resilient’? Trends in Ecology & Evolution, 30(9): 503-506.

DOI

[21]
Horn R, Smucker A J M. 2005. Structure formation and its consequences for gas and water transport in unsaturated arable and forest soils. Soil and Tillage Research, 82(1): 5-14.

DOI

[22]
Hunt N, Gilkes B R J. 1992. Farm monitoring handbook. Perth, Australia: UWA Publishing.

[23]
IPCC (Intergovernmental Panel on Climate Change). 2019. Climate change and land: An IPCC special report on climate change, desertification, land degradation, sustainable land management, food security, and greenhouse gas fluxes in terrestrial ecosystems—Summary for policymakers. https://wedocs.unep.org/20.500.11822/29261.

[24]
IUCN (International Union for Conservation of Nature). 2021. Forests and climate change: Issues brief. https://www.iucn.org/resources/issues-briefs/forests-and-climate-change. Viewed on 2021-02-02.

[25]
Jandl R, Lindner M, Vesterdal L, et al. 2007. How strongly can forest management influence soil carbon sequestration? Geoderma, 137(3-4): 253-268.

DOI

[26]
Johnson D W. 1992. Effects of forest management on soil carbon storage. Water Air and Soil Pollution, 64: 83-120.

DOI

[27]
Kalu S, Koirala M, Khadka U R. 2015. Soil quality assessment for different land use in the Panchase area of Western Nepal. International Journal of Environmental Protection, 5(1): 38-43.

DOI

[28]
Kerven G L, Menzies N W, Geyer M D. 2000. Analytical methods and quality assurance. Communications in Soil Science and Plant Analysis, 31(11-14): 1935-1939.

DOI

[29]
Kumi J A, Kyereh B, Ansong M, et al. 2021. Influence of management practices on stand biomass, carbon stocks, and soil nutrient variability of teak plantations in a dry semi-deciduous forest in Ghana. Trees for People, 3: 100049. DOI: 10.1016/j.tfp.2020.100049.

[30]
Lal R. 2005. Forest soils and carbon sequestration. Forest Ecology and Management, 220(1-3): 242-258.

DOI

[31]
Liang X, Jin Y, He M, et al. 2017. Composition of phosphorus species and phosphatase activities in a paddy soil treated with manure at varying rates. Agricultural Ecosystems and Environment, 237: 173-180.

DOI

[32]
Mackay J E, Macdonald L M, Smernik R J, et al. 2017. Organic amendments as phosphorus fertilizers: Chemical analyses, biological processes, and plant P uptake. Soil Biology and Biochemistry, 107: 50-59.

DOI

[33]
Malhi Y, Franklin J, Seddon N, et al. 2020. Climate change and ecosystems: Threats, opportunities, and solutions. Philosophical Transactions of the Royal Society B, 375(1794): 20190104. DOI: 10.1098/rstb.2019.0104.

[34]
McLean E O. 1982. Soil pH and lime requirement. In: Page A L (ed). Methods of soil analysis. Part 2: Chemical and microbiological properties (2nd ed.), Madison, USA: American Society of Agronomy/Soil Science Society of America: 199-224.

[35]
Millar C I, Stephenson N L. 2015. Temperate forest health in an era of emerging mega disturbances. Science, 349: 823-826.

DOI

[36]
Miller K M, McGill B J, Mitchel B R, et al. 2018. Eastern national parks protect greater tree species diversity than unprotected matrix forests. Forest Ecology and Management, 414: 74-84.

DOI

[37]
MoALMC (Ministry of Agriculture Land Management and Cooperatives). 2017. Manual for soil and fertilizer analysis. Lalitpur, Nepal: Department of Agriculture of Nepal, Soil Management Directorate.

[38]
MoFSC (Ministry of Forest and Soil Conservation). 2017. Protected Forests of Nepal. Kathmandu, Nepal: Department of Forest, National Forest Division, https://www.researchgate.net/publication/326678917. (in Nepali).

[39]
NARC (Nepal Agriculture Research Council). 1993. Interpretation table for soil fertility. Lalitpur, Nepal: Nepal Agriculture Research Council.

[40]
Neupane A, Dhakal A, Khatiwada P, et al. 2024. Influence of forest management regimes and soil depth on some selected soil properties. Journal of Institute of Forestry, Nepal. 21(1): 83-101.

[41]
Nikinmaa L, Lindner M, Cantarello E, et al. 2020. Reviewing the use of resilience concepts in forest sciences. Current Forestry Reports, 6: 61-80.

DOI PMID

[42]
Olsen S R, Sommers L E. 1982. Phosphorus. In: Page A L (ed). Methods of soil analysis: Part 2. Chemical and microbiological properties (2nd ed). Madison, USA: American Society of Agronomy and Soil Science Society of America: 403-430.

[43]
Page-Dumroese D S, Busse M D, Jurgensen M F, et al. 2021. Sustaining forest soil quality and productivity. In: Stanturf J A, Callaham M A (eds). Soils and landscape restoration. Cambridge, USA: Academic Press: 63-93.

[44]
Pecl G T, Araújo M B, Bell J D, et al. 2017. Biodiversity redistribution under climate change: Impacts on ecosystems and human well-being. Science, 355(6332). DOI: 10.1126/science.aai9214.

[45]
Qian J, Ji C, Yang J, et al. 2024. The advantage of afforestation using native tree species to enhance soil quality in degraded forest ecosystems. Scientific Reports, 14: 20022. DOI: 10.1038/s41598-024-71162-3.

PMID

[46]
Rana R, Kumar M, Sundriyal R C, et al. 2025. Physico-chemical variations in soil across urban proximity in Van Panchayat and reserved forests of western Himalaya. Trees, Forests, and People, 22. DOI: 10.1016/j.tfp.2025.100994.

[47]
Rijal S. 2020. A review on soil conservation practices in Nepal. Environmental Contamination Reviews, 3(1): 21-23.

[48]
Semwal D P, Uniyal P L, Bahuguna, Y M et al. 2009. Soil nutrient storage under different forest types in a part of Central Himalayas, India. Annals of Forestry, 17(1): 43-48.

[49]
Semy K, Singh M, Walling M, et al. 2022. Qualitative soil assessment of coal mine disturbed and undisturbed tropical forest in Nagaland, India. Proceedings of the National Academy of Sciences, India Section B: Biological Sciences, 92: 275-280.

[50]
Silva S R, Verheyen K, Ponette Q, et al. 2018. Tree diversity mitigates defoliation after a drought-induced tipping point. Global Change Biology, 24(9): 4304-4315.

DOI

[51]
Singh H. 2024. Climate change and forests: Biological perspectives. In: Singh H (ed.). Forests and climate change. Singapore, Singapore: Springer.

[52]
Sponseller R A, Gundale M J, Futter M, et al. 2016. Nitrogen dynamics in managed boreal forests: Recent advances and future research directions. Ambio, 45(S2): 175-187.

DOI

[53]
Thapa M S, Bhattarai T, Sharma R P, et al. 2019. Analytical study on fertility status and soil quality index of Shorea robusta forest, Central Nepal. Tribhuvan University Journal, 33(2): 1-14.

[54]
Thomas G W. 1982. Available potassium determination in soil using microprocessor-based flame photometry. In: Klute A (ed). Methods of soil analysis: Part 2. Chemical and microbiological properties (2nd ed.) Madison, USA: American Society of Agronomy, Soil Science Society of America: 159-165.

[55]
UNDP (United Nation Development Program). 2022. Special report on human security. New York, USA. Retrieved from https://hdr.undp.org/content/2022-special-report-human-security

[56]
UNU-IAS (United Nations University-Institute of Advanced Studies). 2013. Indicators of resilience in socio-ecological production landscapes. Yokohama, Japan: United Nations University.

[57]
UNU-IAS (United Nations University-Institute of Advanced Studies), Biodiversity International, IGES (Institute for Global Environmental Strategies), UNDP (United Nation Development Program), 2014. Toolkits for Indicators of Resilience in Socio-Ecological Production Landscapes and Seascapes. Yokohama, Japan: United Nations University.

[58]
Vista S P, Karki K B, Gaihre Y K, et al. 2021. Soil properties. In: Ojha R B, Panday D (eds). The Soils of Nepal. World Soils Book Series. Springer, Cham, Switzerland. DOI: 10.1007/978-3-030-80999-7.

[59]
Walkley A, Ian A Black. 1934. An examination of the Degtjareff method for determining soil organic matter, and a proposed modification of the chromic acid titration method. Soil Science, 37: 29-38.

DOI

[60]
Weil R R, Brady N C. 2017. The nature and properties of soils (15th ed). Upper Saddle River, USA: Pearson Education Inc.

[61]
WWF (World Wildlife Fund). 2015. Study Report on Community and ecosystem resilience towards climate-induced disasters in Gandaki River Basin of Chitwan Annapurna Landscape. Kathmandu, Nepal: World Wildlife Fund.

[62]
Yan H, Zhan J, Zhang T. 2011. Resilience of forest ecosystems and its influencing factors. Procedia Environmental Sciences, 10(Part C): 2201-2206. DOI: 10.1016/j.proenv.2011.09.345.

[63]
Yang Y, Bai K, Li G, et al. 2020. Assessment of the resilience of socio-ecological production landscapes and seascapes in Yanuo Village, Xishunganna, Southwest China. Sustainability, 12(9): 3774. DOI: 10.3390/su12093774.

[64]
Yazdanshenas H, Jafari M, Azarnivand H, et al. 2015. Evaluation of soil quality based on minimum data set in Karvan Rangeland, Isfahan, Iran. Journal of Rangeland Science, 5(4): 25-1258.

[65]
Yeneneh N, Elias E, Feyisa G L. 2024. Monitoring soil quality of different land use systems: A case study in Suha Watershed, northwestern highlands of Ethiopia. Environmental System Research, 13(7). DOI: 10.118 6/s40068-024-00336-9.

Outlines

/