
Journal of Resources and Ecology >
The Impact of Digital Applications on Family Farm Income
#These authors contributed equally
|
XIAO Hui, E-mail: huixiao9608@163.com; |
|
ZHANG Chenhan, E-mail: zhangchenhan0325@163.com. |
Received date: 2025-10-23
Accepted date: 2025-12-29
Online published: 2026-02-02
Supported by
The National Social Science Fund of China(22VRC017)
The National Forestry and Grassland Administration of China, Monitoring of the Collective Forest Tenure Reform in Jiangxi Province(JYC-2025-0036)
The Early-Career Young Scientists and Technologists Project of Jiangxi Province(20252BEJ730131)
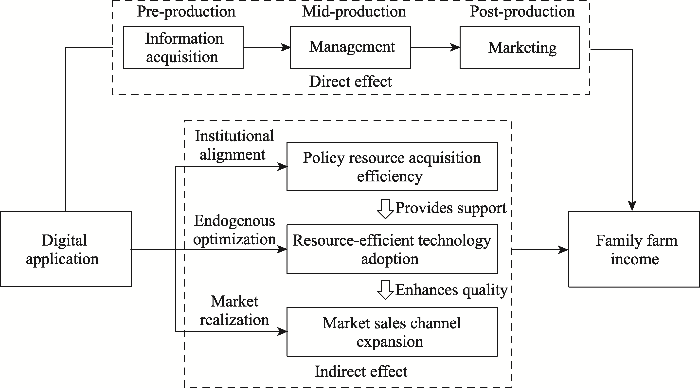
The rapid development of the rural digital economy has emerged as a global phenomenon affecting both developed and developing countries, and China is no exception. Based on field survey data from 432 citrus family farms in Jiangxi Province in 2023, the mediating effect test and heterogeneity analysis are employed in this study to assess the impact of digital applications (DA) on family farm income (FFI). The results show that DA significantly increases FFI, with its enabling effect spanning the entire production chain from pre-production information acquisition to mid-production management and post-production marketing. Mechanism analysis indicates that DA enhances economic returns through three synergistic pathways: improving policy resource acquisition efficiency, promoting resource-efficient technology adoption, and expanding market sales channels. Heterogeneity analysis further shows that the income-enhancing effect of DA is more pronounced among farms with smaller scales, lower incomes, weaker social capital, and poorer infrastructure. These findings reflect inclusive “catch-up” and “substitution” effects, rather than the emergence of a digital divide. This study enriches the theoretical framework of digital agricultural empowerment and provides policy-relevant evidence for the formulation of targeted digital agriculture policies.
Key words: digital agriculture; family farm; income effect; digital divide
XIAO Hui , ZHANG Chenhan , LI Yingjiang . The Impact of Digital Applications on Family Farm Income[J]. Journal of Resources and Ecology, 2026 , 17(1) : 291 -308 . DOI: 10.5814/j.issn.1674-764x.2026.01.023
Figure 1 Mechanism of the effect of DA on FFI |
Table 1 Source and distribution of survey data |
| Survey region stratification | Cities covered | Questionnaires distributed (copies) | Valid samples (copies) | Effective recovery rate (%) |
|---|---|---|---|---|
| Northern Jiangxi | Shangrao, Xinyu, Yichun | 104 | 95 | 91.35 |
| Central Jiangxi | Ji’an, Fuzhou | 62 | 53 | 85.48 |
| Southern Jiangxi | Ganzhou | 314 | 284 | 90.45 |
| Total | 480 | 432 | 90.00 |
Table 2 Variable definitions and descriptive statistics |
| Variable type | Variable name | Variable symbol | Variable description | Mean | Std. Dev. |
|---|---|---|---|---|---|
| Explained variable | Family farm income | FFI | Citrus farming income (yuan, natural logarithm) | 11.697 | 1.466 |
| Core explanatory variables | Internet access | Access | Whether connected to the internet | 0.782 | 0.413 |
| pre-production information acquisition | D_pre | Whether agricultural information acquired online (e.g., green tech, land protection) | 0.681 | 0.467 | |
| Mid-production management | D_in | Whether digital technologies used in production (IoT, drones, AI, etc.) | 0.463 | 0.499 | |
| Post-production marketing | D_post | Whether agricultural products sold online | 0.600 | 0.491 | |
| Mediating variables | Efficiency of policy resource acquisition | Policy_Access | Frequency of consulting government agricultural technology agents on citrus technologies (Scale of likelihood 1-5, higher=more frequent) | 0.625 | 0.433 |
| Adoption of resource-efficient technologies | Tech_Adoption | Ratio of area using resource-efficient technologies to total planted area | 3.322 | 1.314 | |
| Expansion of market sales channel | Market_Expansion | Does the government provide citrus sales information? (Scale of likelihood 1-5, higher=better) | 3.602 | 1.106 | |
| Control variables | Farm owner’s age | Age | Age of farm owner (years) | 49.347 | 7.814 |
| Farm owner’s education | Education | Education level: 1=None; 2=Primary; 3=Junior high; 4=Senior high (vocational); 5=College and above | 3.667 | 0.856 | |
| Farming experience | Experience | Years engaged in citrus cultivation (years) | 14.315 | 8.700 | |
| Family size | Family_Size | Total number of people in the family farm | 5.257 | 1.765 | |
| Citrus planting scale | Scale | Total area planted with citrus (Mu, 1 mu≈0.067 ha) | 158.597 | 289.232 | |
| Village traffic conditions | Traffic | Village traffic conditions: 1=Very poor; 2=Poor; 3=Fair; 4=Good; 5=Very good | 3.456 | 0.970 |
Table 3 Benchmark regression results |
| Variable | FFI | ||||
|---|---|---|---|---|---|
| (1) | (2) | (3) | (4) | (5) | |
| Access | 0.562*** | 0.382** | |||
| (0.184) | (0.150) | ||||
| Age | ‒0.016* | ‒0.015 | ‒0.012 | ‒0.017* | |
| (0.009) | (0.009) | (0.010) | (0.010) | ||
| Education | 0.095 | 0.091 | 0.075 | 0.062 | |
| (0.071) | (0.071) | (0.070) | (0.071) | ||
| Experience | 0.024*** | 0.025*** | 0.023*** | 0.024*** | |
| (0.007) | (0.007) | (0.007) | (0.007) | ||
| Family_size | 0.060 | 0.065* | 0.062* | 0.057 | |
| (0.037) | (0.037) | (0.037) | (0.037) | ||
| Scale | 0.003*** | 0.003*** | 0.002*** | 0.003*** | |
| (.001) | (.001) | (.001) | (0.001) | ||
| Traffic | 0.100 | 0.097 | 0.105* | 0.113* | |
| (0.064) | (0.065) | (0.064) | (0.063) | ||
| D_pre | 0.383*** | ||||
| (0.140) | |||||
| D_in | 0.374*** | ||||
| (0.115) | |||||
| D_post | 0.277** | ||||
| (0.122) | |||||
| _cons | 11.258*** | 10.437*** | 10.398*** | 10.454*** | 10.695*** |
| (0.168) | (0.631) | (0.630) | (0.616) | (0.624) | |
| Observations | 432 | 432 | 432 | 432 | 432 |
| R2 | 0.025 | 0.307 | 0.310 | 0.311 | 0.304 |
Note: Robust standard errors are in parentheses. *, **, *** indicate P<0.1, P<0.05, P<0.01, respectively. The same applies to the tables below. |
Table 4 Robustness test results |
| Variable | Replace explanatory variables | Add omitted variables | Delete some samples | |||||||||
|---|---|---|---|---|---|---|---|---|---|---|---|---|
| (1) | (2) | (3) | (4) | (5) | (6) | (7) | (8) | (9) | (10) | (11) | (12) | |
| Access | 0.401*** | 0.283* | 0.255** | |||||||||
| (0.106) | (0.148) | (0.125) | ||||||||||
| D_pre | 0.266*** | 0.277** | 0.123 | |||||||||
| (0.093) | (0.135) | (0.108) | ||||||||||
| D_in | 0.171* | 0.296** | 0.268*** | |||||||||
| (0.088) | (0.115) | (0.098) | ||||||||||
| D_post | 0.360*** | 0.207* | 0.293*** | |||||||||
| (0.091) | (0.121) | (0.098) | ||||||||||
| Gov_Train | 0.565*** | 0.542*** | 0.557*** | 0.584*** | ||||||||
| (0.176) | (0.172) | (0.176) | (0.177) | |||||||||
| Control | Yes | Yes | Yes | Yes | Yes | Yes | Yes | Yes | Yes | Yes | Yes | Yes |
| Observations | 432 | 432 | 432 | 432 | 432 | 432 | 432 | 432 | 399 | 399 | 399 | 399 |
| R2 | 0.090 | 0.076 | 0.066 | 0.093 | 0.327 | 0.329 | 0.330 | 0.326 | 0.281 | 0.275 | 0.286 | 0.288 |
Table 5 Test results for omitted variable bias |
| Variable | (1) | (2) | (3) | (4) | |||||||||
|---|---|---|---|---|---|---|---|---|---|---|---|---|---|
| Constrained model 1 | Full model 1 | Constrained model 2 | Full model 2 | Constrained model 1 | Full model 1 | Constrained model 2 | Full model 2 | ||||||
| Access | 0.562*** | 0.488*** | 0.495*** | 0.382** | |||||||||
| (0.184) | (0.174) | (0.176) | (0.150) | ||||||||||
| D_pre | 0.485*** | 0.430*** | 0.421*** | 0.383*** | |||||||||
| (0.163) | (0.155) | (0.155) | (0.140) | ||||||||||
| D_in | |||||||||||||
| D_post | |||||||||||||
| Household characteristics | No | Yes | Yes | Yes | No | Yes | Yes | Yes | |||||
| Individual characteristics | No | Yes | No | Yes | No | Yes | No | Yes | |||||
| Farm characteristics | No | No | No | Yes | No | No | No | Yes | |||||
| Village characteristics | No | No | No | Yes | No | No | No | Yes | |||||
| Ratio | 6.595 | 3.381 | 7.818 | 10.079 | |||||||||
| Observations | 432 | 432 | 432 | 432 | 432 | 432 | 432 | 432 | |||||
| Variable | (5) | (6) | (7) | (8) | |||||||||
| Constrained model 1 | Full model 1 | Constrained model 2 | Full model 2 | Constrained model 1 | Full model 1 | Constrained model 2 | Full model 2 | ||||||
| Access | |||||||||||||
| D_pre | |||||||||||||
| D_in | 0.683*** | 0.581*** | 0.581*** | 0.374*** | |||||||||
| (0.137) | (0.133) | (0.133) | (0.115) | ||||||||||
| D_post | 0.441*** | 0.298** | 0.313** | 0.277** | |||||||||
| (0.146) | (0.144) | (0.145) | (0.122) | ||||||||||
| Household characteristics | No | Yes | Yes | Yes | No | Yes | Yes | Yes | |||||
| Individual characteristics | No | Yes | No | Yes | No | Yes | No | Yes | |||||
| Farm characteristics | No | No | No | Yes | No | No | No | Yes | |||||
| Village characteristics | No | No | No | Yes | No | No | No | Yes | |||||
| Ratio | 5.696 | 1.806 | 2.084 | 7.694 | |||||||||
| Observations | 432 | 432 | 432 | 432 | 432 | 432 | 432 | 432 | |||||
Table 6 DA, efficiency of policy resource acquisition, and FFI |
| Variable | (1) | (2) | (3) | (4) | (5) | (6) | (7) | (8) |
|---|---|---|---|---|---|---|---|---|
| Policy_Access | FFI | Policy_Access | FFI | Policy_Access | FFI | Policy_Access | FFI | |
| Access | 0.424*** | 0.336** | ||||||
| (0.135) | (0.148) | |||||||
| D_pre | 0.663*** | 0.323** | ||||||
| (0.117) | (0.137) | |||||||
| D_in | 0.425*** | 0.330*** | ||||||
| (0.107) | (0.115) | |||||||
| D_post | 0.325*** | 0.240* | ||||||
| (0.112) | (0.123) | |||||||
| Policy_Access | 0.109* | 0.090 | 0.102 | 0.114* | ||||
| (0.063) | (0.063) | (0.064) | (0.064) | |||||
| Control | Yes | Yes | Yes | Yes | Yes | Yes | Yes | Yes |
| Observations | 432 | 432 | 432 | 432 | 432 | 432 | 432 | 432 |
| R2 | 0.072 | 0.313 | 0.123 | 0.314 | 0.081 | 0.316 | 0.067 | 0.311 |
Table 7 DA, adoption of resource-efficient technologies, and FFI |
| Variable | (1) | (2) | (3) | (4) | (5) | (6) | (7) | (8) |
|---|---|---|---|---|---|---|---|---|
| Tech_Adoption | FFI | Tech_Adoption | FFI | Tech_Adoption | FFI | Tech_Adoption | FFI | |
| Access | 0.166*** | 0.286** | ||||||
| (0.053) | (0.145) | |||||||
| D_pre | 0.175*** | 0.283** | ||||||
| (0.046) | (0.136) | |||||||
| D_in | 0.18*** | 0.272** | ||||||
| (0.042) | (0.119) | |||||||
| D_post | 0.113** | 0.210* | ||||||
| (0.044) | (0.123) | |||||||
| Tech_Adoption | 0.583*** | 0.568*** | 0.565*** | 0.597*** | ||||
| (0.144) | (0.142) | (0.148) | (0.147) | |||||
| Control | Yes | Yes | Yes | Yes | Yes | Yes | Yes | Yes |
| Observations | 432 | 432 | 432 | 432 | 432 | 432 | 432 | 432 |
| R2 | 0.075 | 0.335 | 0.085 | 0.336 | 0.089 | 0.336 | 0.066 | 0.333 |
Table 8 DA, expansion of market sales channels, and FFI |
| Variable | (1) | (2) | (3) | (4) | (5) | (6) | (7) | (8) |
|---|---|---|---|---|---|---|---|---|
| Market_Expansion | FFI | Market_Expansion | FFI | Market_Expansion | FFI | Market_Expansion | FFI | |
| Access | 0.510*** | 0.315** | ||||||
| (0.15) | (0.146) | |||||||
| D_pre | 0.714*** | 0.297** | ||||||
| (0.133) | (0.130) | |||||||
| D_in | 0.485*** | 0.312*** | ||||||
| (0.125) | (0.113) | |||||||
| D_post | 0.468*** | 0.214* | ||||||
| (0.128) | (0.122) | |||||||
| Market_Expansion | 0.132** | 0.120** | 0.127** | 0.134** | ||||
| (0.058) | (0.055) | (0.057) | (0.058) | |||||
| Control | YES | YES | YES | YES | YES | YES | YES | YES |
| Observations | 432 | 432 | 432 | 432 | 432 | 432 | 432 | 432 |
| R2 | 0.122 | 0.319 | 0.159 | 0.320 | 0.128 | 0.322 | 0.126 | 0.317 |
Table 9 Heterogeneity effects of farm size |
| Variable | (1) | (2) | (3) | (4) | (5) | (6) | (7) | (8) | (9) | (10) | (11) | (12) |
|---|---|---|---|---|---|---|---|---|---|---|---|---|
| Scale_S | Scale_M | Scale_L | Scale_S | Scale_M | Scale_L | Scale_S | Scale_M | Scale_L | Scale_S | Scale_M | Scale_L | |
| Access | 0.648*** | 0.522** | 0.072 | |||||||||
| (0.200) | (0.229) | (0.166) | ||||||||||
| D_pre | 0.616*** | 0.409** | -0.018 | |||||||||
| (0.181) | (0.189) | (0.145) | ||||||||||
| D_in | 0.205 | 0.239 | 0.151 | |||||||||
| (0.180) | (0.166) | (0.150) | ||||||||||
| D_post | 0.352** | 0.467*** | 0.278* | |||||||||
| (0.169) | (0.171) | (0.164) | ||||||||||
| Control | Yes | Yes | Yes | Yes | Yes | Yes | Yes | Yes | Yes | Yes | Yes | Yes |
| Observations | 136 | 126 | 170 | 136 | 126 | 170 | 136 | 126 | 170 | 136 | 126 | 170 |
| R2 | 0.516 | 0.115 | 0.275 | 0.524 | 0.103 | 0.274 | 0.480 | 0.077 | 0.278 | 0.491 | 0.121 | 0.287 |
Table 10 Heterogeneity effects of household farm income |
| Variable | (1) | (2) | (3) | (4) | (5) | (6) | (7) | (8) |
|---|---|---|---|---|---|---|---|---|
| Income_L | Income_H | Income_L | Income_H | Income_L | Income_H | Income_L | Income_H | |
| Access | 0.345* | 0.427** | ||||||
| (0.209) | (0.207) | |||||||
| D_pre | 0.450** | 0.315* | ||||||
| (0.193) | (0.185) | |||||||
| D_in | 0.437*** | 0.249 | ||||||
| (0.154) | (0.173) | |||||||
| D_post | 0.353** | 0.206 | ||||||
| (0.162) | (0.172) | |||||||
| Control | Yes | Yes | Yes | Yes | Yes | Yes | Yes | Yes |
| Observations | 197 | 235 | 197 | 235 | 197 | 235 | 197 | 235 |
| R2 | 0.338 | 0.351 | 0.349 | 0.347 | 0.350 | 0.343 | 0.343 | 0.342 |
Table 11 Heterogeneity effects of social capital |
| Variable | (1) | (2) | (3) | (4) | (5) | (6) | (7) | (8) |
|---|---|---|---|---|---|---|---|---|
| SC_L | SC_H | SC_L | SC_H | SC_L | SC_H | SC_L | SC_H | |
| Access | 0.540** | 0.279 | ||||||
| (0.215) | (0.204) | |||||||
| D_pre | 0.341* | 0.434** | ||||||
| (0.194) | (0.190) | |||||||
| D_in | 0.506*** | 0.327** | ||||||
| (0.163) | (0.161) | |||||||
| D_post | 0.329* | 0.258 | ||||||
| (0.176) | (0.166) | |||||||
| Control | Yes | Yes | Yes | Yes | Yes | Yes | Yes | Yes |
| Observations | 204 | 228 | 204 | 228 | 204 | 228 | 204 | 228 |
| R2 | 0.384 | 0.298 | 0.372 | 0.311 | 0.388 | 0.303 | 0.372 | 0.299 |
Table 12 Heterogeneity effects of village infrastructure level |
| Variable | (1) | (2) | (3) | (4) | (5) | (6) | (7) | (8) |
|---|---|---|---|---|---|---|---|---|
| Traffic_P | Traffic_G | Traffic_P | Traffic_G | Traffic_P | Traffic_G | Traffic_P | Traffic_G | |
| Access | 0.435** | 0.345 | ||||||
| (0.194) | (0.249) | |||||||
| D_pre | 0.398** | 0.419* | ||||||
| (0.176) | (0.248) | |||||||
| D_in | 0.468*** | 0.343* | ||||||
| (0.157) | (0.174) | |||||||
| D_post | 0.476*** | 0.065 | ||||||
| (0.157) | (0.197) | |||||||
| Control | Yes | Yes | Yes | Yes | Yes | Yes | Yes | Yes |
| Observations | 238 | 194 | 238 | 194 | 238 | 194 | 238 | 194 |
| R2 | 0.253 | 0.366 | 0.253 | 0.372 | 0.261 | 0.370 | 0.262 | 0.359 |
| [1] |
|
| [2] |
|
| [3] |
|
| [4] |
|
| [5] |
|
| [6] |
|
| [7] |
|
| [8] |
|
| [9] |
|
| [10] |
|
| [11] |
|
| [12] |
|
| [13] |
|
| [14] |
|
| [15] |
|
| [16] |
|
| [17] |
|
| [18] |
|
| [19] |
|
| [20] |
|
| [21] |
|
| [22] |
|
| [23] |
|
| [24] |
|
| [25] |
|
| [26] |
|
| [27] |
|
| [28] |
|
| [29] |
|
| [30] |
|
| [31] |
|
| [32] |
|
| [33] |
|
| [34] |
|
| [35] |
|
| [36] |
|
| [37] |
|
| [38] |
|
| [39] |
|
| [40] |
|
| [41] |
|
| [42] |
|
| [43] |
|
| [44] |
|
| [45] |
|
| [46] |
|
| [47] |
|
| [48] |
|
| [49] |
|
| [50] |
|
| [51] |
|
/
| 〈 |
|
〉 |