Ecological Restoration and Ecological Assessment

Modelling the Densities of Soil Organic Carbon, Total Nitrogen and Phosphorus Using Random Forest Model, and Their Spatial Distributions of Cultivated Lands in the YLN Region of Tibet

  • SUN Wei , 1 ,
  • LI Tianyu 1 ,
  • LI Shaowei 1 ,
  • ZHA Xinjie 2 ,
  • HAN Fusong 3 ,
  • HUANG Shaolin 4 ,
  • Dorblha 5 ,
  • CHEN Chuhong 6 ,
  • Dawaqiongda 7 ,
  • Luo bu 7 ,
  • FU Gang , 1, *
Expand
  • 1. Lhasa Plateau Ecosystem Research Station, Key Laboratory of Ecosystem Network Observation and Modeling, Institute of Geographic Sciences and Natural Resources Research, Chinese Academy of Sciences, Beijing 100101, China
  • 2. Xi’an University of Finance and Economics, Xi’an 710100, China
  • 3. College of Urban and Environmental Sciences, Hunan University of Technology, Zhuzhou, Hunan 412007, China
  • 4. College of Tourism, Henan Normal University, Xinxiang, Henan 453007, China
  • 5. Veterinary Station of the Agricultural and Rural Bureau of Dangxiong County, Lhasa 850014, China
  • 6. Lhasa Agricultural Technology Extension Station, Lhasa 850000, China
  • 7. Zhongba County Agriculture and Animal Husbandry Comprehensive Service Center, Xigaze, Tibet 857000, China
* FU Gang, E-mail:

SUN Wei, E-mail:

Received date: 2025-01-01

  Accepted date: 2025-05-30

  Online published: 2025-11-28

Supported by

The Lhasa Science and Technology Plan Project(LSKJ202422)

The Xizang Autonomous Region Science and Technology Project(XZ202501ZY0056)

Abstract

The “Yarlung Zangbo River, Lhasa River and Nyangqu River” (YLN) region is the main grain producing area on which the Tibetan people depend for survival. The densities of soil organic carbon (SOC), total nitrogen (TN) and total phosphorus (TP) in farmlands are closely related to grain production. Scientific management and regulation of these nutrient densities are of great significance for ensuring food security. However, accurate simulations of spatial variations in the densities of SOC (SOCD), TN (TND) and TP (TPD) and the spatial distributions of SOCD, TND and TPD are still unclear. In this study, 388 samples of cultivated soils at 0-10 and 10-20 cm in the YLN region were collected to determine the SOC, TN, and TP contents, as well as pH and bulk density (BD). Random forest models of SOCD, TND and TPD were constructed using longitude, latitude, elevation, mean annual temperature, mean annual precipitation, mean annual radiation and vegetation index, which were then used to obtain the spatial distribution maps of SOCD, TND and TPD, and the storages of SOC (SOCS), TN (TNS) and TP (TPS). Mean annual radiation can partially explain the spatial variations of SOCD and TND, in addition to temperature and precipitation. The relative biases between modelled and observed SOCD, TND, TPD, SOCS, TNS and TPS ranged from -9.43% to 7.57%. The SOCD and TND increased from west to east, but they were both low in the middle and high in the north and south. The SOCD and TND decreased with increasing pH and BD. SOCD, TND and TPD were low at mid-elevations but high at low and high elevations. The SOCD, TND, TPD, SOCS, TNS and TPS were 2.72 kg m-2, 0.30 kg m-2, 0.18 kg m-2, 4.88 Tg, 0.54 Tg and 0.32 Tg, respectively, at 0-20 cm over the cultivated lands of the YLN region. Based on these results, the random forest models constructed in this study can be used for subsequent related studies. Besides warming and precipitation changes, radiation changes can also affect SOCD and TND. In terms of the production of food crops such as highland barley, the farmland soils in the YLN region currently can have relative deficiencies of nitrogen and phosphorus nutrients. In the future, measures such as increasing the application of organic fertilizers should be taken to improve the carbon sequestration capacity and nitrogen and phosphorus nutrition of the soil. These findings have important guiding significance for the fertilization management of cultivated lands in the YLN region and other alpine regions similar to the YLN region.

Cite this article

SUN Wei , LI Tianyu , LI Shaowei , ZHA Xinjie , HAN Fusong , HUANG Shaolin , Dorblha , CHEN Chuhong , Dawaqiongda , Luo bu , FU Gang . Modelling the Densities of Soil Organic Carbon, Total Nitrogen and Phosphorus Using Random Forest Model, and Their Spatial Distributions of Cultivated Lands in the YLN Region of Tibet[J]. Journal of Resources and Ecology, 2025 , 16(6) : 1842 -1850 . DOI: 10.5814/j.issn.1674-764x.2025.06.022

1 Introduction

Food security is the top priority of governance and an important cornerstone of economic and social development and national security; and soil quality is an important foundation for ensuring food security. As extremely important precious resources, cultivated lands are the lifeblood of food production (Liu et al., 2014). High-quality cultivated lands are an important basis for high-quality agricultural development, and healthy and high-quality cultivated lands are the premise of high and stable crop yields. As an important aspect of cultivated soil quality, soil nutrients directly affect the yield and quality of food crops. The reduction of soil organic matter and other soil nutrients will not only reduce the quality of cultivated lands and food production, threatening food security, but can also lead to the emission of soil organic carbon (SOC) to the atmosphere, exacerbating climate warming, which in turn will further reduce food production (Wu et al., 2003). Exploring the spatial distribution patterns of SOC, nitrogen and phosphorus nutrients is not only conducive to scientific fertilization management and the implementation of “grain storage in the ground”, but also an important basis for ensuring food security (Fan et al., 2022). Many scientific studies of these issues have been carried out thus far (Lu et al., 2011; Wang et al., 2023b), which provide important references for explaining the spatial differentiation mechanisms of cultivated soil nutrient contents and storage, and the scientific management of cultivated soil resources. However, there are still some inadequacies in previous studies. For example, no consistent conclusions have emerged on the relative contributions of the important factors affecting soil nutrients in cultivated lands, like temperature and precipitation (Wang et al., 2023b; Tan et al., 2024). In addition, previous studies have not paid much attention to the effects of solar radiation on soil nutrients in cultivated lands (Wang et al., 2023a). Solar radiation is clearly the source of energy for our planet, so it not only directly affects food production and thus indirectly feeds back soil nutrients, but it can also affect soil nutrients through the regulation of temperature. Recent studies have found that radiation changes do have certain exclusive effects on soil pH (Sun et al., 2023), which is closely correlated with soil nutrients (Dai et al., 2022; Ma et al., 2022). Therefore, relevant studies in the future should be strengthened to better explore the spatial differentiation of soil nutrients.
The “Yarlung Zangbo River, Lhasa River and Nyangqu River” (YLN) area is a comprehensive agricultural development zone of the Tibet Autonomous Region, and the main grain producing area on which the Tibetan people depend for survival (Zhong et al., 2005; Sang et al., 2022). Previous studies have quantified the spatial and temporal patterns of the concentrations of SOC (SOCC), total nitrogen (TNC), total phosphorus (TPC) ammonium nitrogen (NH4+-NC), nitrate nitrogen (NO3-NC) and phosphorus (APC), as well as bulk density (BD) and pH in cultivated lands of the YLN region (Cai, 2003; Zhong et al., 2005; Tan et al., 2024), which can be used to guide rational fertilization in this region. However, previous studies typically only used interpolation methods such as Kriging in the ARCGIS software to obtain soil variables for the entire YLN region (Tan et al., 2024), but they did not use the popular random forest model to spatially interpolate the soil nutrition variables in cultivated lands. Although methods such as Kriging can perform spatial interpolation, they are unable to provide temporal interpolation. Random forest models can realize the interpolation on both the spatial and temporal scales (Huang and Fu, 2023). Due to the lack of related studies, whether random forest models can quantify the soil variables of cultivated lands in the YLN region remains unclear. In addition, few studies have explored the spatial distribution patterns of the densities of SOC (SOCD, the product of SOCC and BD), total nitrogen (TND, the product of TNC and BD) and phosphorus (TPD, the product of TPC and BD) of cultivated lands in the YLN region, and the spatial distribution patterns of SOCD, TND, and TPD are expected to differ from those of SOCC, TNC, and TPC because of the trade-off between soil organic matter and BD. The amount of soil carbon sequestered by cultivated lands in the YLN region is not clear. Therefore, there is a need to strengthen research on the spatial patterns of soil carbon, nitrogen, phosphorus, pH and BD in cultivated lands in the YLN region.
The two main objectives of this study were to (1) quantify the spatial distributions and construct random forest models of soil carbon, nitrogen, phosphorus, BD and pH; and (2) estimate the soil carbon, nitrogen and phosphorus storage of cultivated lands in the YLN region.

2 Materials and methods

2.1 Study area, soil sampling and measurements

This study covered cultivated lands in the YLN region. The spatial distribution of cultivated lands of the YLN region was based on the published data in 2022 (Sang et al., 2022). Cultivated lands in the YLN region span 28.70°N-30.39°N, 87.48°E-92.46°E, and elevations of 3544-5047 m (Sang et al., 2022). The study area is 2356.15 km2. The YLN region has a warm, semi-arid climate. The mean annual temperature (MAT), mean annual precipitation (MAP) and mean annual radiation (MARad) are 1.59-8.75 ℃, 333-534 mm and 6439-7138 MJ m‒2, respectively. The data for MAT, MAP and MARad were derived from spatial raster data published in previous studies with a resolution of 1 km×1 km. The main crop planted in the YLN region is highland barley and the mean maximum normalized difference vegetation index (MNDVImax) is 0.03-0.81. The NDVI data were derived from the MODIS monthly NDVI data product (i.e., MOD13A3, 1 km×1 km).
Topsoil samples (0-10 and 10-20 cm) of 97 sampling sites (with four replicates per site) were collected in 2023. The latitude, longitude and elevation of each sampling site were obtained. Soil samples obtained with a soil drill were used for measuring the concentrations of soil organic carbon (SOCC, g kg‒1), total nitrogen (TNC, g kg‒1), total phosphorus (TPC, g kg‒1), ammonium nitrogen (NH4+-NC, mg kg‒1), nitrate nitrogen (NO3-NC, mg kg‒1), and available phosphorus (APC, mg kg‒1) as well as pH, whereas soil samples obtained with a ring knife were used to measure bulk density (BD, g cm‒3). The available N concentration was taken as the sum of NH4+-NC and NO3-NC. The methods of potassium dichromate, Kjeldahl, molybdenum-antimony resistance colorimetry, a LACHAT Quikchem Automated Ion Analyzer, ammonium bicarbonate extraction molybdenum antimony resistance colorimetry and a soil pH meter were employed to analyze SOCC, TNC, TPC, available nitrogen (NH4+-NC and NO3-NC), APC and pH, respectively. The available N:P refers to the ratio of available nitrogen to phosphorus.

2.2 Statistical analyses

All the raster data were resampled to a spatial resolution of 10 m×10 m before any other statistical analyses, because the spatial resolution of the original raster data of farmland areas is 10 m×10 m. The ratio of SOCC to TNC (C:N), ratio of SOCC to TPC (C:P), ratio of TNC to TPC (N:P), ratio of NH4+-NC to NO3-NC (NH4+-N:NO3-N), and ratio of the sum of NH4+-NC and NO3-NC to APC (available N:P) were calculated. The densities of soil organic carbon (SOCD), total nitrogen (TND) and total phosphorus (TPD) were calculated based on SOCC, TNC, TPC and BD. Univariate regression analyses were used to quantify the relationships of all soil variables, including the directly observed and calculated soil variables, with geographical location (i.e., longitude, latitude and elevation), climatic variables (MAT, MAP and MARad) and a plant variable (MNDVImax). Univariate relationships of SOCD, TND, TPD, SOCC, TNC, TPC, NH4+-NC, NO3-NC, APC, C:N, C:P, N:P, NH4+-N:NO3-N, available N:P with BD and pH were also calculated. The relationships of SOCD, TND and TPD with the concentrations and ratios of soil carbon, nitrogen and phosphorus were also quantified by univariate regression analyses. The relationships of BD and pH with the other soil variables were also analyzed.
Based on the observed geographical location, climatic variables and the plant variable, random forest models of soil variables were constructed, and their accuracies were validated. The observational data were randomly divided into two groups, one of which (75%, n=291) was used for the construction of random forest models of soil variables, while the other (25%, n=97) was used for analyzing the accuracy of the models. According to the constructed random forest models, the raster data of soil variables (10 m×10 m) of cultivated lands across the whole YLN region were obtained. However, the subsequent spatial interpolations of NH4+-NC and NH4+-N:NO3-N were not carried out due to the relatively lower R2 (<0.30) of the constructed random forests. Based on the grid data of SOCD, TND and TPD, this study estimated the total storage of soil organic carbon, total nitrogen and total phosphorus in cultivated lands in the YLN region (assuming that the >2 mm gravel content was 0).

3 Results

From south to north, SOCC, TNC, TPC, APC, C:P, N:P, SOCD and TND decreased initially and then increased, but BD increased initially and then decreased. In addition, C:N increased, but available N:P and pH decreased from south to north. From west to east, C:P, available N:P and BD decreased initially and then increased, but pH increased initially and then decreased. In addition, SOCC, TNC, APC, NO3-NC, N:P, SOCD and TND increased, but NH4+-N:NO3- N decreased from west to east. From low to high elevations, BD and C:N decreased and increased, respectively. In addition, SOCC, TNC, TPC, APC, NO3-NC, SOCD, TND and TPD decreased initially and then increased from low to high elevations. The increase in MAT caused reductions in SOCC, TNC, TPC, SOCD and TPD, an increase in available N:P, and non-linear changes in BD and C:N. The increase in MAP resulted in increases in SOCC, APC and C:P, a decline in BD, and non-linear changes in TNC, NO3-NC, SOCD, TND, C:N, NH4+-N: NO3-N and pH. The increase in MARad caused non-linear changes in SOCC, TNC, NO3-NC, APC, C:N, C:P, N:P, SOCD, and TND, and an increase in pH. APC and pH increased and decreased with increasing MNDVImax. However, NH4+-NC was independent of geographical location, climatic variables and the plant variable. SOCC, TNC, TPC, NO3-NC, APC, C:P, N:P, SOCD and TND showed trade-offs with BD, at least to some extent. Soil pH showed negative correlations with soil organic carbon, total nitrogen, nitrate nitrogen, available phosphorus, C:P, N:P, and MNDVImax. SOCD, TND and TPD showed either positive or quadratic relationships with SOCC, TNC, TPC, NO3-NC and APC. In addition, SOCD, TND and TPD had correlations with the concentration ratios of carbon, nitrogen and phosphorus.
The effects of the seven independent variables in random forest models were significant for most cases. The accuracy of the random forest models was reasonable in most cases. The spatial average soil pH values were 7.90, 7.89 and 7.89 at 0-10, 10-20 and 0-20 cm across the YLN arable lands, respectively, and the soil pH was >8 in over 42% of the areas (Figure 1). However, a few areas of arable soils (0.01%, 0.18% and 0.19% at 0-10, 10-20 and 0‒20 cm, respectively) were weakly acidic (pH≥6.88, ≥6.61 and ≥6.65 at 0‒10, 10-20 and 0-20 cm, respectively) (Figure 1). The spatial mean BD and available N:P values were 1.15, 1.18 and 1.17 g cm‒3, and 0.66, 0.78 and 0.72 at 0-10, 10-20 and 0-20 cm, respectively (Figures 1-2). The spatial mean values of cultivated lands over the YLN region were 12.21 g kg‒1, 11.41 g kg‒1 and 11.71 g kg‒1 for SOCC; 1.35 g kg‒1, 1.31 g kg‒1 and 1.32 g kg‒1 for TNC; 0.79 g kg‒1, 0.78 g kg‒1 and 0.78 g kg‒1 for TPC; 9.78 mg kg‒1, 10.22 mg kg‒1 and 10.13 mg kg‒1 for NO3-NC; and 10.05 mg kg‒1, 19.08 mg kg‒1 and 19.85 mg kg‒1 for APC at 0-10, 10-20 and 0-20 cm, respectively (Figures 2-3). The spatial mean values of cultivated lands over the YLN region were 9.03, 8.98 and 8.96 for C:N; 15.93, 15.36 and 15.49 for C:P; and 1.79, 1.79 and 1.77 for N:P at 0-10, 10-20 and 0-20 cm, respectively (Figure 4). The spatial mean values of cultivated lands across the YLN region were 1.35 kg m‒2, 1.33 kg m‒2 and 2.72 kg m‒2 for SOCD; 0.15 kg m‒2, 0.15 kg m‒2 and 0.30 kg m‒2 for TND; and 0.09 kg m‒2, 0.09 kg m‒2 and 0.18 kg m‒2 for TPD at 0-10, 10-20 and 0-20 cm, respectively (Figure 5). The storages of cultivated lands in the YLN region were 2.43 Tg, 2.39 Tg and 4.88 Tg for organic carbon; 0.27 Tg, 0.27 Tg and 0.54 Tg for total nitrogen; and 0.16 Tg, 0.16 Tg and 0.32 Tg for total phosphorus at 0-10, 10-20 and 0-20 cm, respectively (Figure 5).
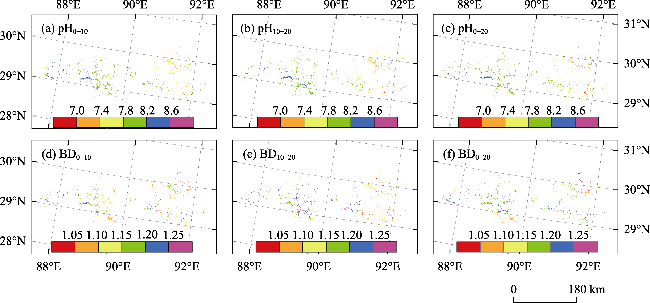
Figure 1 Spatial distributions of soil (a) pH at 0-10 cm (pH0-10), (b) pH at 10-20 cm (pH10-20), (c) pH at 0-20 cm (pH0-20), (d) bulk density (BD, g cm‒3) at 0-10 cm (BD0-10), (e) BD at 10-20 cm (BD10-20) and (f) BD at 0-20 cm (BD0-20)

e: In the legends, each number corresponds to the boundary value of two colors. The same below.

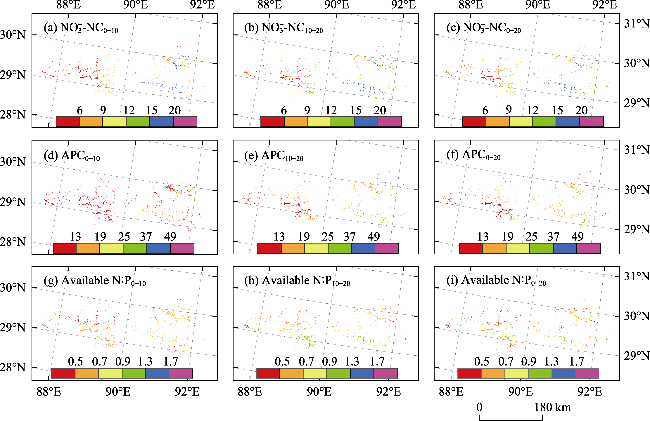
Figure 2 Spatial distributions of soil (a) nitrate nitrogen concentration (NO3-NC, mg kg‒1) at 0-10 cm (NO3-NC0-10), (b) NO3-NC at 10-20 cm (NO3-NC10-20), (c) NO3-NC at 0-20 cm (NO3-NC0-20), (d) available phosphorus concentration (APC, mg kg‒1) at 0-10 cm (APC0-10), (e) APC at 10-20 cm (APC10-20), (f) APC at 0-20 cm (APC0-20), (g) ratio of available nitrogen to phosphorus (available N:P) at 0-10 cm (available N:P0-10), (h) available N:P at 10-20 cm (available N:P10-20) and (i) available N:P at 0-20 cm (available N:P0-20)
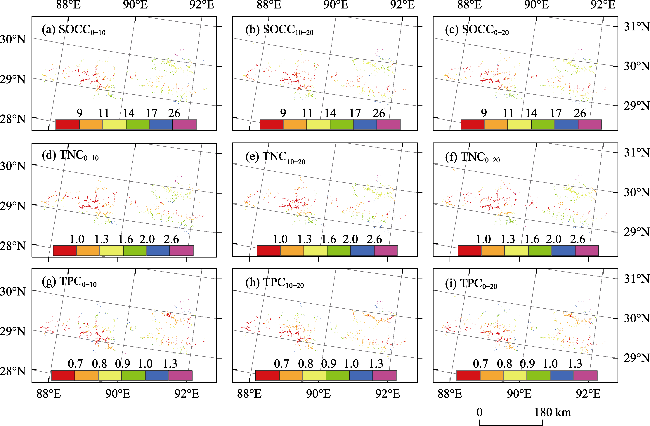
Figure 3 Spatial distributions of soil (a) organic carbon concentration (SOCC, g kg‒1) at 0-10 cm (SOCC0-10), (b) SOCC at 10-20 cm (SOCC10-20), (c) SOCC at 0-20 cm (SOCC0-20), (d) total nitrogen concentration (TNC, g kg‒1) at 0-10 cm (TNC0-10), (e) TNC at 10-20 cm (TNC10-20), (f) TNC at 0-20 cm (TNC0-20), (g) total phosphorus concentration (TPC, g kg‒1) at 0-10 cm (TPC0-10), (h) TPC at 10-20 cm (TPC10-20) and (i) TPC at 0-20 cm (TPC0-20)
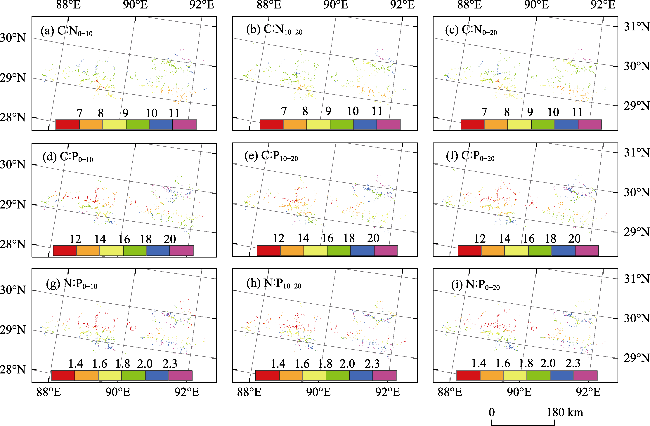
Figure 4 Spatial distributions of the (a) ratio of soil organic carbon to total nitrogen (C:N) at 0-10 cm (C:N0-10), (b) C:N at 10-20 cm (C:N10-20), (c) C:N at 0-20 cm (C:N0-20), (d) ratio of soil organic carbon to total phosphorus (C:P) at 0-10 cm (C:P0-10), (e) C:P at 10-20 cm (C:P10-20), (f) C:P at 0-20 cm (C:P0-20), (g) ratio of total nitrogen to total phosphorus (N:P) at 0-10 cm (N:P0-10), (h) N:P at 10-20 cm (N:P10-20) and (i) N:P at 0-20 cm (N:P0-20)
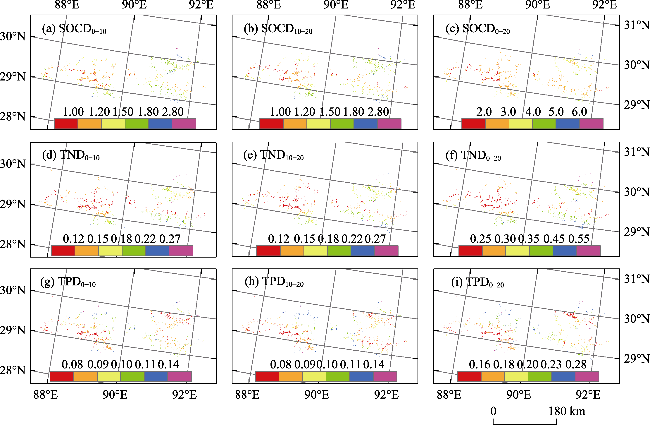
Figure 5 Spatial distributions of soil (a) organic carbon density (SOCD, kg m‒2) at 0-10 cm (SOCD0-10), (b) SOCD at 10-20 cm (SOCD10-20), (c) SOCD at 0-20 cm (SOCD0-20), (d) total nitrogen density (TND, kg m‒2) at 0-10 cm (TND0-10), (e) TND at 10-20 cm (TND10-20), (f) TND at 0-20 cm (TND0-20), (g) total phosphorus density (TPD) at 0-10 cm (TPD0-10, kg m‒2), (h) TPD at 10-20 cm (TPD10-20) and (i) TPD at 0-20 cm (TPD0-20)

4 Discussion

Some previous studies found that compared with temperature and precipitation, the effects of radiation on soil pH, the carbon, nitrogen and phosphorus concentrations and their ratios in alpine grasslands of the Qinghai-Tibet Plateau cannot be ignored (Sun et al., 2023; Zhang and Fu, 2024). This study found that, in addition to the aforementioned soil variables, the effects of radiation changes on soil bulk density, available nitrogen and phosphorus, and their ratios should also be accounted for in alpine farmland soils, at least in the YLN region. However, current studies on the impact of climate change on alpine ecosystems on the Qinghai-Tibet Plateau are still mainly concerned with climate warming and precipitation changes (Jing et al., 2018; Chen et al., 2020). As one of the important features of the Tibetan Plateau, intense radiation has not received enough attention, although declining solar radiation in the past 20 years is one of the important characteristics of climate change (Huang and Fu, 2023). Therefore, in the future, we should strengthen studies on the impacts of radiation changes on alpine ecosystems of the Qinghai-Tibet Plateau.
In this study, longitude, latitude, elevation, temperature, precipitation, radiation and NDVI together had stronger abilities to explain soil total nitrogen and phosphorus concentrations and their ratios than the available nitrogen and phosphorus concentrations and their ratios. The prediction accuracies of random forest models of soil total nitrogen and phosphorus and their ratio were also higher than those of random forest models of soil available nitrogen and phosphorus and their ratio. Compared with NH4+-NC, the interpretation ability of environmental factors on NO3-NC and the prediction accuracy of NO3-NC by random forest models were higher, which was similar to previous studies (Liang et al., 2016). These phenomena may be related to interference from human activities, especially fertilizer management measures (He et al., 2020). Besides the nitrogen and phosphate mineralization of soil organic matter, the more important source of soil available nitrogen and phosphorus in cultivated lands of the YLN region was actually external inorganic fertilizer, which may even contribute more than the decomposition of soil organic matter led by microorganisms (Yang, 2021). The application amounts and fertilization depths of inorganic fertilizers in different regions may vary greatly, which could weaken the spatial distribution of soil available nitrogen and phosphorus and their relationships with climatic and plant variables. In addition, the nitrogen fertilizer in the YLN region may be mainly ammonium fertilizers (i.e., diamine hydrogen phosphate) rather than nitrate nitrogen fertilizers.
The soil nutrients of cultivated lands of the YLN region in 2023 differed from previous years (Liu et al., 2014; Ma et al., 2015). The SOCC, TNC and BD levels were similar to those in 1990, but TPC and the available nitrogen concentration were lower while APC was greater (Cai, 2003). The SOCC, TNC and APC were greater, but TPC, the available nitrogen concentration and BD were lower than those of 2001 (Cai, 2003). Compared to 2020-2021, SOCC, TNC and soil alkalinity increased, but TPC and BD decreased (Tan et al., 2024). However, compared to the 1960s, SOCC and TNC were reduced by about 77% and 34%, respectively (Ma et al., 2015). These findings indicated that SOCC, TNC and/or BD may have recovered to 1990s levels but not 1960s levels, while TPC and available nitrogen concentration might have decreased, and APC increased compared to the 1990s. The habitual long-term use of phosphate fertilizers was likely to be an important reason for the increase in APC (Liu et al., 2014). The reduction in the amount of organic fertilizers was the main reason for the decline in SOCC, but applications of inorganic fertilizer, the promotion of high-yield varieties and improvements in the multiple cropping index were also important reasons for the depletion of soil nutrients (Ma et al., 2015). Most farmers in Tibet raise cattle and sheep, so the straw and weeds produced in cultivated lands are used as livestock feed and livestock manure is used as fuel, which may further reduce carbon feedback to the soils. The SOCC of cultivated lands across the YLN region in 2023 was still much lower than that of the National Cultivated Land Fertility Evaluation in 2014 (14.30 g kg‒1) and Hubei Province in 2007 (13.45 g kg‒1) (Miao et al., 2022; Zhao et al., 2023; Tan et al., 2024). Therefore, although the SOCC of cultivated lands in the YLN region recovered somewhat, it was still insufficient and at the middle-lower level for China. Cultivated soils in the YLN region may still have about four times the current carbon sequestration potential, given that the current SOCC is less than one-quarter of the 1960s level. In other words, probably 14.64 Tg of cultivated soil organic carbon in the YLN region could have been released into the atmosphere since the 1960s.
The soil nutrient status and pH of cultivated lands in the YLN region were different from those of the other regions in Tibet, and the cultivated soil quality in the YLN region was not the best in Tibet (Zhong et al., 2005; Ma et al., 2015; Xu et al., 2016). Compared with Motuo County of Tibet, the SOCC and available nitrogen concentration over the YLN region were lower, but APC was higher (Yang, 2021). The SOCC, TNC and TPC of cultivated lands across the YLN region were also lower than those of Longzi County, Tibet, while NO3-NC was higher (Liang et al., 2016). By contrast, the SOCC and TNC of cultivated lands across the YLN region were greater than those of cultivated lands in western Tibet, but the APC and soil alkalization were lower (Xu et al., 2023). The differences of leaching amplitude and Ca2+ due to different soil types and climatic conditions may be the reasons for the difference in soil pH of cultivated lands among the different areas of Tibet (Zhong et al., 2005). The leaching of soil NO3-N may be an important cause of soil acidification (Sun et al., 2023), and NO3-NC can affect its capacity to buffer soil acidification, so the spatial variation of NO3-NC may also change the spatial distribution pattern of soil pH. In turn, spatial changes in soil pH can affect the spatial distribution of soil organic matter and nitrogen and phosphorus nutrients by influencing plant growth and microbial activities (Zhong et al., 2005). The suitable climatic conditions for different varieties and species of crops are different, so the types and planting methods of crops cultivated in different regions of Tibet, as well as crop straw yields, may also be different (Liu et al., 2014; Liang et al., 2016). Various climatic conditions can affect the microbe-mediated decomposition of plant and animal residues and thus affect the input of soil organic matter into soils (Liang et al., 2016). Organic fertilizer is one of the most important sources of soil organic matter, but the amounts of organic fertilizer and fertilizer types in different regions are different (Liang et al., 2016). These are important reasons for the spatial variations in the distribution of soil organic matter in cultivated lands, which in turn can also affect the spatial distributions of soil nitrogen and phosphorus nutrients and bulk density (Zhong et al., 2005; Liang et al., 2016).
The SOCD of cultivated lands in the 0-20 cm soil layer across the YLN region in 2023 was similar to the mean SOCD of cultivated lands in China during 1980-1990 (2.63-2.77 kg m‒2) (Yu et al., 2009), dry farmland soils in Shandong Province during 1980-2016 (2.37-2.59 kg m‒2) (Tang et al., 2020) and cultivated lands in Beijing (2.25 kg m‒2) (Kong et al., 2019), but lower than that of Hubei Province in 2007 (3.37 kg m‒2) (Miao et al., 2022). In addition, the SOCD of cultivated lands in the YLN region was also much lower than the 4.96-17.76 kg m‒2 level of alpine grasslands on the Qinghai-Tibet Plateau (Zhang et al., 2022), which may be related to the reduced long-term investment in organic fertilizer by local residents, and the use of crop straw for livestock feed. Therefore, cultivated soils in the YLN region should still have great potential for additional carbon sequestration, and efforts should be made to improve the current situation of fertilizer management.
Tradeoffs of soil organic carbon and total nitrogen with BD and pH were observed. This may be due to several reasons. First, the activities of soil microorganisms are usually strong in neutral and alkaline soils, but decrease in acidic soils (Mu et al., 2016; Sun et al., 2023), which may result in high organic matter in acidic soils. Soil organic matter can decompose and release some specific organic acids, thereby reducing the pH of alkaline soils with a high pH, whereas soil organic matter has the ability to increase the pH of acid soils with a low pH (Liang et al., 2016). Soils with high organic matter are generally looser because the organic matter can increase soil porosity and structural stability, thereby reducing soil BD. In contrast, the contact area between soil particles is greater in soils with low organic matter, which makes these soils more compact and correspondingly increases soil BD. Second, soils with high BD may be poor in terms of water, oxygen and nutrient mobility, which limits plant growth, thus reducing the feedback of plant litter and root exudates to the soil.

5 Conclusions

The main objectives of this study were to 1) construct random forest models of SOCD, TND and TPD, and 2) use them to examine the spatial variations of these soil variables. The relative bias and root mean square error values between the modelled and observed data ranged from -9.43% to 7.57%, and 0.01 to 7.59, respectively. The soil organic carbon concentration and density, total nitrogen concentration and density, available phosphorus concentration and nitrate nitrogen concentration increased from west to east. The soil organic carbon concentration and density, total nitrogen concentration and density, total phosphorus concentration and available phosphorus concentration were low in the middle and high in the north and south, but bulk density was high in the middle and low in the north and south. These data can help to guide improvements in soil fertilizer management in this region in the future.
[1]
Cai X B. 2003. Characteristics of soil degradation of the “Three River” region in Tibet. Soil Fertilizer, 3: 4-7.

[2]
Chen Y, Feng J G, Yuan X, et al. 2020. Effects of warming on carbon and nitrogen cycling in alpine grassland ecosystems on the Tibetan Plateau: A meta-analysis. Geoderma, 370: 114363. DOI: 10.1016/j.geoderma.2020.114363.

[3]
Dai L J, Ge J S, Wang L Q, et al. 2022. Influence of soil properties, topography, and land cover on soil organic carbon and total nitrogen concentration: A case study in Qinghai-Tibet Plateau based on random forest regression and structural equation modeling. Science of the Total Environment, 821: 153440. DOI: 10.1016/j.scitotenv.2022.153440.

[4]
Fan M M, Margenot A J, Zhang L M, et al. 2022. Soil organic carbon dynamics in intensively managed agricultural landscapes of eastern China. Archives of Agronomy and Soil Science, 68(4): 503-515.

DOI

[5]
He G D, Zhang Z M, Zhang J C, et al. 2020. Soil organic carbon dynamics and driving factors in typical cultivated land on the Karst Plateau. International Journal of Environmental Research and Public Health, 17(16): 5697. DOI:10.3390/ijerph17165697.

[6]
Huang S L, Fu G. 2023. Impacts of climate change and human activities on plant species α-diversity across the Tibetan grasslands. Remote Sensing, 15: 2947. DOI: 10.3390/rs15112947.

[7]
Jing X, Chen X, Xiao W, et al. 2018. Soil enzymatic responses to multiple environmental drivers in the Tibetan grasslands: Insights from two manipulative field experiments and a meta-analysis. Pedobiologia, 71: 50-58.

DOI

[8]
Kong X B, Hu Y J, Li Y, et al. 2019. Distribution and influencing factors of soil organic carbon of cultivated land topsoil in Beijing. Resources Science, 41(12): 2307-2315. (in Chinese)

DOI

[9]
Liang K, Zhou Z. Liu L, et al. 2016. Characteristics of soil nutrient contents of five different cultivated lands in Longzi County, Tibet. Pratacultural Science, 33(6): 1054-1061. (in Chinese)

[10]
Liu G Y, Nimazhaxi, Song G Y, et al. 2014. Analysis of soil nutrients limiting factors for barley production in centre Tibet. Chinese Journal of Agrometeorology, 35(3): 276-280. (in Chinese)

[11]
Lu M, Zhou X H, Luo Y Q, et al. 2011. Minor stimulation of soil carbon storage by nitrogen addition: A meta-analysis. Agriculture Ecosystems & Environment, 140(1-2): 234-244.

DOI

[12]
Ma Y J, Xie T, Li X Y. 2022. Spatial variation of soil organic carbon in the Qinghai Lake watershed, northeast Qinghai-Tibet Plateau. Catena, 213: 106187. DOI: 10.1016/j.catena.2022.106187.

[13]
Ma Y P, Wei Z X, Zhuoma. 2015. Research progress and prospects of soil organic matter of Tibet farmland. Chinese Agricultural Science Bulletin, 31(11): 243-247. (in Chinese)

DOI

[14]
Miao J, Xie T, Han S T, et al. 2022. Characteristics of soil organic carbon in croplands and affecting factors in Hubei Province. Agronomy-Basel, 12(12): 3025. DOI: 10.3390/agronomy12123025.

[15]
Mu C C, Zhang T J, Zhang X K, et al. 2016. Pedogenesis and physicochemical parameters influencing soil carbon and nitrogen of alpine meadows in permafrost regions in the northeastern Qinghai-Tibetan Plateau. Catena, 141: 85-91.

DOI

[16]
Sang Y M, Lu Y H, Wang X, et al. 2022. Data set of cultivated land distribution in “one river and two rivers” region of Qinghai-Tibet Plateau. Journal of Global Change Data & Discovery, 6(4): 627-638.

[17]
Sun W, Li S W, Zhang G Y, et al. 2023. Effects of climate change and anthropogenic activities on soil pH in grassland regions on the Tibetan Plateau. Global Ecology and Conservation, 45: e02532. DOI: 10.1016/j.gecco.2023.e02532.

[18]
Tan G F, Wang Z F, Zhang Y L, et al. 2024. Spatial differentiation of cropland soil organic carbon and influencing factors in the YNL River region of Tibet. Chinese Journal of Ecology, 43(6): 1824-1832. (in Chinese)

[19]
Tang M, Wang S, Zhao M, et al. 2020. Simulated soil organic carbon density changes from 1980 to 2016 in Shandong Province dry farmlands using the CENTURY Model. Sustainability, 12(13): 5384. DOI: 10.3390/su12135384.

[20]
Wang S, Wang Z, Zhuang Q, et al. 2023a. Assessing the carbon sequestration potential and identifying influential factors of cultivated soils in Northeast China. Geoderma Regional, 33: e00655. DOI: 10.1016/j.geodrs.2023.e00655.

[21]
Wang Z W, Huang L M, Shao M A. 2023b. Spatial variations and influencing factors of soil organic carbon under different land use types in the alpine region of Qinghai-Tibet Plateau. Catena, 220: 106706. DOI: 10.1016/j.catena.2022.106706.

[22]
Wu H B, Guo Z T, Peng C H. 2003. Distribution and storage of soil organic carbon in China. Global Biogeochemical Cycles, 17(2): 1048. DOI: 10.1029/2001gb001844.

[23]
Xu T, Shi W G, Liu K L, et al. 2023. Evaluation on cultivated land soil quality in western Qinghai-Tibet Plateau. Chinese Agricultural Science Bulletin, 39(21): 75-82. (in Chinese)

DOI

[24]
Xu X, Liu H M, Zhou T, et al. 2016. Preliminary study on soil fertility and heavy metal concentrations of croplands in Nyingchi Valley of Tibet. Soils, 48(1): 131-138. (in Chinese)

[25]
Yang S. 2021. Current situation and distribution characteristics of soil nutrients in cultivated land of Motuo County. Chinese Agricultural Science Bulletin, 37(22): 84-89. (in Chinese)

DOI

[26]
Yu Y, Guo Z, Wu H, et al. 2009. Spatial changes in soil organic carbon density and storage of cultivated soils in China from 1980 to 2000. Global Biogeochemical Cycles, 23: 3428. DOI: 10.1029/2008gb003428.

[27]
Zhang C, Zhao X, Xin Y, et al. 2022. Carbon storage and distribution of grassland ecosystems in Qinghai Province. Journal of Beijing Normal University (Natural Science), 58(2): 286-292. (in Chinese)

[28]
Zhang G, Fu G. 2024. Changes in soil organic carbon, total nitrogen and total phosphorus in 2000-2020 and their driving mechanisms in Tibetan alpine grasslands. Global and Planetary Change, 239: 104484. DOI: 10.1016/j.gloplacha.2024.104484.

[29]
Zhao Y, Li Y, Ma P, et al. 2023. Three dimensional changes of soil organic carbon content and its key factors in cultivated soils of Henan Province during the recent 30 years. Acta Pedologica Sinica, 60(5): 1409-1420. (in Chinese)

[30]
Zhong G H, Tian F Y, Wang M, et al. 2005. Study on farmland soil fertility in main agricultural areas of Tibet. Acta Pedologica Sinica, 42: 1030-1034. (in Chinese)

Outlines

/