Special Column: Digital Empowerment and Human Settlements Environment

Plant Species Diversity and Landscape Evaluation Analysis of Hutuo River Urban Forest Park

  • SUN Wenyan ,
  • LI Jing , *
Expand
  • Hebei Academy of Fine Arts, Shijiazhuang 050700, China
* LI Jing, E-mail:

SUN Wenyan, E-mail:

Received date: 2025-05-27

  Accepted date: 2025-09-30

  Online published: 2025-11-28

Abstract

This study employs field surveys of plant diversity and the Analytic Hierarchy Process (AHP) to assess plant diversity and evaluate landscape quality in the Hutuo River Urban Forest Park. A total of 257 plant species belonging to 64 families and 184 genera were recorded, and they show a multi-layered tree-shrub-herb structure that is characteristic of warm temperate urban forests. An evaluation framework for the plant landscape was established that integrates ecological community structure, plant diversity, landscape aesthetics, recreational space planning, and cultural attributes. The results show that ecological structure and species diversity contribute the most to overall evaluation scores, underscoring the central role of ecological attributes in landscape assessment. While the current plant landscape demonstrates integrity in vertical layering and richness in species composition, deficiencies remain in seasonal continuity, cultural expression, and winter ornamental value. These findings highlight both the ecological strengths and developmental gaps of the park. This study provides a scientific foundation for the conservation of plant resources, the improvement of landscape quality, and the promotion of ecological sustainability in urban forest parks.

Cite this article

SUN Wenyan , LI Jing . Plant Species Diversity and Landscape Evaluation Analysis of Hutuo River Urban Forest Park[J]. Journal of Resources and Ecology, 2025 , 16(6) : 1756 -1766 . DOI: 10.5814/j.issn.1674-764x.2025.06.014

1 Introduction

Against the backdrop of accelerating urbanization, urban green spaces play an increasingly vital role in maintaining ecological balance, improving environmental quality, and meeting the recreational needs of residents. As a core ecological corridor in Shijiazhuang City, the Hutuo River Urban Forest Park serves both ecological and recreational functions. Plants are the core element of the park, so their diversity and the rationality of their configuration directly affect ecological stability, aesthetic value, and recreational quality. However, existing research has largely focused on macro-level green space planning or plant applications in specific functional areas, so a systematic investigation into the plant resources of important urban forest parks is lacking, especially a comprehensive quantitative evaluation that integrates landscape ecological value and recreational func-tionality (He and Zhang, 2019). Similar challenges have been reported in international contexts, where studies of urban forest parks in Europe and North America emphasize integrating biodiversity conservation with recreational services to support ecological sustainability (Qiu et al., 2013; Matthies et al., 2015). The absence of such foundational data and comprehensive assessments hinders effective decision-making for the protection of plant resources, scientific management, and sustainable landscape optimization of the park.
This study focuses on the Hutuo River Urban Forest Park and pursues three objectives. First, baseline information on plant resources was obtained through field surveys and quadrat sampling, with particular emphasis on tree species diversity and community structure. Second, an integrated evaluation system that incorporates ecological community structure, landscape aesthetics, cultural attributes of plant landscapes, recreational space design, and plant diversity was established. This approach aims to transcend the limitations of traditional subjective assessments and achieve a multidimensional analysis of plant landscapes. Finally, based on the survey and evaluation results, the current strengths and weaknesses in plant resource utilization and landscape construction were systematically diagnosed. Targeted optimization strategies are then proposed to provide a scientific basis for enhancing the quality of plant landscapes, strengthening ecosystem service functions, and improving recreational experiences in the park.

2 Study area and methods

2.1 Study area

The Hutuo River Urban Forest Park is situated in the northern part of Shijiazhuang City, Hebei Province, west of the ancient Zhengding City. Its geographical coordinates range from 113°45′E to 114°15′E and from 38°09′N to 38°30′N, spanning both the north and south banks of the western section of the Hutuo River, with a total planned area of 15240 ha. The park takes the natural course of the western Hutuo River as its ecological axis, integrating floodplains on both banks, seasonal inundation wetlands, and artificially restored forest belts to form a continuous “one river, two banks” ecological corridor. The regional water system receives ecological water replenishment through the South-to- North Water Diversion Project and operates under a coordinated regulation mechanism with the upstream Gangnan and Huangbizhuang reservoirs, thus ensuring the hydrological stability of the wetlands. According to the classification system of the Ramsar Convention (National Standardization Administration of China, 2009), the park encompasses various wetland types, including permanent inland rivers, seasonal floodplain wetlands, and artificial water diversion channels, so it reflects an organic integration of natural wetlands and human-made hydraulic infrastructure.
According to statistical data, the region hosts 257 plant species, belonging to 64 families and 184 genera, with Poaceae, Asteraceae, and Fabaceae identified as the dominant families. The vegetation types encompass six major categories: trees, shrubs, herbs, lianas, bamboos, and ground-cover plants. Land use is primarily oriented toward ecological restoration, with water bodies (3810 ha), forested land (5490 ha), wetlands (3120 ha), and cultivated land (1830 ha) accounting for 25.0%, 36.0%, 20.5%, and 12.0% of the total area, respectively. The forested land comprises 3200 ha of ecological protection forests, 1020 ha of fruit orchards, and 1270 ha of fast-growing plantations. The forest coverage rate in the area is 36.0%.

2.2 Methods

This study focuses on the Hutuo River Urban Forest Park. Based on the site conditions and vegetation distribution characteristics of the park, and taking into comprehensive consideration plant growth habits, ornamental traits, and landscape functions (Liang et al., 2023), a combined approach of comprehensive field reconnaissance and systematic sampling was adopted. Initially, a full-range field survey was conducted to determine the overall layout of the plant landscape. On this basis, random quadrat sampling and transect methods (Lu and Li, 2009) were employed to establish survey points. Within each quadrat, detailed measurements and records were made for the trees, shrubs, and herbaceous plants, including species identification, quantity, height, crown width, and coverage. These efforts were supplemented by photography and specimen collection to support species identification and document landscape features (Alba et al., 2021). The raw data were input, organized, and statistically analyzed using Excel, which provided a data foundation for subsequent diversity analysis and landscape evaluation.

2.3 Data processing

This study employed the Analytic Hierarchy Process (AHP) and used the 1-9 scale method proposed by Thomas L. Saaty (Qiao, 2001) (Table 1) to assign values for pairwise comparisons of the relative importance among elements. Judgment matrices were constructed based on the relative comparison values among elements within the same hierarchy (Table 2).
Table 1 Judgment matrix 1-9 scaling method and its meaning
Scale Definition
1 Elements “p” and “q” are equally important
3 Element “p” is slightly more important than “q
5 Element “p” is moderately more important than “q
7 Element “p” is strongly more important than “q
9 Element “p” is extremely more important than “q
2, 4, 6, 8 Intermediate values between two adjacent judgments

Note: “p” corresponds to the element in the p-th row, and “q” specifies the element in the q-th column of the matrix.

Table 2 Judgment matrix of pairwise comparisons
A B1 B2 ... Bq
B1 1 B12 ... B1q
B2 B21 1 ... B2q
... ... ... ... ...
Bp Bp1 Bp2 ... Bpq

Note: A denotes the judgment matrix, and B represents an element within it. If the importance ratio of element “p” to element “q” is Bpq, then the importance ratio of element “q” to element “p” is 1/Bpq.

For the calculation of relative weights and consistency validation, the weight vector W and the maximum eigenvalue λmax were derived using the integration method. The specific computational steps are as follows.
Each column of judgment matrix A at every hierarchical level was normalized as follows:
$\bar{A}_{p q}=A_{p q} / \sum_{p=1}^{n} A_{p q} \quad(p, q=1,2, \cdots n)$
The elements of each column were summed for each row:
$\bar{w}_{p}=\sum_{q=1}^{n} \bar{A}_{p q} \quad(p, q=1,2, \cdots n)$
The weight vector W was normalized:
$w_{p}=\bar{w}_{p} / \sum_{p=1}^{n} \bar{w}_{p}$
Then, W = (w1, w2, ..., wn)T is the eigenvector.
The maximum eigenvalue λmax was calculated:
$\lambda_{\max }=\sum_{p=1}^{n} \frac{(A W)_{p}}{n w_{p}}$
where A denotes the judgment matrix, W represents the eigenvector, n indicates the order of the judgment matrix, p corresponds to the element in the p-th row, and q specifies the element in the q-th column of the matrix.
Consistency was checked:
$C I=\frac{\lambda_{\max }-n}{n-1}$
$C R=\frac{C I}{R I}$
A judgment matrix is considered consistent and acceptable if the consistency ratio (CR) is ≤0.10; otherwise, it fails the consistency check. The specific values of the random consistency index (RI) are provided in Table 3.
Table 3 Average random consistency index
n 1 2 3 4 5 6 7 8 9
RI 0 0 0.58 0.9 1.12 1.24 1.32 1.41 1.45

3 Results and analysis

3.1 Investigation results and analysis of plant resources

3.1.1 Composition of plant life forms

Based on quadrat survey methods and the life-form classification system outlined in Vegetation of China (Editorial Committee of Vegetation of China, 1980), a total of 257 landscape plant species belonging to 64 families and 184 genera were recorded in the Hutuo River Urban Forest Park. These species were categorized into six life forms: trees, shrubs, herbs, lianas, bamboos, and ground-cover plants. Among them, trees constituted 82 species from 28 families and 53 genera, and serve as the dominant constructive layer in the plant community. Shrubs, comprising 67 species from 22 families and 41 genera, together with herbaceous plants—89 species from 39 families and 72 genera—form the understory and ground cover layers, respectively. Lianas were represented by 11 species across 7 families and 9 genera. Bamboos included only 4 species within 1 family and 2 genera, while ground-cover plants consisted of 4 species from 3 families and 3 genera. Both bamboos and ground- cover plants exhibited mono-dominant distribution patterns. Overall, the trees, shrubs, and herbs accounted for 92.5% of the total species, thus forming the principal framework of the park’s vegetation structure. Detailed statistics are presented in Table 4.
Table 4 Statistics of the plant life forms in Hutuo River Urban Forest Park
Life form Trees Shrubs Herbs Lianas Bamboos Ground-
cover plants
Total
Number 82 67 89 11 4 4 257
Percentage (%) 31.9 26.0 34.6 4.3 1.6 1.6 100
To visually represent the composition of plant resource types, a line graph illustrating the life-form spectrum was constructed based on data from Table 4 (Figure 1).
Figure 1 Life-form distribution of plant species in Hutuo River Urban Forest Park
As shown in Figure 1, the proportional distribution of total species among trees, shrubs, herbs, lianas, bamboos, and ground-cover plants was 19.9 : 16.3 : 21.6 : 2.7 : 1 : 1, indicating that trees, shrubs, and herbs dominate the plant species composition. Collectively, those three groups amount to 238 species, accounting for 92.5% of the total recorded species, thereby forming the dominant framework of the plant landscape in Hutuo River Urban Forest Park.
Trees are primarily planted in the green spaces of the park as groups, in clusters, or as street trees. Styphnolobium japonicum (L.) Schott, Platanus × acerifolia (Aiton) Willd., Salix babylonica L., Fraxinus chinensis Roxb., Cedrus deodara (Roxb.) G. Don, Pinus tabuliformis Carr., Prunus cerasifera Atropurpurea’, Ginkgo biloba L., Cotinus coggygria var. cinereus Engl., and Acer pictum subsp. mono (Maxim.) H. Ohashi are commonly used in the upper canopy layer of grouped plant landscapes. By employing the mass planting of trees to form woodlands, the park has created distinctive forest landscapes that provide year-round evergreen coverage as well as seasonal color variation. Among these, several colored-leaf ornamental species significantly enhance the seasonal dynamics and visual interest of the green spaces.
Lianas are relatively abundant around pavilions, corridors, and rock arrangements, with species such as Hedera nepalensis var. sinensis (Tobl.) Rehd., Lonicera japonica Thunb., Campsis grandiflora (Thunb.) Schum., Morden cvs. of Chlimbers and Ramblers, and Parthenocissus tricuspidata (Siebold and Zucc.) Planch. being frequently employed. Along the water edges, commonly used plants include Lythrum salicaria L., Iris pseudacorus L., Phragmites australis (Cav.) Trin. ex Steud., Thalia dealbata Fraser ex Roscoe, and Nelumbo nucifera Gaertn. These species effectively enhance the layered structure and ecological diversity of the riparian landscape.
In contrast, aquatic plants, lianas, and bamboos are applied in relatively limited quantities. These plant types— lianas, bamboos, and ground-cover species—are mostly used in localized nodal landscapes or serve as accent elements. Through rational integration with trees, shrubs, and herbs, they contribute to the spatially well-defined and diverse plant landscapes. Their combination with the arboreal, shrub, and herbaceous layers enriches the vertical structure and spatial configuration of the plant communities, collectively creating distinct stratification and varied landscape effects. As such, they constitute an indispensable component of the park’s plant configuration.

3.1.2 Ornamental characteristics of the plants

Based on differences in ornamental plant organs, they can be categorized into five major types: plants valued for form, flowering ornamentals, foliage ornamentals, fruit ornamentals, and stem ornamentals. The statistical results for each of these categories are detailed in Table 5.
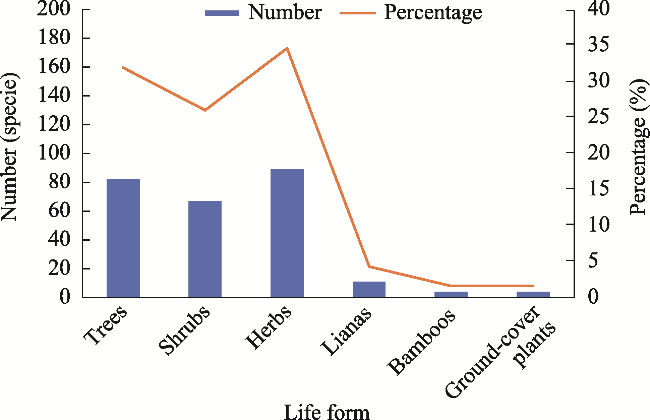
Table 5 Distribution of plant species in Hutuo River Urban Forest Park by ornamental characteristics
Plants valued for form Foliage ornamentals Flowering ornamentals Fruit ornamentals Stem ornamentals Total number
Number of species Percentage
(%)
Number of species Percentage
(%)
Number of species Percentage
(%)
Number of species Percentage
(%)
Number of species Percentage
(%)
68 26.5 74 28.8 73 28.4 31 12.1 11 4.3 257
To visually represent the composition of ornamental plant types, a line chart was generated based on the statistical data of plant ornamental characteristics presented in Table 5 (Figure 2).
Figure 2 Distribution of plant ornamental characteristics in Hutuo River Urban Forest Park
As shown in Figure 2, the plant landscape composition of Hutuo River Urban Forest Park is dominated by plants valued for form, foliage ornamentals, and flowering ornamentals, which collectively account for 83.7% of the total species and form the fundamental framework and seasonal character of the park. Among these, foliage ornamentals show the highest species richness (74 species, 28.8%), reflecting a design emphasis on creating diverse seasonal landscapes through variations in leaf color and form. Flowering ornamentals (73 species, 28.4%) and plants valued for form (68 species, 26.5%) are similarly represented, indicating a balanced consideration of the overall spatial structure and floral color impact during the flowering season. In comparison, fruit ornamentals (31 species, 12.1%) and stem ornamentals (11 species, 4.3%) are less utilized, suggesting potential for further enhancing the autumn and winter scenery, enriching ecological interest, and highlighting the aesthetic value of bark and stem structures in the winter season. Overall, the plant landscape configuration demonstrates a clear hierarchy and rational composition, and it embodies a design philosophy that integrates ecological foundations with equal emphasis on floral and foliar appeal, and coordinates plant form and color throughout the seasons.

3.2 Results and analysis of the landscape assessment

This study employed the Analytic Hierarchy Process (AHP) to conduct a systematic evaluation of the plant landscape in Hutuo River Urban Forest Park. This evaluation thoroughly analyzed plant configuration patterns and landscape characteristics and identified existing issues, and then targeted optimization strategies are proposed based on the results. The aim is to provide a scientific basis and theoretical reference for future planning, construction, and sustainable development of the park.

3.2.1 Establishment and analysis of evaluation indicators

This study was based on the principles of scientific rigor, systematic structure, and operational feasibility. Through a combination of literature analysis (Ning et al., 2011; Kang, 2018; He and Zhang, 2019; Xue et al., 2023), expert consultation, and field investigation, the evaluation indicators were systematically screened (Liu et al., 2020; Liu et al., 2022). A comprehensive evaluation system for the plant landscape of Hutuo River Urban Forest Park was constructed, comprising five first-level indicators and 17 second-level indicators (Table 6). On this basis, the Analytic Hierarchy Process (AHP) was applied to determine the weight of each indicator, resulting in an evaluation model that is tailored to the characteristics of this park’s plant landscape and integrates both theoretical foundation and practical value (Liu and Peng, 2017).
Table 6 Evaluation indicator system for the plant landscape in Hutuo River Urban Forest Park
Among the 17 evaluation indicators, 14 are quantitative: Vertical Layer Integrity (B11), Native Species Richness (B12), Aquatic Plant Landscaping (B13), Seasonal Diversity (B21), Color Diversity (B22), Ornamental Duration (B23), Evergreen Characteristic (B25), Value of Old and Notable Trees (B32), Effect of Monospecific Group Planting (B33), Recreational Function in Open Woodlands (B41), Native Vegetation Conservation (B43), Plant Richness and Evenness (B51), Representation of Genetic Diversity (B52), and Community Structural Heterogeneity (B53). Scoring for these indicators was directly based on the field survey data and the predefined criteria.
The remaining three indicators are qualitative: Morphological Specificity (B24), Regional Cultural Expression (B31), and Plant Landscape Coordination (B42). The evaluation and scoring procedure for these qualitative indicators was as follows. 1) Due to the professional knowledge required for scoring, 20 graduate students in landscape architecture and industry experts were invited to participate. 2) The evaluation was carried out via electronic questionnaire using an expert consultation form designed according to qualitative indicator scoring standards. 3) Data were collated and analyzed, with final scores for each qualitative indicator calculated using Excel.

3.2.2 Construction of judgment matrices and calculations

This study aimed to evaluate the plant landscape of Hutuo River Urban Forest Park using the 1-9 scale method and the established evaluation indicator system. A total of six pairwise comparison judgment matrices were constructed at both the Tier-1 and Tier-2 indicator levels, including: A-(A1-A5), A1-(B11-B13), A2-(B21-B25), A3-(B31-B33), A4- (B41-B43), and A5-(B51-B53). Evaluations were provided by 20 experts and practitioners in the landscape architecture industry. The valid questionnaire data were processed using Excel to calculate the weight values assigned by each expert to every indicator, and hierarchical single ordering as well as consistency checks were performed. The judgment matrices from one expert are presented below as an example to demonstrate the weight calculation and consistency validation process. The results for the different sets of indicators are shown in Tables 7 through 12.
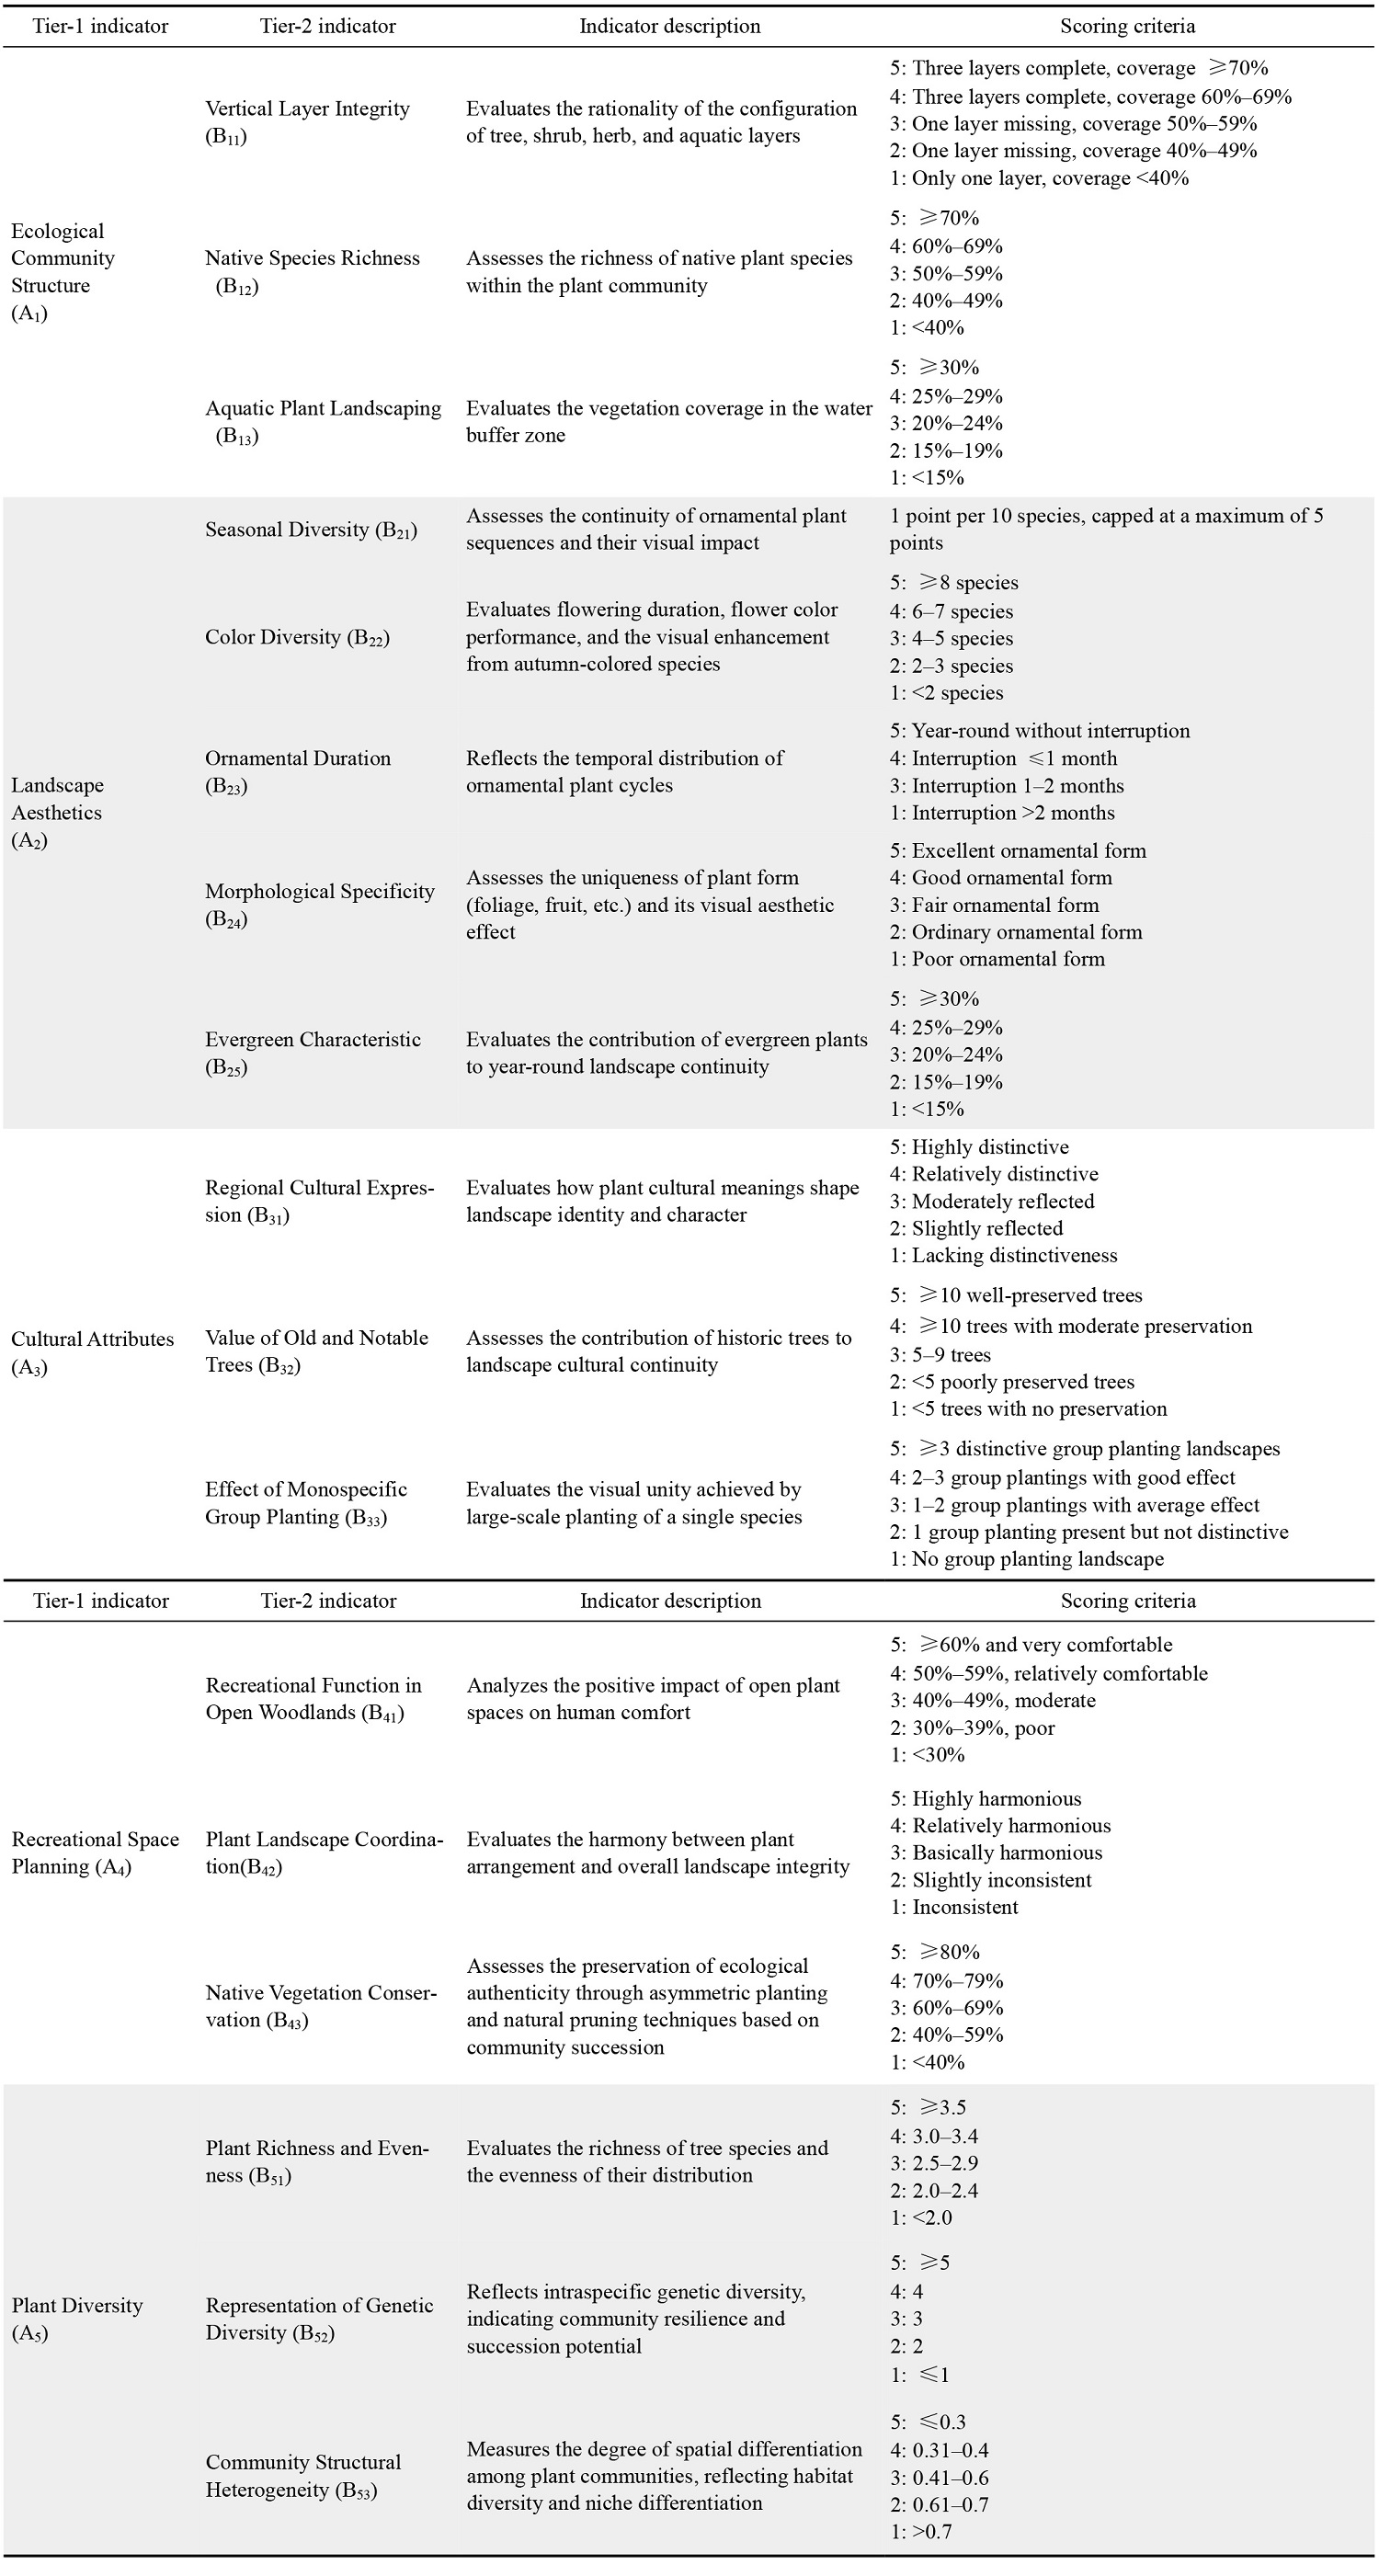
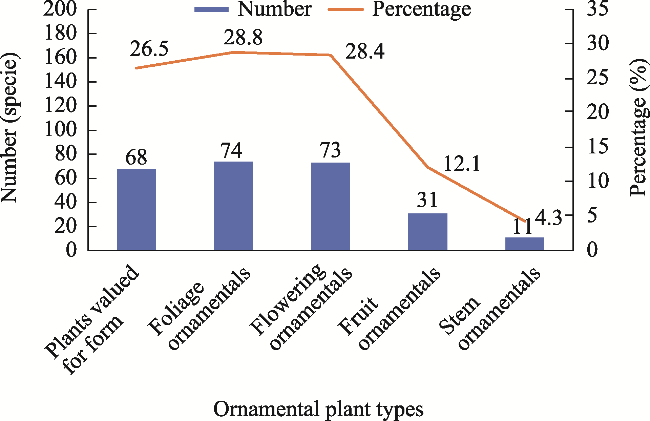
Table 7 Pairwise comparison matrix for Tier-1 indicators (A1-A5)
A A1 A2 A3 A4 A5 Weight Consistency check
A1 1 2 4 2 2 0.3586 CR = 0.0460 (<0.1)
A2 1/2 1 2 3 1 0.1844
A3 1/4 1/2 1 2 1/2 0.1016
A4 1/2 1 2 1 2 0.1495
A5 1/2 1 2 1 1 0.2059

Note: λmax=5.2061, CI=0.0515.

Table 8 Pairwise comparison matrix for indicators under A1 (B11-B13)
A1 B11 B12 B13 Weight Consistency check
B11 1 3 5 0.6370 CR = 0.0334 (<0.1)
B12 1/3 1 2 0.2583
B13 1/5 1/2 1 0.1047

Note: λmax=3.0387, CI=0.0194.

Table 9 Pairwise comparison matrix for indicators under A2 (B21-B25)
A2 B21 B22 B23 B24 B25 Weight Consistency check
B21 1 2 3 4 5 0.3981 CR = 0.0461 (<0.1)
B22 1/2 1 2 3 4 0.2633
B23 1/3 1/2 1 2 3 0.1603
B24 1/4 1/3 1/2 1 2 0.1015
B25 1/5 1/4 1/3 1/2 1 0.0768

Note: λmax=5.2062, CI=0.0516.

Table 10 Pairwise comparison matrix for indicators under A3 (B31-B33)
A3 B31 B32 B33 Weight Consistency check
B31 1 3 4 0.6250 CR = 0.0742 (<0.1)
B32 1/3 1 2 0.2385
B33 1/4 1/2 1 0.1365

Note: λmax=3.0861, CI=0.0431.

Table 11 Pairwise comparison matrix for indicators under A4 (B41-B43)
A4 B41 B42 B43 Weight Consistency check
B41 1 2 5 0.5816 CR = 0.0033 (<0.1)
B42 1/2 1 3 0.3090
B43 1/5 1/3 1 0.1095

Note: λmax=3.0038, CI=0.0019.

Table 12 Pairwise comparison matrix for indicators under A5 (B51-B53)
A5 B51 B52 B53 Weight Consistency check
B51 1 2 3 0.5396 CR = 0.0079 (<0.1)
B52 1/2 1 2 0.2970
B53 1/3 1/2 1 0.1634

Note: λmax=3.0092, CI=00.0046.

3.2.3 Analysis of component matrix results for the landscape evaluation indicators

Based on the obtained weight values of the Tier-1 indicators (WBp) and the weight values of the Tier-2 indicators (Wpq), the global weight of each indicator relative to the overall evaluation goal was calculated using the formula:
$W=W_{B p} \times W_{p q}$
The results are presented in Table 13.
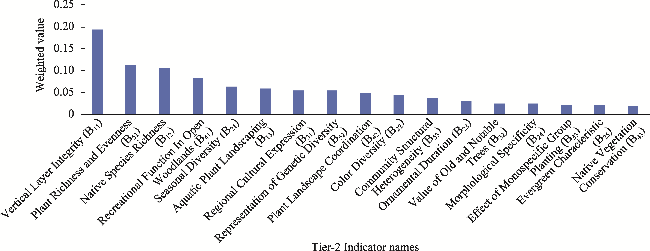
Table 13 Plant landscape evaluation indicator weighting results
Tier-1 indicator (A) Tier-1 weight value (WBp) Tier-2 indicator (B) Tier-2 weight value (Wpq) Global weight (W)
Ecological Community
Structure (A1)
0.3586 Vertical Layer Integrity (B11) 0.5396 0.1935
Native Species Richness (B12) 0.2970 0.1065
Aquatic Plant Landscaping (B13) 0.1634 0.0586
Landscape Aesthetics (A2) 0.1844 Seasonal Diversity (B21) 0.3502 0.0646
Color Diversity (B22) 0.2378 0.0439
Ornamental Duration (B23) 0.1694 0.0312
Morphological Specificity (B24) 0.1316 0.0243
Evergreen Characteristic (B25) 0.1110 0.0205
Cultural Attributes (A3) 0.1016 Regional Cultural Expression (B31) 0.5499 0.0559
Value of Old and Notable Trees (B32) 0.2402 0.0244
Effect of Monospecific Group Planting (B33) 0.2099 0.0213
Recreational Space
Planning (A4)
0.1495 Recreational Function in Open Woodlands (B41) 0.5584 0.0835
Plant Landscape Coordination (B42) 0.3196 0.0478
Native Vegetation Conservation (B43) 0.1220 0.0182
Plant Diversity (A5) 0.2059 Plant Richness and Evenness (B51) 0.5478 0.1128
Representation of Genetic Diversity (B52) 0.2634 0.0542
Community Structural Heterogeneity (B53) 0.1888 0.0389
The weighting results in Table 1 were further visualized to clarify the indicator contributions. A bar chart illustrates the relative weight distribution of Tier-1 indicators (Figure 3), and another bar chart presents the global weight ranking of Tier-2 indicators (Figure 4).
Figure 3 The weight of Tier-1 indicators
Figure 4 The weights of Tier-2 indicators
In the plant landscape evaluation system of Hutuo River Urban Forest Park, the weight ranking of the Tier-1 indicators, in descending order, is as follows: Ecological Community Structure A1 (0.3586)>Plant Diversity A5 (0.2059)> Landscape Aesthetics A2 (0.1844)>Recreational Space Planning A4 (0.1495)>Cultural Attributes A3 (0.1016).
This weight distribution indicates that Ecological Community Structure (A1) occupies a dominant position in the evaluation system, with a significantly higher weight than the other indicators, highlighting the core role of ecological integrity in plant landscape assessment. Plant Diversity (A5) and Landscape Aesthetics (A2), though secondary in weight, still hold considerable importance, reflecting the critical values of biodiversity conservation and visual experience, respectively. Recreational Space Planning (A4) and Cultural Attributes (A3) have relatively lower weights but remain indispensable components of the evaluation system, emphasizing the significance of service functionality and cultural expression within the holistic landscape context. This weighting system scientifically embodies a multidimensional value orientation that prioritizes ecology, balances aesthetic and service functions, and integrates cultural connotations in the plant landscape evaluation of Hutuo River Urban Forest Park, so it provides a robust basis for comprehensive landscape quality assessment.
As shown in Figure 4, the global ranking weights of the secondary indicators in the plant landscape evaluation of Hutuo River Urban Forest Park, in descending order, are as follows: Vertical Layer Integrity (B11, 0.1935)>Plant Richness and Evenness (B51, 0.1128)>Native Species Richness (B12, 0.1065)>Recreational Function in Open Woodlands (B41, 0.0835)>Seasonal Diversity (B21, 0.0646)>Aquatic Plant Landscaping (B13, 0.0586) > Representation of Genetic Diversity (B52, 0.0542)>Regional Cultural Expression (B31, 0.0559)>Plant Landscape Coordination (B42, 0.0478)> Color Diversity (B22, 0.0439)>Community Structural Heterogeneity (B53, 0.0389)>Ornamental Duration (B23, 0.0312)> Morphological Specificity (B24, 0.0243)>Value of Old and Notable Trees (B32, 0.0244)>Effect of Monospecific Group Planting (B33, 0.0213)>Evergreen Characteristic (B25, 0.0205) >Native Vegetation Conservation (B43, 0.0182).
This weight ranking indicates that ecological structural indicators, such as Vertical Layer Integrity, Plant Richness and Evenness, and Native Species Richness, are prioritized, highlighting the experts’ emphasis on vertical community structure, species diversity, and native resources. Landscape service indicators, such as recreational function and seasonal variation, hold intermediate weights, reflecting their dual role as carriers of ecological functions and media of experiential value. In contrast, indicators related to cultural expression, morphological specificity, and native vegetation conservation are ranked relatively low, suggesting that their perceived contribution within the evaluation system is currently limited, although they remain important components of a diversified landscape composition.

4 Discussion

4.1 Plant species composition

This study reveals that the Hutuo River Urban Forest Park demonstrates relatively strong plant species diversity at the regional scale, with its life-form structure predominantly composed of herbaceous plants, trees, and shrubs. Collectively, these three groups account for over 90% of the species and form the fundamental framework of the park’s vegetation. While the park shows certain advantages in total species count and family-genus diversity compared to domestic urban forests in similar climatic zones, it exhibits significantly lower proportions of lianas, bamboos, and ground-cover plants when measured against international reference cases with more advanced ecological structures. This reflects a limited application of vertical stratification and characteristic landscape plants in the park. While this composition aligns with the general characteristics of urban forest parks in temperate regions, the low diversity of bamboos (only 1 family and 2 genera) and lianas restricts both landscape variety and ecological functionality (Matthies et al., 2015). Future improvements should focus on enhancing the introduction and application of native lianas, ornamental bamboos, and shade-tolerant ground-cover plants, with a particular emphasis on enriching understory spaces and three-dimensional greening.

4.2 Landscape structure

This study reveals that the current plant landscape composition of Hutuo River Urban Forest Park is predominantly characterized by a multi-layered community structure of trees, shrubs, and herbs. This structure emphasizes ecological stability and green biomass accumulation, which aligns with the ecological function-oriented positioning of urban forest parks. However, the significantly low proportion of lianas and bamboos (collectively less than 4%) results in insufficient vertical stratification and limited landscape layering richness. In addition, the cultural ambience and spatial distinctiveness of bamboo landscapes have not been fully realized. Future improvements should focus on appropriately increasing the diversity and abundance of climbing plants and ornamental bamboos, with focused applications on pergolas, fences, steep slopes, and cultural landscape areas. This will enhance the vegetation stratification in vertical spaces and characteristic landscape zones (Li et al., 2014), thereby improving both the artistic appeal and diversity of ecological services of the landscape.

4.3 Plant application

Current plant application in the park emphasizes the structural role of trees and the ground-covering function of herbaceous plants. Dominant tree species such as Sophora japonica, Pinus tabuliformis, and Ginkgo biloba are extensively used in group plantings, groves, and as street trees, reinforcing the canopy line and volumetric presence, thereby establishing the green foundation of the park. Aquatic and wetland plants, including Lythrum salicaria and Iris pseudacorus, have been well integrated into riparian areas, enriching the ecological landscape along water edges. However, the park’s plant applications lack diversity and thematic coherence, which places it behind the advanced greening practices that successfully integrate landscape aesthetics with cultural expression. For instance, lianas are largely confined to isolated pergolas and walls without integration into natural woodland settings; the insufficient use of colored-leaf and fruit-ornamental species results in limited seasonal color variation during autumn and winter; and culturally significant plants, such as ancient and notable trees as well as regionally characteristic species, lack systematic display, which weakens the expression of cultural themes. Future improvements should focus on advancing a coordinated plant configuration model that integrates ecological, aesthetic, and functional considerations (Chen et al., 2023) by increasing the proportions of fruit ornamentals and colorful foliage species, systematically establishing conservation and display frameworks for ancient and notable trees, and introducing plant communities that enhance visitor interaction and sensory experiences in recreational areas to strengthen the landscape’s aesthetic expressiveness and cultural appeal.

4.4 Evaluation insights

The AHP results indicate that the weight order of the Tier-1 indicators is as follows: Ecological Community Structure A1 (0.3586) > Plant Diversity A5 (0.2059) > Landscape Aesthetics A2 (0.1844) > Recreational Space Planning A4 (0.1495) > Cultural Attributes A3 (0.1016). This demonstrates that ecological attributes are assigned core importance in the evaluation system, highlighting the principle of ecological priority in the park’s planning and construction. Among the Tier-2 indicators, Vertical Layer Integrity (B11, 0.1935), Plant Richness and Evenness (B51, 0.1128), and Native Species Richness (B12, 0.1065) ranked highest, further emphasizing the critical role of structural completeness and species diversity in landscape evaluation. In contrast, Tier-2 indicators such as Regional Cultural Expression (B31, 0.0559), Value of Old and Notable Trees (B32, 0.0244), Native Vegetation Conservation (B43, 0.0182), and Evergreen Characteristic (B25, 0.0205) all received weights below 0.03, reflecting significant shortcomings in cultural integration, characteristic conservation, and winter ornamental value in the current landscape. Guided by these weightings, future efforts should focus on enhancing the cultural identity of the plant landscape, optimizing the configuration of evergreen species, and strengthening the conservation of native vegetation, while maintaining the ecological advantages. In addition, improving the landscape service function and regional distinctiveness of recreational spaces is essential.

5 Conclusions

Through a systematic investigation of plant resources and landscape evaluation in Hutuo River Urban Forest Park, the results of this study lead to the following main conclusions.

5.1 Core findings

Hutuo River Urban Forest Park demonstrates a solid foundation of plant resources with relatively high species diversity, based on the documentation of a total of 257 species belonging to 64 families and 184 genera. The life-form structure is dominated by trees, shrubs, and herbs, collectively accounting for 92.6% of species and forming a stable ecological matrix. However, the vertical stratification remains simplistic, with lianas and bamboos comprising less than 4% of species, thereby limiting the landscape layering richness. Furthermore, the cultural thematic expression within the plant landscape remains underdeveloped, so it fails to fully reflect regional characteristics and cultural attributes.

5.2 Theoretical contribution

This study establishes a comprehensive evaluation framework that integrates ecological community structure, plant diversity, landscape aesthetics, recreational space planning, and cultural attributes to enable a multi-dimensional quantitative assessment. This framework not only facilitates a systematic assessment of urban forest landscapes but also offers a methodological reference for the planning and management of similar parks.

5.3 Practical implications

This study provides a scientific basis for optimizing plant landscapes in urban forest parks, particularly in northern arid regions. Subsequent enhancements should prioritize the introduction and spatial configuration of lianas and bamboos to improve the vertical spatial structure, while systematically integrating ancient trees, notable trees, and native cultural plants to strengthen landscape identity and regional cultural significance.

5.4 Future research

Future research will focus on three tasks: establishing long-term monitoring mechanisms for plant communities to decipher their successional dynamics; developing interdisciplinary assessment frameworks that integrate ecological observations and social perception to synergistically quantify ecological benefits and public well-being; and expanding the research scale to regional forest networks to identify optimal plant landscape strategies across diverse climatic and urbanization gradients.
[1]
Alba C, Levy R, Hufft R. 2021. Combining botanical collections and ecological data to better describe plant community diversity. Plos One, 16(1): e0244982. DOI: 10.1371/journal.pone.0244982.

[2]
Chen S W, Ren H B, Tong G R, et al. 2023. Spatial distribution patterns of woody plant species diversity in Qianjiangyuan National Park. Biodiversity Science, 31(7): 5-17. (in Chinese)

[3]
Editorial Committee of Vegetation of China. 1980. Vegetation of China. Beijing, China: Science Press. (in Chinese)

[4]
He S J, Zhang X Y. 2019. Evaluation of plant landscape in comprehensive parks of Wuhan based on analytic hierarchy process. Acta Agriculturae Shanghai, 35(5): 46-50. (in Chinese)

[5]
Kang X Q. 2018. Evaluation of plant landscape in eight park green spaces in Guilin based on AHP method. Journal of Northwest Forestry University, 33(6): 273-278. (in Chinese)

[6]
Li L L, Zhang D S, Zhang H W, et al. 2014. Application and practice of plant landscape design in urban planning. Modern Landscape Architecture, 11(12): 74-79. (in Chinese)

[7]
Liang D S, Mou C C, Gao X, et al. 2023. Environmental gradient distribution patterns and controlling factors of wetland plant community diversity in the Songnen Plain. Acta Ecologica Sinica, 43(1): 339-351. (in Chinese)

[8]
Liu G, Shao J Z, Zhang Y B. 2020. Sustainable evaluation system and design optimization method of plant landscape. Journal of Northwest Forestry University, 35(4): 242-248. (in Chinese)

[9]
Liu R X, Peng A A. 2017. Evaluation of urban coastal green space plant landscape based on analytic hierarchy process. Journal of Northwest Forestry University, 32(4): 288-293. (in Chinese)

[10]
Liu Y W, Cai J G, Shu M Y. 2022. Quantitative study on autumn plant community colors of West Lake in Hangzhou. Journal of Anhui Agricultural University, 49(1): 56-61. (in Chinese)

[11]
Lu J G, Li S Y. 2009. Comprehensive evaluation method of park plant landscape and its application. Journal of Nanjing Forestry University (Natural Science Edition), 33(6): 139-142. (in Chinese)

[12]
Matthies S A, Rüter S, Prasse R, et al. 2015. Factors driving the vascular plant species richness in urban green spaces: Using a multivariable approach. Landscape and Urban Planning, 134(6): 177-187.

DOI

[13]
National Standardization Administration of China. 2009. Wetland Classification. GB/T 24708-2009. Beijing, China: China Standards Press. (in Chinese)

[14]
Ning H J, Shao F, Sun Q Q, et al. 2011. Evaluation of plant landscape in Hangzhou Huagang Guanyu Park based on AHP method. Acta Agriculturae Zhejiangensis, 23(4): 717-724. (in Chinese)

[15]
Qiao D. 2001. Further study on AHP based on 1-9 scale. Systems Engineering and Electronics, 23(5): 36-38. (in Chinese)

[16]
Qiu L, Lindberg S, Nielsen A B. 2013. Is biodiversity attractive?—On-site perception of recreational and biodiversity values in urban green space. Landscape and Urban Planning, 119: 136-146.

DOI

[17]
Xue X S, Yang M, Wang H. 2023. Establishment and application of an aquatic plant evaluation system for constructed wetlands in Northern Shaanxi based on AHP. Wetland Science and Management, 19(3): 38-41. (in Chinese)

Outlines

/