Special Column: Digital Empowerment and Human Settlements Environment

The Evolution of the “Urban Optimal Map (UOM)”: An Exploratory Example of Data Mining and Dynamic Programming in London

  • LIU Deng ,
  • XIE Hui ,
  • LIANG Jie
Expand
  • Power China Huadong Engineering Corporation, Hangzhou 311100, China

Online published: 2025-11-28

Abstract

In urban construction, the “Urban Optimal Map (UOM)” serves as a key tool for integrating social resources and natural elements, and it plays a significant role in promoting sustainable urban development. With the advent of the digital era, various data collection devices deployed in cities have accumulated massive amounts of data, forming multi-source, high-dimensional urban databases. While visualizing these data helps uncover patterns of urban operations, the overlay of large volumes of data also complicates the visualization, making it difficult to interpret. From an animal behavior perspective, this study integrates natural geographical data of London, distribution data of different animal species, urban social information data, and comparative data on animal habits. Through GIS analysis, data visualization, and weight overlay to generate adaptability maps, a digital model is constructed and an animal behavior simulation program is developed. On this basis, multi-criteria analysis (MCA) is employed to comprehensively evaluate the simulation results and optimize decision-making, and planning solutions that balance ecological and social needs are derived. The findings demonstrate that by mining and integrating multi-source data, along with future scenario simulations, the complex relationships among urban environment, society, and sustainable development can be effectively explored. This provides scientific and objective data support for promoting harmonious coexistence between urban development and nature, and can assist decision-makers in formulating more rational urban planning strategies. As urban data continues to be updated, the “UOM” will evolve into a dynamic map system. By incorporating machine learning methods to mine temporal dimension information, it can further achieve predictions of future urban development trends, and offer scientific support for urban resource allocation and planning strategies.

Cite this article

LIU Deng , XIE Hui , LIANG Jie . The Evolution of the “Urban Optimal Map (UOM)”: An Exploratory Example of Data Mining and Dynamic Programming in London[J]. Journal of Resources and Ecology, 2025 , 16(6) : 1668 -1679 . DOI: 10.5814/j.issn.1674-764x.2025.06.006

1 Introduction

Cities are the concentrated embodiment of human social civilization and the core carrier of economic activities, and they are undergoing unprecedented profound changes in the wave of globalization and rapid technological development. From an ecological perspective, a city is an ecosystem. It is an ecosystem whose structure and material cycle have been artificially changed, whose energy conversion has been
partially altered, and which is influenced by human production activities. It is also a complex ecosystem composed of three subsystems: Social, economic, and natural (Tan et al., 2022). While the acceleration of urbanization has brought economic prosperity and social progress, it has also triggered a series of severe challenges, such as the over-exploitation of natural resources and the continuous deterioration of the ecological environment, the imbalance of urban spatial layout and functional disorders, and the diversification of social interest groups and the intensification of conflicts. Against this complex background, the concept of the “Urban Optimal Map (UOM)” has emerged as a product of urban big data collection and analysis. The UOM serves as a tool that operates on this model and generates a comprehensive and human-readable map through computational algorithms to support specific decision-making. Temporal dimensions in the data allow the map to dynamically be updated over time, enabling adaptive and optimized visual representation. UOM is like an “intelligent doctor” specifically designed for diagnosing urban issues, and it differs significantly from previous tools. For example, “space syntax” is akin to a “road specialist” that primarily studies street networks and predicts where activity will thrive by analyzing how roads are connected. On the other hand, the “City Information Model (CIM)” resembles a “model assembler” striving for perfection, and it is tasked with creating an exact digital 3D replica of the real city. In contrast, UOM is more like an “all-round doctor”. It not only possesses the skills of the “road specialist” but also integrates various real-time data, such as mobile signals, traffic flow, and environmental conditions, to generate a dynamic “urban health diagnostic map”. This map directly informs people about areas with congestion, where parks are needed, or whether new buildings might impact the surrounding environment. It serves the important functions of integrating urban social information, diverse natural elements, streaming media big data, and others, and has the important mission of providing a scientific and accurate basis for urban planning and management. It has become a key tool and core support for solving urban development dilemmas and achieving the goal of sustainable development, as well as an important methodology for shaping a good urban living environment.
The significance of a city’s pursuit of an optimal map lies in resolving the contradiction between rapid urban development and natural resource protection. Taking London as an example, its active efforts to build a National Park City demonstrate its firm determination to pursue the harmonious coexistence of man and nature in urban construction. On July 22, 2019, London officially declared itself the world’s first National Park City. This historic moment marked a crucial step for London in the field of urban ecological construction and opened a new chapter in the harmonious coexistence of the city and nature. A National Park City is different from a national park. It is a large urban area that is managed and semi-protected through both formal and informal means to enhance the natural capital of its living landscape. One defining feature is the widespread and significant commitment of residents, visitors and decision-makers to allow natural processes to provide a foundation for a better quality of life for wildlife and people (Goode, 2015). A “National Park City” is a place, a vision, and a community that covers the entire urban area. People work together to make human life, wildlife habitats, and the natural environment better. Its remarkable feature is that residents, tourists, and decision-makers generally commit to and take action. Through the joint efforts of humans, culture, and nature, they provide a better foundation for life (Zhong et al., 2021).
Statistically, London has 47% green space, including 3.8 million gardens, 8.3 million trees, 30000 small vegetable gardens, and 3000 parks. It is not only home to 8.6 million people but also has more than 8.3 million trees and 13000 species of wild animals. Figure 1 shows the distribution of important wild animal locations in London. The research and practice of the “UOM” are particularly important for studying such information. The “UOM” can accurately locate the suitable habitats for organisms, effectively promote urban ecological construction, and provide indispensable technical support and decision-making guarantees for constructing an urban ecological security pattern and promoting the harmonious coexistence of man and nature.
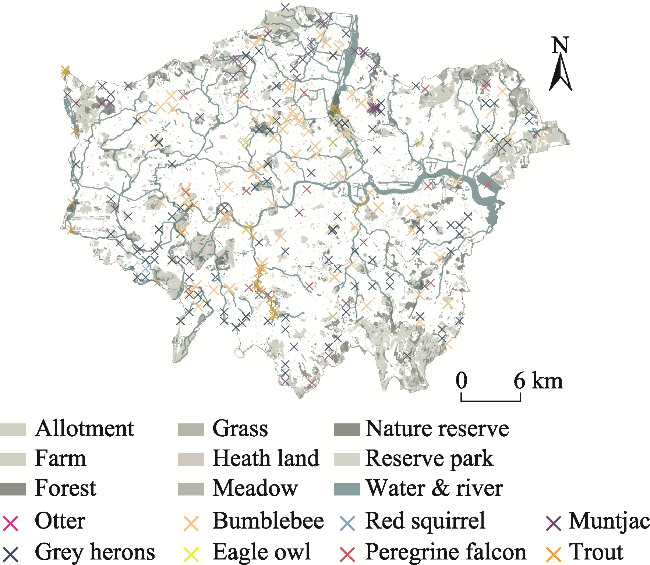
Figure 1 Land use type and species distributions in London in 2018

2 Urban development demands and goals of “UOM”

2.1 Analysis of urban development contradictions

As a typical example of urban development in the world, London still faces many dilemmas in the process of urban development, despite its certain advantages in green space resources and biodiversity. For example, the uneven distribution of green spaces leads to the insufficient play of urban ecosystem functions and the lack of ecological services in some areas; the high maintenance cost of green infrastructure puts tremendous pressure on urban finances; the improvement of biodiversity faces a bottleneck, and the habitats of key species are severely fragmented. To achieve the development vision of a green, healthy, fair, and beautiful city, the innovation of urban planning and management methods is urgently needed.
As an innovative planning tool, the core task of the “UOM” is to accurately identify the suitable habitats for organisms. Through scientific planning and reasonable layout, it provides the spatial conditions for the survival and reproduction of organisms, thereby promoting ecological protection. This not only helps to repair the urban ecosystem, and enhance the stability and resilience of the ecosystem, but also promotes the harmonious coexistence of man and nature, and creates an ecologically livable urban environment.

2.2 Analysis of the core demands of the “UOM”

The concept of ecological suitability was first proposed by the famous British environmental designer McHarg. It refers to the inherent degree of suitability of the land for specific and sustainable uses, which is determined by the hydrological, geographical, topographical, geological, biological, and humanistic characteristics of that land. Ecological suitability is the degree of suitability of regional ecosystem sustainable development as determined by various natural attributes, such as geographical conditions, meteorological conditions, and resource conditions, as well as humanistic characteristics such as landscape and economy (Cheng et al., 2022). The “UOM” is a type of ecologically adaptive map. It conveys comprehensive value information within a single map and offers guidance to urban planners in identifying the most suitable areas for wildlife. It aims to present urban value information in an all-around and multi-dimensional way in order to provide accurate and reliable guidance for urban planning decision-making. Given that the amount of data produced almost every day now is as much as throughout human history up to 2007, architecture is increasingly information architecture (De Monchaux, 2016). The key to forming a suitability map seems to be hidden in the constantly generated urban data. Figure 2 shows the visualization of different social data in the Lea Valley region of London, including the well-being index, crime rate, health status level, number of public buildings, and other parameters.
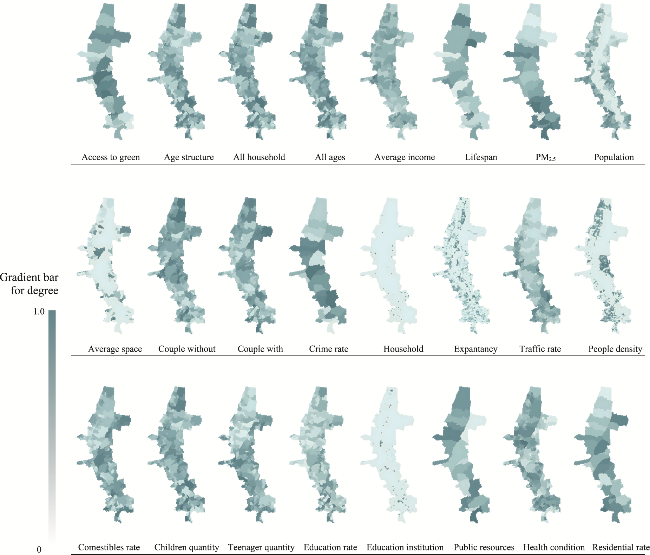
Figure 2 Visualization of multiple data sources in the Lea Valley region of London
At the urban ecosystem level, multi-source data such as natural geography, ecological community structure, and biological habits must be integrated to construct a complete ecological information map. For example, such integration is needed to draw detailed maps of urban topography, hydrology, and geology, climate and meteorology and other natural geographical elements, analyze the composition, distribution, and succession laws of different ecological communities, and deeply study the ecological habits, foraging ranges, breeding requirements and other behavioral characteristics of various organisms. At the social level, the “UOM” must take into full account the differences in needs and value orientations among various interest groups. For example, farmers expect to introduce beneficial insects (such as bumblebees) to promote crop pollination and improve agricultural production efficiency; school administrators hope to use urban biological resources to carry out ecological education activities and enhance students’ awareness of ecological environmental protection; some families are concerned about the distribution of certain organisms (such as bees) due to safety and life convenience; and various institutions (such as special places like airports and hospitals) have specific requirements for the surrounding biological environment based on their own functional needs. By deeply integrating multi-source data and diverse interest demands, “UOM” is committed to achieving the coordinated optimization of multiple urban ecological, social, and economic goals, and promoting the virtuous cycle of urban sustainable development.

3 Construction of the urban database and suitability map

3.1 The process of urban data digital transformation

Modern metropolises have fully entered the digital age, driven by scientific recording technology and geographical information systems (GIS). In the process of urban digitalization, the amount of data has increased explosively. The collection and processing of data are facing challenges. First, data sources are extensive and diverse, including sensors, monitoring devices, mobile applications, and many others, so an effective mechanism is needed to collect, store, and manage these data. Second, data processing requires the use of advanced technical tools and algorithms to extract useful information and insights from the massive amounts of data (Qiu, 2024). Fortunately, with the structuring, public-welfare, and openness of data, Internet platforms have provided rich GIS data resources for urban research, such as digital maps, data warehouses, and NBN atlases. A well-known example is space syntax, which is a tool for measuring urban space related to natural, social, and economic factors. Configurational analyses represented by the method of syntax allow the modeling of a city that links intuition and science, and it can be used for designing and planning cities, as well as in research (Hillier, 2009). Advanced tools like space syntax use these data to quantitatively analyze how urban spaces interact with natural, social, and economic factors, thereby supporting more robust urban modeling. Yet, the flood of data also poses serious challenges. Extracting valuable insights from massive and complex datasets has become an urgent key issue in urban planning.

3.2 Detailed explanation of the principle and method for generating the suitability map

The generation of a suitability map is based on the deep integration of urban environmental data and animal behavior logic. Taking the bumblebee in the London Insect Corridor (B-LINE) project as an example (Figure 3), first, GIS technology was used to construct a high-precision digital model of the city, integrating geographical information such as urban streets, water sources, and vegetation, to provide basic data support for subsequent analysis. At the same time, the secrets of how bumblebees find their habitats in the urban environment were explored. Since planners can simulate how animals find their preferred living conditions with the help of a computer, they can make more thoughtful designs for the potential survival points of species. For example, from the perspective of bumblebee behavior, the urban street map and the urban water source map have different meanings and cannot be directly related. However, when bumblebees explore their habitats, they tend to choose places near water sources and away from streets because water is necessary for their survival, while street noise and high-speed vehicles threaten their survival. Through simple logic and GIS information analysis, two analysis-based maps for bumblebees can be generated. Then, these two maps can be combined according to a specific mathematical formula because a place that is close to a water source but too close to a lane may not be a good choice. Subsequently, the characteristics of the animals need to be considered again because these two factors may be equally important, or water may be more important, causing the bumblebees to tolerate being close to noise. This is a biological decision-making process that cannot be determined by personal assumptions but requires discussion among experts. In this example, only two conditional factors are discussed, but ultimately, the adaptive map of the species needs to consider more factors and be reasonably classified, such as landscape, land use, natural environment, distribution of tree species and flowers, and other factors. With the addition of more information and a complete logical algorithm, the potential suitability map for bumblebees will become more perfect. At the same time, some spare positions should be reserved for unknown influencing factors, which is conducive to the improvement and upgrading of discussion tools.
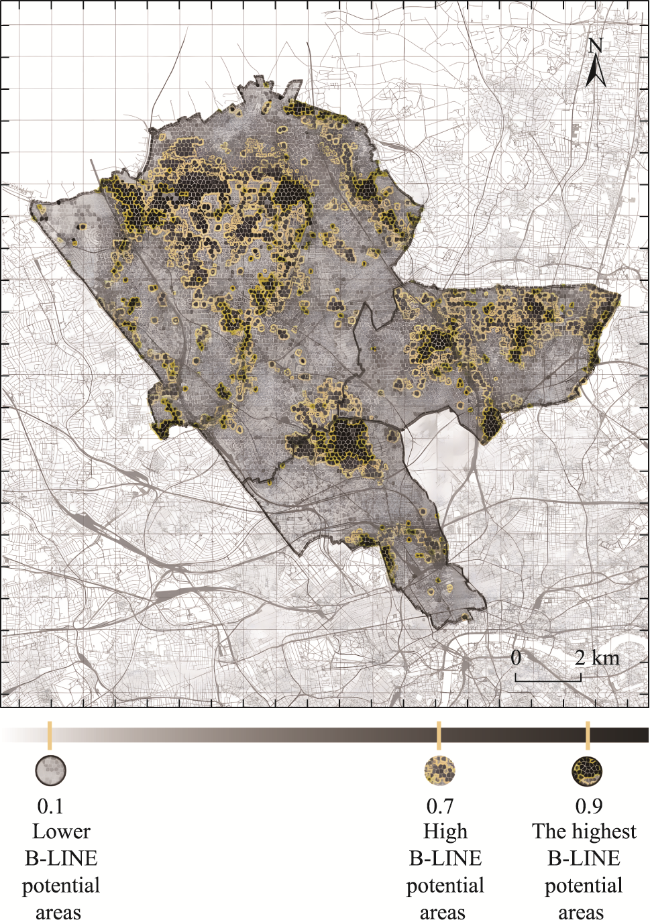
Figure 3 The potential B-LINE with suitability values
This process requires the cooperation of biologists, environmental experts, and program engineers. The process of digitizing data and logic into a computer requires the integration of their professional knowledge to form new tools for the decision-makers to use. If the logical relationships in the computer can match the knowledge of experts, the generated simulation results will be more persuasive, and the program will become more reliable through iterative upgrades.

3.3 Optimization strategies and practices in complex scenarios

Over a relatively large-scale area (such as 1000 m×1000 m), considering factors such as bumblebee population density and foraging radius, a single site-selection standard can no longer meet the actual needs. This can be improved with the help of the “Galapagos” plug-in genetic algorithm in Rhino software. As a computational model that simulates biological evolution in nature, genetic algorithms have been widely applied in many fields, especially in computer mathematical modeling. The genetic algorithm simulates the process of biological evolution, uses genetic operations such as selection, crossover, and mutation to generate a population of solutions, and then evaluates and selects the excellent solutions through a fitness function (Yu, 2024). In the simulation process, the algorithm takes the ecological requirements of bumblebee population survival and reproduction as the objective function and comprehensively considers multiple constraint conditions, such as population density limits, foraging radius coverage, and habitat suitability (Figure 4), with bumblebee behavioral data sourced from Table 1, to evaluate and screen different layout schemes. Finally, the computer can compare those schemes and obtain a solution with a relatively high comprehensive value. When the logic and data are correct, and the result of this calculation is obtained by the computer after a long time, it can be called a “relatively perfect solution” under the conditions of rare animals.
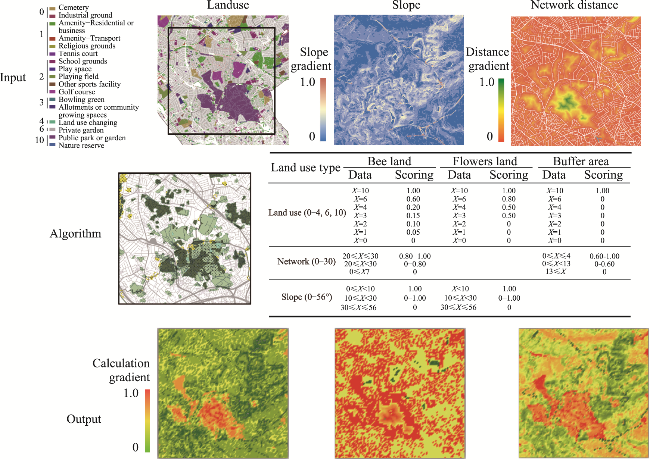
Figure 4 Process for the integration of data and weights in the ecological suitability map
Table 1 Bumble Bee (Hymenoptera: Apidae) foraging distance and colony density associated with a late-season mass flowering crop
Field site No. foragers Total distance travelled (km) Average foraging distance (km) Foraging area (km2) Nest density estimate (colonies km-2)
DNA analysis Chao Poisson
2007
A 312 409.76 1.31 5.42 30.08 34.51 76.21
B 33 46.07 1.40 6.12 5.06 39.40 8.33
C 22 54.00 2.45 18.93 1.06 5.34 1.80
D 66 242.97 3.68 42.58 1.27 2.99 22.16
Average 2.21
2008
E 63 223.32 3.54 39.48 1.37 4.22 2.38
F 71 242.33 3.41 36.60 1.56 3.76 2.81
G 19 87.52 4.61 66.67 0.28
H 15 86.67 5.87 104.89 0.14
I 58 239.56 4.13 53.60 0.90 3.38 1.59
J 70 509.26 7.28 166.30 0.33 1.39 0.60
Average 4.79 0.76 3.19 1.85

Note: The letters A-J in the table represent the different field sites where research was conducted in 2007 and 2008. Data source: Rao and Strange, 2012.

This process is an important node in the evolution of the “UOM”, and fully demonstrates the powerful ability of computer technology to handle massive data and multiple constraint conditions in complex urban ecological planning problems. It strongly promotes the transformation of suitability maps toward precision and practicality, and provides more scientific and feasible decision-making support for urban ecological planning. When this tool is used in private land, such as farmland or a small-area region, it may already be a perfect solution. However, in the complex urban context, finding the best solution requires a more comprehensive approach.

4 Incorporation of social factors and construction of interactive maps

4.1 Analysis of multiple stakeholders

Identifying the “UOM” within a city requires heightened attention to social factors, as it involves multiple stakeholders—such as administrative districts, enterprises, schools, and families—each with their own vested interests and divergent priorities. Balancing these competing interests presents a major obstacle to achieving the “UOM”.
For example, farmers may prefer to have more bumblebees near their farmland to help pollinate their crops. School administrators also hope to have some insects in the school to promote the students' education. On the other hand, some private families may be afraid of bees and want to stay away from these bee colonies, or the managers of certain specific areas may not like too many flying insects around, such as near an airport. Different organizers have different sets of logic about adapting to rewilding in their minds, so as shown in Figure 5, the vested interests of multiple parties must be balanced to find a suitable solution.
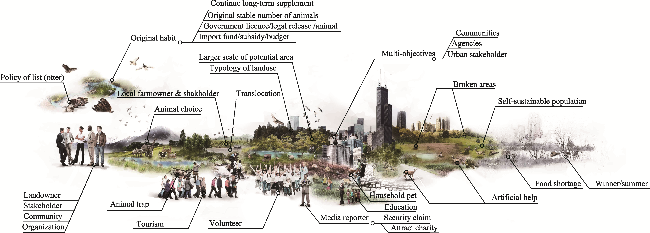
Figure 5 Schematic diagram of the relationships between social and ecological factors in the urban environment
Taking perceived safety and aesthetic quality as examples, traditional surveys and emerging technologies can be integrated to quantify environmental perceptions. For instance, questionnaires distributed in key areas can capture the residents’ assessments of neighborhood safety and landscape beauty. Simultaneously, deep learning models applied to street view imagery can automatically extract and quantify visual features—such as green space visibility, street openness, and nighttime illumination—to generate perceptual evaluation layers. Integrating the social data with ecological metrics enables more comprehensive quantification and balancing of multiple interests.
For convenience, their logic can be converted into computer language and digital maps for discussing the final decision. The result will ultimately produce multiple maps representing different interest groups, including the species suitability map representing the interests of the animals mentioned above. When balancing the interests among those groups, if the interests of all parties are the same, or each value has a certain weight, these maps can be combined, and the newly created map may be regarded as the most “perfect” policy solution. However, the fact is that vested interests are unpredictable. The accurate weighting factors need to be collected from multiple groups, rather than being rashly determined by the program engineers. These weights are often difficult to define and need to be adjusted according to the actual situations in different regions or at different times. As a result, the best solution may not be flexible enough and may not gain the trust of most citizens and organizations.

4.2 Construction of interactive maps and innovation of the interest-balancing mechanism

To achieve a balance among multiple urban organizations and avoid conflicts, the process of combining multi-stakeholder maps requires a process of public participation and discussion. The open-ended weight connector seems to be a good solution for setting adjustable sliders in the decision-making process, because it allows users from different organizations, and even environmental experts as the representatives of species, to adjust the sliders to obtain their trusted maps. This process also helps government policymakers balance various factors in the final policy-making process in combination with the multi-criteria analysis (MCA) decision-making process. MCA evolved from the critique of conventional cost-benefit analysis and its variants, social cost-benefit analysis (CBA) and Social Return on Investment (SROI) (Vardakoulias, 2013). MCA supports decision-making by evaluating alternatives against multiple, often conflicting, criteria. Its core components include objectives, alternatives, criteria, weights, and scores. Weights are typically determined by using structured methodologies such as the Analytic Hierarchy Process (AHP), which translates the subjective preferences of diverse stakeholders (e.g., government bodies, communities, businesses) into comparable numerical values through pairwise comparisons or group consensus. These weights and corresponding performance scores are then integrated via weighted overlay modeling to produce comprehensive decision maps. This approach enables the systematic evaluation and rational prioritization of alternatives under multiple constraints. Open decision-making results are more likely to meet the individual needs of different regions. A new generation of optimal maps will be generated through the balancing of various aspects. Therefore, there will be no single, permanent, and perfect policy map because the effect of policy-making may be variable and gradually become more realistic with the participation of different people or organizations.
As the name implies, an interactive map is a map that can meet the needs of users and provide timely feedback based on the query results or give suggestions (Wu et al., 2023). Since this kind of interactive map can be open to the public and allow more people to participate in decision-making, this is regarded as a cognitive process resulting in the selection of a belief or a course of action among several possible alternative options, so it could be either rational or irrational (Wikipedia, 2018a), and may involve interactive maps focused on visual storytelling, such as digital atlases, interactive news maps, and a large proportion of map mash-ups (Roth, 2013). Therefore, the “UOM” may continue to evolve over time. The process of determining weights also produces new data, as individuals assign values based on their own needs. Collecting this data serves two purposes. First, the aggregated results can offer guidance to future participants by allowing them to learn from past decisions and make more informed adjustments. Second, these data can be used as input for machine learning systems, which can simulate this nuanced and often unpredictable decision-making process. The latter approach is more complex and uncertain, as it attempts to model the behavior of future decision-makers.
After the decision-making process, the most acceptable option with a high environmental value may be the perfect map. This tool can help people to view digital information, generate suitability maps with high natural values, and adjust social conflicts from multiple institutions, and its working operations are shown in Figures 6 and 7. However, it seems to forget the source of the data, which is the basis of all assumptions. Currently, only previous data is imported into the tool, so what will happen if the data is variable?
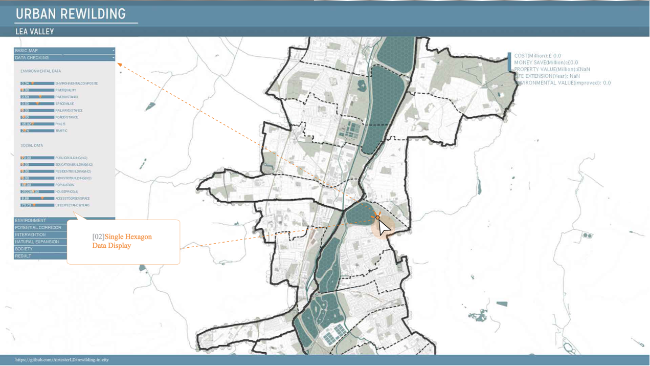
Figure 6 Display of the basic operational interface of the interactive map (single point data display)
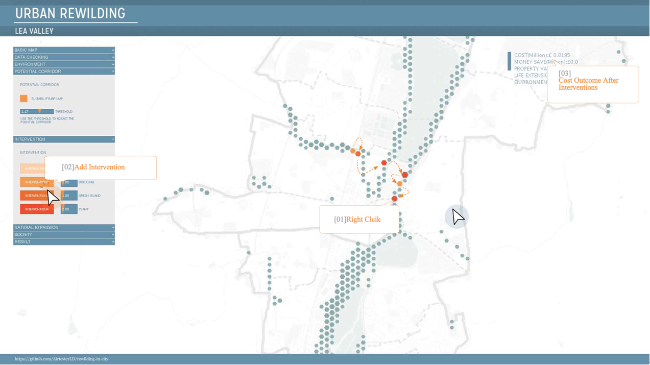
Figure 7 Display of the basic operational interface of the interactive map (with added intervention measures)

5 Dynamic maps and urban development prediction

5.1 The formation mechanism and significance of dynamic maps

Adding a temporal dimension to a map forms a dynamic map with a time scale. So, is this the final “UOM”? After introducing the temporal dimension, the continuous updating of urban data drives the map to evolve dynamically. With the wide application of modern information technologies such as 5G and the Internet of Things (IoT), various sensors in cities (such as mobile phones, cameras, and others) can collect massive amounts of data in real-time, making the real-time acquisition of urban data a reality. The system uses AI-powered data structuring, cloud computing, and data integration technologies to combine different types of real-time and historical data. To ensure that the data are accurate and reliable, methods such as cross-checking sensor readings with real-world measurements are used, along with error detection and quality control steps. These help to reduce mistakes caused by missing, incorrect, or inconsistent data. For inevitable data inaccuracies, the system compares them with past data predictions to re-validate and recollect the abnormal values. By connecting these dynamic data sources directly to the map model, the map can instantly reflect changes in urban ecology, society, economy, and other aspects, significantly improving the timeliness and accuracy of planning schemes. Taking the bumblebee suitability map as an example, the urban environment is constantly changing over time. Factors such as vegetation growth, land-use changes, and climate fluctuations will all affect the suitability of various bumblebee habitats. The dynamic map can track these changes in real-time and dynamically adjust the prediction of bumblebee habitat distribution, ensuring that the planning scheme closely conforms to the actual dynamics of the urban ecology and providing dynamic and accurate decision-making support for urban ecological management. Although the delay of data may make the results reflect only the past, predicting major trends is feasible. When implementing specific landscape interventions, predicting future situations is necessary through trends and practical measures should be added based on the predictions. This is an inevitable trend and core direction in the development of the “UOM”.

5.2 Urban development prediction methods and applications based on machine learning

This process needs not only actual data but also massive amounts of historical data. Using the logic of data trends to speculate on future development, and thus select the most effective solution, may lead to the creation of the perfect map. In other words, the perfect map explains what methods should be adopted to achieve the best results in the future. This process resembles machine learning, which is the study of computer algorithms that improve automatically through experience and the use of data (Wikipedia, 2018b).
Machine learning technology endows dynamic maps with powerful urban development prediction capabilities. By mining the correlations and causal relationships in massive historical data and constructing an urban development prediction model, that model can simulate the long-term impacts of different planning schemes over a future time span (Figure 8). Among numerous simulation results, the key task is to explore the “urban triggers” with low costs and high benefits based on the “butterfly effect” principle.
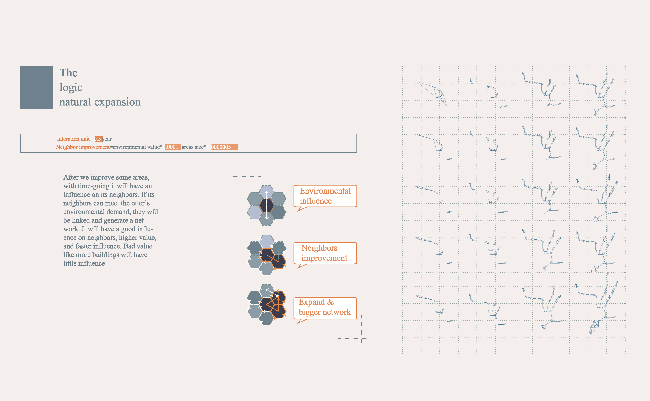
Figure 8 Schematic diagram of the basic diffusion mechanism of the interactive map
To solve this problem, two questions need to be answered: how to predict the future, and what is the best solution. To predict the future effectively and objectively, introduce machine learning must be introduced into the digital city model. This creates a “black box” that can identify the correlations and causal relationships between invalid historical data. Through the internal calculations of the “black box”, future trends are inferred from past data. Then, returning to the digital model, the human-designed solutions can be added and the future impacts of these solutions can be simulated, to select the results that are needed from numerous scenarios.
However, finding the best answer among thousands of solutions is unrealistic, but its selection can be assisted based on machine-set standards. So, what is this standard? After finding the connection between today’s design and future urban trends, there must be a way to have the greatest impact with the least cost, just like the “butterfly effect”. Making such an intervention at a specific point in the city to drive urban vitality is like an “urban trigger”. Pulling this trigger can integrate urban resources at the lowest cost. For example, if you plant a nectar-producing plant beneficial to bees at a specific point, it will attract more bees, and then more plants will be pollinated and grow. The greening of plants will attract more animals and insects, and a new ecosystem will awaken the vitality of nature. This vitality not only affects the natural world but also promotes people’s participation in outdoor activities and reduces diseases in big cities. But all of this is based on finding that “urban trigger” and making the appropriate changes. This kind of optimal map has an obviously subjective nature, but in landscape urbanism, finding these triggers from the current city and promoting the healthy development of the city is a perfect strategy.

6 Exploration of “UOM” and its application in urban planning

6.1 The relativity of “UOM” and the explanation of its value as a tool

A perfect map may not exist, but there must be tools for drawing the best map. Whether it involves open interaction with the public, more accurate data sources, or a weight adjustment system, using these tools to search for the perfect but mysterious map is always a better choice. As it may be impossible for humans to see the shortest path connecting 40 random points, the application of machine learning and artificial intelligence can reasonably predict future scenarios. With the improvement of equipment and the participation of local users, by integrating the public interaction and participation mechanism, precise data collection technology, and dynamic weight adjustment system, and by relying on the powerful prediction capabilities of machine learning and artificial intelligence, these tools will continue to play a key role in the urban planning decision-making process.
Taking the construction of London’s National Park City as an example, under the constraints of specific periods and clear construction goals, by integrating multi-source data, balancing multiple interests, and dynamically adjusting planning schemes, high-quality planning maps that meet the phased urban development needs can be generated. At the same time, this approach also allows for more discussions on different aspects of urban planning, including the social, economic, ecological, spatial, or material functions. The flow of urban data makes the city look like a living organism. Like us, cities are self-sustaining organisms with their own metabolism. These tools are lenses for observing and understanding urban metabolic flows. From this moving flow, achieving the greatest effect with the least interference is the main contribution of the “UOM”. Although such maps are not absolutely perfect, they can provide practical and effective guidance for urban development. They have become powerful tools that urban planners use to deal with complex urban problems and promote sustainable urban development, and they have irreplaceable value in urban planning practice.

6.2 Multi-dimensional applications in urban planning and future prospects

The “UOM” tool holds broad application prospects in urban planning that span multiple dimensions, including ecological restoration, spatial layout optimization, and socio-relational coordination. In ecological restoration, it can accurately identify ecologically damaged areas and key ecological corridors, guide the implementation of ecological restoration projects, and promote the restoration of ecosystem functions,the simulation results are presented in the form shown in Figure 9. In spatial layout optimization, according to urban functional requirements and ecological suitability, it can rationally plan urban functional areas and ecological spaces, thereby improving urban space utilization efficiency and ecological quality. At the social relation coordination level, it fully considers the needs of different interest groups, resolves social conflicts, and creates a harmonious social atmosphere.
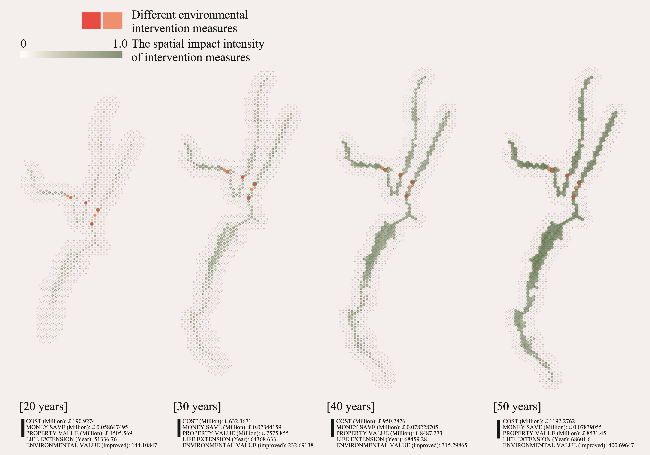
Figure 9 Prediction results of the interactive map under different strategies
From the macroscopic scale of the city, the internal information for the city can be used to analyze the health status of the town. What kind of city is a circular and healthy place, and what methods can be used to improve the current situation of the city? This tool can be used to observe the stubborn urban problems faced by the millennial generation, provide solutions, establish a green immune system for the town, and at the same time, reasonably coordinate the complex relationships between citizen organizations. With this tool, designers will become the doctors of their cities.
With the continuous iterative innovation of technology and the in-depth mining of urban data, the “UOM” will deeply empower innovative practices in urban planning. With the integrated development of cutting-edge technologies such as big data, artificial intelligence, and the Internet of Things, urban planning will become more precise, efficient, and intelligent, thus promoting the continuous evolution of cities towards a green, intelligent, and livable direction and realizing the long-term vision of urban sustainable development. These achievements will provide successful examples and innovative models for urban development around the world.

7 Conclusions

Research on the “UOM” begins with data mining and evolves through suitability, interactive adjustments, and dynamic maps. By integrating multiple disciplines and advanced technologies, the “UOM” enhances the scientific validity, accuracy, and foresight of urban planning. Despite challenges such as data quality issues, algorithm optimization, and stakeholder coordination, further exploration of the UOM offers strategic value for cities in addressing their environmental, social, and sustainable development issues. This research field will continue to lead the trend of innovative changes in urban planning, lay a solid foundation for shaping a better future for cities, and become the core focus and key direction of urban development research.
[1]
Cheng Y, Li Z W, Wang J H, et al. 2022. Construction and verification of river ecological suitability evaluation system. Environmental Science & Technology, 45(S1): 321-328. (in Chinese)

[2]
De Monchaux N. 2016. Local code: 3659 proposals about data, design & the nature of cities. New York, USA: Princeton Architectural Press.

[3]
Goode D. 2015. London: A national park city. https://www.thenatureofcities.com/2015/08/16/london-a-national-park-city/.Viewed on 2022-08-16.

[4]
Hillier B. 2009. The now and the future of space syntax:From structures and models to theory. Seoul, Korea: Proceedings of the Ninth International Space Syntax Symposium.

[5]
Qiu S. 2024. Research on smart city planning and management based on big data analysis. Theoretical Research in Urban Construction (Electronic Edition), (15): 226-228. (in Chinese)

[6]
Rao S, Strange J P. 2012. Bumble bee (Hymenoptera: Apidae) foraging distance and colony density associated with a late-season mass flowering crop. Environmental Entomology, 41(4): 905-915.

DOI

[7]
Roth R E. 2013. Interactive maps: what we know and what we need to know. Journal of Spatial Information Science, (6): 59-115.

[8]
Tan Y Y, Fan X J, Peng Q, et al. 2022. Evaluation of suitability of human settlement environment in the main urban area of Changzhou based on GIS. Journal of Green Science and Technology, 24(22): 261-265, 273. (in Chinese)

[9]
Vardakoulias O. 2013. Multi-criteria analysis (MCA) evolved from critique of conventional cost-benefit analysis and its variants, social cost-benefit analysis (CBA) and social return on investment (SROI). In: Williams C (ed.). Briefing 6: Multi-criteria analysis. London, UK: New Economics Foundation.

[10]
Wikipedia. 2018a. Decision-making. https://en.wikipedia.org/wiki/Decision-making.Viewed on 2022-08-16.

[11]
Wikipedia. 2018b. Machine learning. https://en.wikipedia.org/wiki/Machine_learning. Viewed on 2022-08-16.

[12]
Wu W, Yin Q H, Wang L, et al. 2023. Implementation of interactive urban map based on Python. Wireless Internet Technology, 19(2): 49-51. (in Chinese)

[13]
Yu Q H. 2024. Application of improved genetic algorithm in computer mathematical modeling. Information Systems Engineering, (9): 59-62. (in Chinese)

[14]
Zhong L, Zhang Z, Zhang J Y. 2021. A new concept of urban-nature symbiosis: enlightenment from the construction of London National Park City. Journal of Beijing Forestry University (Social Sciences), 20(3): 17-23. (in Chinese)

Outlines

/