
Journal of Resources and Ecology >
Impact Mechanism of the Digital Economy in Promoting Carbon Emission Reduction in the Yangtze River Delta Urban Agglomeration: A Moderated Mediation Effect Approach
|
JIANG Yueting, E-mail: ytjiang2@iflytek.com |
Received date: 2025-05-14
Accepted date: 2025-09-25
Online published: 2025-11-28
Supported by
The National Social Science Fund of China(23BGL222)
The Key Project of Anhui Provincial Scientific Research Planning(2022AH051882)
The Key Project of Anhui Provincial Scientific Research Planning(2024AH050632)
As global efforts to achieve carbon neutrality accelerate, understanding how digital economy development contributes to urban carbon reduction is crucial for achieving sustainable development. This study examines the impact of digital economy expansion on carbon emission intensity in the Yangtze River Delta urban agglomeration, a key economic hub in China. Using panel data from 41 cities (2011-2021) and a moderated mediation model, we analyze how industrial upgrading and Green Total Factor Productivity (GTFP) mediate this relationship. Our findings confirm that the digital economy significantly reduces carbon intensity both directly and indirectly through these two pathways. In addition, government investment in science and technology positively moderates this effect by strengthening the carbon reduction impact via industrial transformation. Spatial heterogeneity analysis reveals that these effects are more pronounced in cities within the “one core, five circles, and four belts” framework and in non-resource-based cities, highlighting regional disparities. These results underscore the need for targeted policy measures, including enhanced digital infrastructure, green finance mechanisms, and regional collaboration to maximize the decarbonization benefits of digitalization. By integrating digital and low-carbon strategies, policymakers can drive high-quality, green urban transformation.
JIANG Yueting , WANG Ruqi , MEI Yulin . Impact Mechanism of the Digital Economy in Promoting Carbon Emission Reduction in the Yangtze River Delta Urban Agglomeration: A Moderated Mediation Effect Approach[J]. Journal of Resources and Ecology, 2025 , 16(6) : 1613 -1625 . DOI: 10.5814/j.issn.1674-764x.2025.06.001
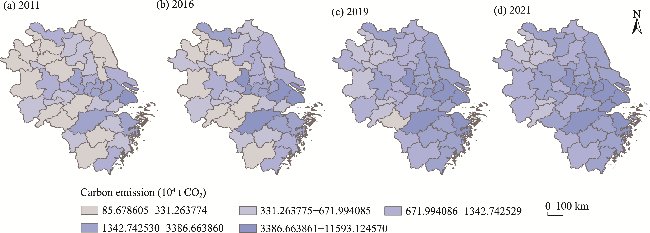
Figure 1 Evolution of carbon emission levels in the YRD |
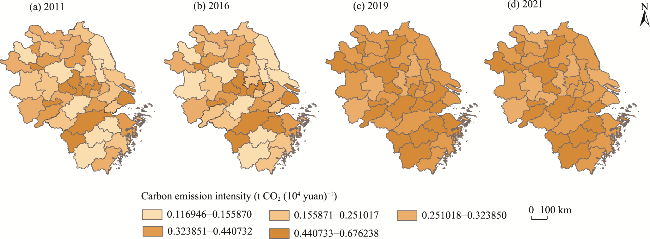
Figure 2 Evolution of carbon emission intensity in the YRD |
Table 1 Descriptive statistical results |
| Variable | Observations | Maximum | Minimum | Mean | Median | Standard deviation | VIF |
|---|---|---|---|---|---|---|---|
| CI | 451 | 0.689 | 0.115 | 0.364 | 0.344 | 0.143 | - |
| DIG | 451 | 0.922 | 0.0491 | 0.220 | 0.163 | 0.174 | 5.98 |
| IND | 451 | 2.766 | 0.313 | 1.008 | 0.967 | 0.349 | 2.54 |
| GTFP | 451 | 1.184 | 0.199 | 0.611 | 0.508 | 0.308 | 1.55 |
| TI | 451 | 15.18 | 9.225 | 11.75 | 11.67 | 1.208 | 9.63 |
| GDP | 451 | 2.839 | 0.351 | 1.794 | 1.836 | 0.575 | 4.96 |
| ENVI | 451 | 14.28 | 9.732 | 11.63 | 11.60 | 0.842 | 4.86 |
| IVM | 451 | 8.991 | 5.926 | 7.610 | 7.639 | 0.755 | 9.23 |
| FDI | 451 | 14.52 | 8.718 | 11.50 | 11.53 | 1.246 | 3.23 |
| ENT | 451 | 9.254 | 5.852 | 7.594 | 7.643 | 0.875 | 6.66 |
| URB | 451 | 0.893 | 0.344 | 0.616 | 0.622 | 0.118 | 5.72 |
Note: The variables in the table are dimensionless except CI, and the unit for CI is t CO2 (104 yuan)-1. |
Table 2 Benchmark regression results |
| Variable | (1) | (2) | (3) |
|---|---|---|---|
| DIG | -0.533*** | -0.597*** | -0.614*** |
| (0.136) | (0.127) | (0.126) | |
| GDP | 0.130** | 0.332*** | |
| (0.056) | (0.085) | ||
| GDP2 | -0.063*** | ||
| (0.020) | |||
| ENVI | -0.014 | -0.020 | |
| (0.014) | (0.014) | ||
| IVM | 0.142*** | 0.079** | |
| (0.035) | (0.040) | ||
| FDI | 0.008 | 0.012 | |
| (0.010) | (0.010) | ||
| ENT | 0.098*** | 0.088** | |
| (0.035) | (0.035) | ||
| URB | 0.431*** | 0.385*** | |
| (0.124) | (0.124) | ||
| _cons | 0.452*** | -1.605*** | -1.180*** |
| (0.037) | (0.297) | (0.323) | |
| N | 451 | 451 | 451 |
| adj. R2 | 0.382 | 0.478 | 0.490 |
Note: Standard errors are shown in parentheses; * P<0.1, ** P<0.05, *** P<0.01. |
Table 3 Robustness test results |
| Variable | (1) | (2) | (3) | (4) |
|---|---|---|---|---|
| lnC | perC | CI | CI | |
| DIG | -1.461*** | -4.592*** | -0.397*** | |
| (0.434) | (1.035) | (0.143) | ||
| L.DIG | -0.405*** | |||
| (0.133) | ||||
| Control variable | Yes | Yes | Yes | Yes |
| Fixed time | Yes | Yes | Yes | Yes |
| Urban fixed | Yes | Yes | Yes | Yes |
| _cons | -7.427** | -22.245*** | -3.257*** | V4.046*** |
| (3.580) | (8.539) | (1.144) | (0.677) | |
| N | 451 | 451 | 410 | 407 |
| adj. R2 | 0.731 | 0.645 | 0.492 | 0.555 |
Note: Standard errors are shown in parentheses; * P<0.1, ** P<0.05, *** P<0.01. |
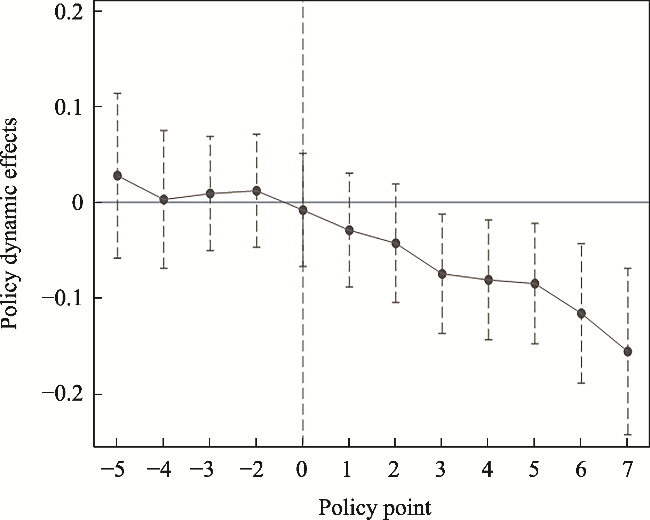
Figure 3 Plot of parallel trends in carbon emission intensity |
Table 4 Impact of the “Broadband China” policy on carbon emission intensity |
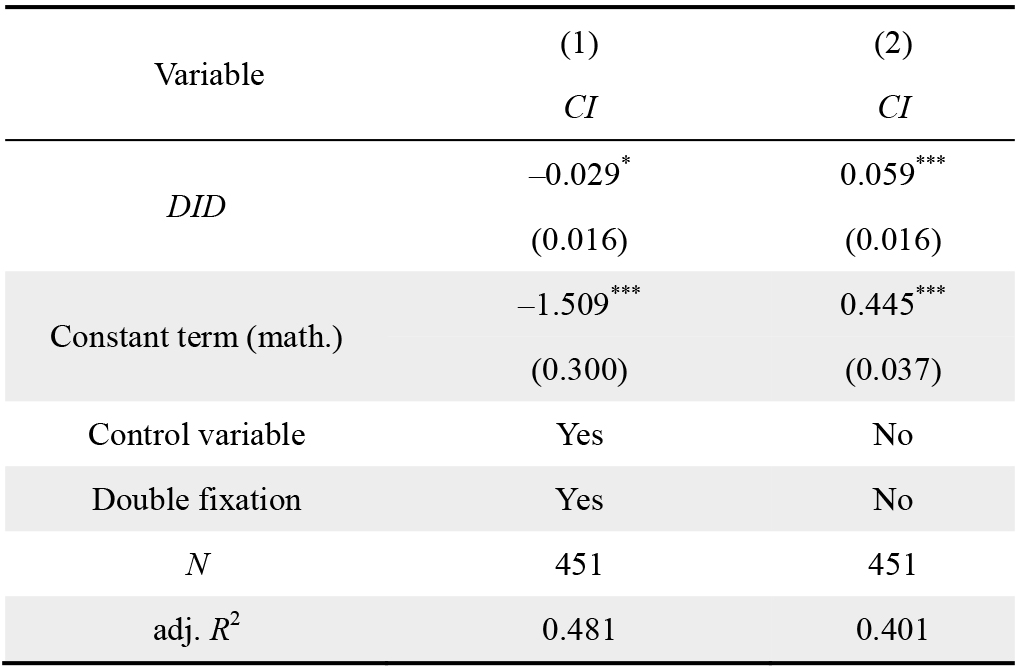 |
Note: Standard errors are shown in parentheses; * P<0.1, ** P<0.05, *** P<0.01. |
Table 5 Mediated effects test |
| Variable | (1) | (2) | (3) | (4) | (5) |
|---|---|---|---|---|---|
| CI | IND | CI | GTFP | CI | |
| DIG | -0.597*** | 0.409** | -0.524*** | 1.222*** | -0.367*** |
| (0.127) | (0.189) | (0.123) | (0.252) | (0.122) | |
| IND | -0.179*** | ||||
| (0.033) | |||||
| GTFP | -0.188*** | ||||
| (0.024) | |||||
| Control variable | Control | Control | Control | Control | Control |
| Double fixed effect | Yes | Yes | Yes | Yes | Yes |
| _cons | 1.731*** | -1.296*** | 2.813*** | -1.077*** | |
| (0.441) | (0.292) | (0.587) | (0.284) | ||
| N | 451 | 451 | 451 | 451 | |
| adj. R2 | 0.701 | 0.514 | 0.250 | 0.549 |
Note: Standard errors are shown in parentheses; * P<0.1, ** P<0.05, *** P<0.01. |
Table 6 Bootstrap mediation effect test |
| Variant | Effect | Ratio | 95% Confidence interval |
|---|---|---|---|
| IND | Indirect effect_bs_1 | -0.073 | [-0.1708, -0.0030] |
| Direct effect_bs_2 | -0.524 | [-0.8329, -0.2293] | |
| GTFP | Indirect effect_bs_1 | -0.230 | [-0.3708, -0.1291] |
| Direct effect_bs_2 | -0.367 | [-0.6888, -0.0518] |
Table 7 Moderating effect tests for TI |
| Variable | (1) | (2) | (3) | (4) | (5) | (6) |
|---|---|---|---|---|---|---|
| CI | IND | CI | GTFP | CI | CI | |
| DIG | -0.570*** | 0.235* | -0.508*** | 1.262*** | -0.391*** | -0.315*** |
| (0.126) | (0.183) | (0.122) | (0.255) | (0.121) | (0.120) | |
| TI | 0.051*** | 0.109*** | 0.074*** | -0.004 | 0.052*** | 0.052*** |
| (0.018) | (0.026) | (0.018) | (0.036) | (0.017) | (0.017) | |
| TI×DIG | -0.154*** | 0.361*** | -0.113 | -0.195*** | ||
| (0.052) | (0.075) | (0.105) | (0.050) | |||
| IND | -0.180*** | |||||
| (0.035) | ||||||
| TI×IND | -0.022** | |||||
| (0.010) | ||||||
| GTFP | -0.188*** | -0.194*** | ||||
| (0.023) | (0.023) | |||||
| TI×GTFP | 0.006 | 0.028 | ||||
| (0.020) | (0.020) | |||||
| Control variable | Control | Control | Control | Control | Control | Control |
| Double fixed effect | Yes | Yes | Yes | Yes | Yes | Yes |
| _cons | -1.468*** | 0.286 | -1.429*** | 3.119*** | -1.350*** | -0.901*** |
| (0.332) | (0.480) | (0.307) | (0.670) | (0.299) | (0.315) | |
| N | 451 | 451 | 451 | 451 | 451 | 451 |
| adj. R2 | 0.498 | 0.727 | 0.537 | 0.248 | 0.558 | 0.573 |
Note: Standard errors are shown in parentheses; * P<0.1, ** P<0.05, *** P<0.01. |
Table 8 Heterogeneity analysis |
| Variable | Resource-based city | Yangtze River Delta “one core, five circles, and four belts” city | ||||||
|---|---|---|---|---|---|---|---|---|
| Yes | No | Yes | No | Yes | No | Yes | No | |
| (1) | (2) | (3) | (4) | (5) | (6) | (7) | (8) | |
| DIG | -0.398 | -0.570*** | -0.236 | -0.560*** | -0.711*** | -0.269 | -0.682*** | -0.452 |
| (0.412) | (0.144) | (0.379) | (0.142) | (0.166) | (0.239) | (0.214) | (0.258) | |
| Control variable | No | No | Yes | Yes | No | No | Yes | Yes |
| Double fixed effect | Yes | Yes | Yes | Yes | Yes | Yes | Yes | Yes |
| _cons | 0.439*** | 0.462*** | -3.271*** | -1.182*** | 0.561*** | 0.304*** | -0.775 | -1.829** |
| (0.061) | (0.046) | (0.739) | (0.374) | (0.055) | (0.039) | (0.797) | (0.649) | |
| N | 121 | 330 | 121 | 330 | 308 | 143 | 308 | 143 |
| adj. R2 | 0.340 | 0.387 | 0.555 | 0.443 | 0.314 | 0.553 | 0.434 | 0.694 |
Note: “Yes” and “No” in the heading refer to whether it is a resource-based city; Standard errors are shown in parentheses; * P<0.1, ** P<0.05, *** P<0.01. |
| [1] |
|
| [2] |
|
| [3] |
|
| [4] |
|
| [5] |
|
| [6] |
|
| [7] |
|
| [8] |
|
| [9] |
|
| [10] |
|
| [11] |
|
| [12] |
|
| [13] |
|
| [14] |
|
| [15] |
|
| [16] |
|
| [17] |
|
| [18] |
|
| [19] |
|
| [20] |
|
| [21] |
|
| [22] |
|
| [23] |
|
| [24] |
|
| [25] |
|
| [26] |
|
| [27] |
|
| [28] |
|
| [29] |
|
| [30] |
|
/
| 〈 |
|
〉 |