Ecotourism

Spatial Coupling of Sightseeing-Accommodation-Recreation in Traditional Rural Tourism Destinations: A Case Study of Wuyuan County, China

  • TANG Jigang , * ,
  • TIAN Fengjun ,
  • LIN Wenkai ,
  • ZHANG Jin
Expand
  • School of Business Administration, Jiangxi University of Finance and Economics, Nanchang 330032, China
* TANG Jigang, E-mail:

Received date: 2024-06-12

  Accepted date: 2025-05-06

  Online published: 2025-10-14

Supported by

The National Natural Science Foundation of China(72304120)

The National Social Science Foundation of China(24CGL062)

The Jiangxi Federation of Social Sciecnces(22Y37)

Abstract

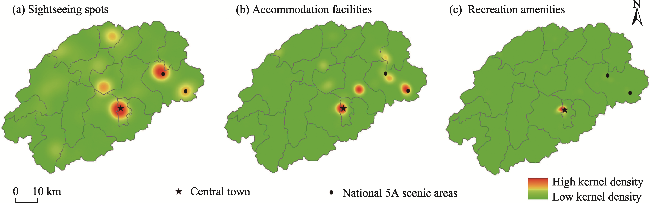
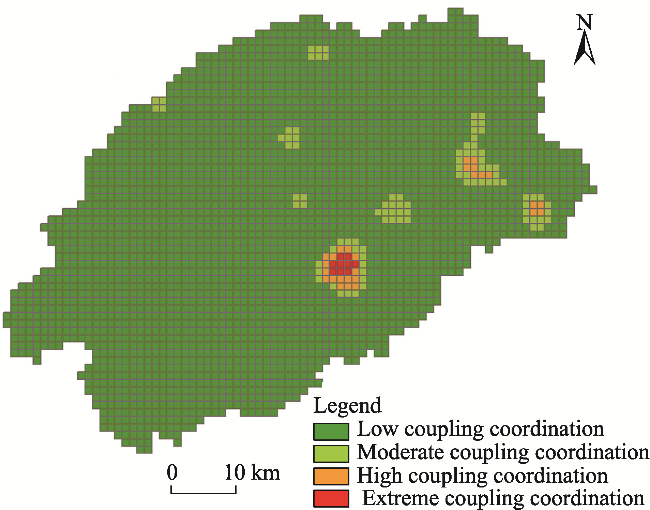
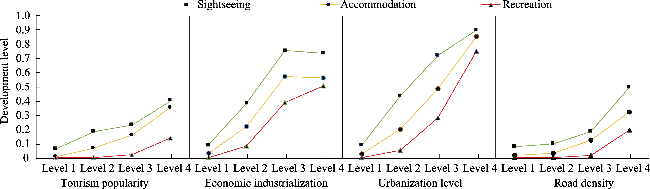
Sightseeing spots and accommodation facilities constitute the primary activity spaces for visitors in traditional rural areas, so assessing the spatial coupling of sightseeing, accommodation, and recreation in such destinations can provide a critical foundation for optimizing the allocation of recreational amenities. Taking Wuyuan County in Jiangxi, China as an example and based on the models of coupling coordination degree and Geographical Detector, the spatial coupling and its driving factors of these three tourism elements in traditional rural tourism destinations were studied at the spatial granularity of grid cells. The findings reveal that while sightseeing spots, accommodation facilities, and recreational amenities all tend to be clustered in human settlements, their high to extreme levels of coupling coordination are only observed in the central town and a few large traditional villages. The coupling coordination of sightseeing-accommodation-recreation is primarily driven by tourism popularity, urbanization level, road network density, and economic industrialization. These drivers influence their coupling coordination degree mainly through separate and interactive effects on the development levels of the tourism elements. In terms of their separate effects, tourism popularity exhibits stronger explanatory power for the development of sightseeing and accommodation compared to other drivers, while urbanization level and economic industrialization demonstrate significantly greater explanatory power for recreation development. Regarding interactive effects, most interactions between the major drivers exhibit a two-factor enhancement pattern. The current coupling status of sightseeing-accommodation-entertainment in traditional rural tourism destinations not only applies pressure for the conservation of large traditional villages but also hinders other traditional villages and natural attractions from meeting the recreational needs of tourists. Consequently, governments must implement differentiated management strategies for recreational amenities that are tailored to different types of scenic areas.

Cite this article

TANG Jigang , TIAN Fengjun , LIN Wenkai , ZHANG Jin . Spatial Coupling of Sightseeing-Accommodation-Recreation in Traditional Rural Tourism Destinations: A Case Study of Wuyuan County, China[J]. Journal of Resources and Ecology, 2025 , 16(5) : 1580 -1588 . DOI: 10.5814/j.issn.1674-764x.2025.05.027

1 Introduction

Since the late 1980s, rural tourism has developed steadily in China. Among various types of Chinese rural tourism destinations, traditional rural tourism destinations have gained significant popularity among tourists due to their integration of historical charm and rural authenticity (Zeng et al., 2021). Nevertheless, many of these destinations still lack a well- structured tourism system with rational combinations of elements (Lu et al., 2021). This issue is particularly pronounced in the insufficient supply of recreational amenities (Wu and Shao, 2020). Research indicates that sightseeing spots and accommodation facilities constitute the primary activity spaces for tourists in traditional rural areas (Wang et al., 2020), so the rational allocation of recreational amenities near them is important for optimizing the tourism structures of traditional rural tourism destinations. The rational allocation of recreational amenities represents a complex planning challenge, as it requires balancing two objectives: fulfilling the diverse recreational needs of tourists through proximity while minimizing the potential negative impacts of recreational amenities on the architectural integrity and cultural atmosphere. A comprehensive analysis of the spatial coupling dynamics and influencing factors of sightseeing-accommodation-recreation within traditional rural tourism destinations can provide an essential empirical foundation for informed decision-making in this regard.
However, current research on the coupled development of rural tourism mainly focuses on its coupling with agriculture (Zhan and Zhu, 2023; Gao and Zheng, 2024), rural revitalization (Ma et al., 2022; Sun et al., 2022; Zhou et al., 2023), and new rural construction (Ma, 2017; Liang, 2019), while only a few studies involve the coupling of rural tourism elements (Chen and Chen, 2018; Zhang et al., 2022). The spatial coupling of sightseeing-accommodation- recreation in rural areas was only discussed theoretically in those papers. In addition, a limited number of studies have investigated the coupling of tourism elements in other kinds of destinations, such as the coupling of transport-recreation in urban destinations (Mao et al., 2022), and the coupling of the Tourism Six Elements in island destinations (Kan et al., 2020). Although the literature on tourism layout has also explored the spatial relationships between tourism elements, few studies have considered rural tourism element layout, because the spatial relation of urban tourism elements was usually the focus of those studies (Zhu et al., 2021; Tian et al., 2023).
In summary, given that the inadequate supply of recreational amenities is a prominent problem for tourism in traditional rural tourism destinations, and sightseeing spots and accommodation facilities constitute the primary activity spaces for tourists in rural areas, the rational allocation of recreational amenities around the sightseeing and accommodation elements represents a critical step in optimizing the industrial system of traditional rural tourism. An empirical examination of the current spatial coupling patterns and influencing factors of sightseeing- accommodation-recreation in traditional rural destinations can provide an essential analytical foundation for achieving systemic optimization. However, the current literature on the coupled development of rural tourism rarely involves the coupling of rural tourism elements, and other tourism research literature also pays less attention to the spatial relationships between rural tourism elements. Therefore, this study used Wuyuan County in Jiangxi, China, as an example, and spatial statistics to investigate the spatial coupling of sightseeing-accommodation- recreation, and then explored the driving factors behind the coupling relationships.

2 Study area and research methodology

2.1 Overview of Wuyuan County

Wuyuan County is located in Jiangxi, China, with a county area of 2967 km2, and it governs one subdistrict and 16 townships. Its population is approximately 307200 (2024), and its per capita GDP is about 60570 yuan (2024). Renowned as “China's Most Beautiful Countryside”, Wuyuan has diverse idyllic landscapes and intangible heritage. By leveraging its rich tourism resources and strategic proximity to the Yangtze River Delta economic hub, the tourism of Wuyuan County has achieved remarkable development. As of December 2024, the county had 15 high-level scenic areas, including two National 5A Scenic Areas and 13 National 4A Scenic Areas. All the National 5A Scenic Areas and seven of the National 4A Scenic Areas are traditional villages. Most of the other National 4A Scenic Areas belong to the natural type.

2.2 Methods and granularity of the spatial analysis

2.2.1 Spatial analysis methods

(1) The coupling coordination degree model
The coupling coordination degree model of the S-A-R system (Sightseeing-Accommodation-Recreation) was constructed according to the relevant literature (Li et al., 2022), as follows:
$\begin{array}{l} C=\frac{3 \times \sqrt[3]{u_{1} \times u_{2} \times u_{3}}}{u_{1}+u_{2}+u_{3}} \\ T=\alpha u_{1}+\beta u_{2}+\lambda u_{3} \\ D=\sqrt{C \times T} \end{array}$
where u1, u2, and u3 respectively represent the development levels of sightseeing, accommodation, and recreation. C is the coupling degree of the S-A-R system (C∈[0,1]), with a larger value indicating a stronger interaction between the elements. T is the development level of the S-A-R system, while α, β, and λ are the weights for sightseeing, accommodation, and recreation, which were all set to one-third. D is the coupling coordination degree of the S-A-R system (D∈[0,1]), which is a comprehensive measure of the system's internal interactions and development level. Referring to the relevant literature (Wang et al., 2020), the coupling degree and the coupling coordination degree of the S-A-R system were divided into four types (Table 1). The term “disharmony” was not adopted here to describe a low coupling coordination degree, although it is used in some studies. This decision was based on the following rationale. In contiguous farmland or a large lake, the coupling coordination degree of the S-A-R system is probably low, constituting a normal state rather than problematic disharmony.
Table 1 Coupling type partitioning criteria of the S-A-R system
Value range [0, 0.30] (0.30, 0.50] (0.50, 0.80] (0.80, 1]
Coupling degree Low-level coupling Antagonistic stage Running-in stage High-level coupling
Coupling coordination degree Low Moderate High Extreme
(2) The Geographical Detector model
Traditional multivariate regression statistics must satisfy multiple prerequisites, such as the absence of multicollinearity between variables. After it was developed by Wang et al., the Geographical Detector model has increasingly been used to study spatial multi-causal problems due to its low number of premise constraints (Wang and Xu, 2017; Li, 2023). This study applied the factor detector, ecological detector, risk detector, and interaction detector of the Geographical Detector. The factor detector result is a q value ranging from 0 to 1, with a higher q value indicating that the variable X has a stronger explanatory power for the spatial distribution of variable Y. The F statistic is used to test whether the explanatory power of X1 and X2 for Y are significantly different, which is called ecological detection. The t statistic is used to test whether there is a significant difference in Y between different levels of X, which is called risk detection. A comparison of the magnitude of the q value when X1 and X2 jointly act on Y with the q-values when X1 and X2 separately act on Y can show whether and how these two variables exhibit interactive effects on Y.

2.2.2 Spatial analysis granularity

The spatial coupling of the S-A-R system was analyzed precisely at the grid cell level. Because the grid size has a significant impact on the calculation of spatial relationships (Huang et al., 2015), after consulting relevant experts, the length of each side of the square grid was set to 1 km for three reasons. First, pedestrian accessibility between sightseeing spots, accommodation facilities, and recreational amenities is practically achievable within plot sizes of 1 km2 or smaller. Second, the spatial coexistence of sightseeing attractions, accommodation facilities, and recreational amenities is entirely feasible within a 1 km2 boundary. This assertion is grounded in the operational definition of “sightseeing spots” in this study, which specifically refers to tangible rural landscape elements such as ancestral halls, ancient trees, and bamboo groves. Like rural accommodation facilities and recreational amenities, sightseeing spots inherently occupy minimal land area. Third, a quantitative analysis revealed that reducing the grid cell sides from 1 to 0.5 km would result in a 76.9% decline in the proportion of grid cells where the coupling coordination degree of the S-A-R system exceeds 0.5. This would seriously compromise the discriminatory power of the coupling coordination degree.

2.3 Data sources and selection of explanatory variables

2.3.1 Measuring the development levels of the S-A-R system elements

Kernel density analysis can simulate the spatial continuous distribution of point and line facilities using a kernel function that reflects the influence of facilities on their service range, which decays with distance (Chen et al., 2020). Due to the lack of relevant statistical data, this study used the average kernel densities of sightseeing spots, accommodation facilities, and recreational amenities in the grid units to characterize the development levels of these three system elements. In March 2024, relevant POI data were obtained from the Amap open interface. After manual verification and other operations, a geographic database composed of 296 sightseeing spots, 1377 accommodation facilities, and 396 recreational amenities was established. The sightseeing spots were derived from the sightseeing spots category in the Amap POI classification system, and the recreational amenities included entertainment venues, vacation resorts, leisure venues, theaters, massage parlors, and sports venues, including recreational amenities within accommodation facilities. Kernel density analysis, zonal statistics, and normalization were performed separately for the three system elements, so that the average kernel density of each system element within grid units ranged from 0 to 1. Following the practices in the relevant literature (Liu et al., 2015), data were non-zeroed when substituting the normalized values into the coupling coordination model.

2.3.2 Spatial coupling explanatory variable selection and calculation

Based on the factors known to influence tourism agglomeration (Nie, 2009; Ma et al., 2021), and considering the availability of data, seven factors were selected as explanatory variables for the spatial coupling of the S-A-R system: tourism popularity, economic industrialization, distance from the downtown, urbanization level, road density, river network density, and elevation. Drawing on Tourism Demand Theory and Regional Development Stage Theory, tourism popularity and economic industrialization primarily influence tourism agglomeration by shaping supply-demand dynamics of the tourism industry. Guided by Urbanization Theory, Central Place Theory, Transportation Accessibility Theory, and distance-decay effect, the variables urbanization level, distance from the town, and road network density mainly affect tourism agglomeration through their impacts on location advantages and infrastructure development. Based on Environmental Determinism, Landscape Aesthetics Theory, and Vertical Zonation Theory, the river network density and elevation exert their influences on tourism agglomeration by determining the abundance of natural tourism resources and the spatial distribution of human settlements.
According to the tourism popularity formula proposed by Rong and Tao (2020), the tourism popularity was calculated for 25 scenic areas in Wuyuan. These scenic areas have online comments on both the Ctrip and Qunar websites. Then, using tourism popularity as a weighted variable, kernel density analysis was performed on the 25 scenic areas, and the average tourism popularity of the grid units was obtained through zonal statistics. The degree of economic industrialization was represented by the average kernel density of companies and enterprises, including factories, companies, agricultural bases, and others, with data also from Amap. Via multi-ring buffer analysis, the distance between the grid units and the county town was divided into four levels, with higher levels indicating a farther distance from the downtown. The urbanization level of each grid unit was represented by the nighttime light index, with the average value extracted from the 2023 average nighttime light index image. Based on the road network and river network vector data, the average road network and river network densities of the grid units were obtained through kernel density analysis and zonal statistics, with weighted processing according to the importance of roads in the road network kernel density analysis. The average elevation of the grid units was obtained from the DEM data. Finally, except for the “distance from the downtown”, the other six explanatory variables were divided into four levels using the natural break point method, with higher levels indicating higher degrees or densities.

3 Results and analysis

3.1 Comparing the spatial distributions of sightseeing, accommodation, and recreation

The kernel density analysis results (Figure 1) show that the spatial distributions of sightseeing spots, accommodation facilities, and recreational amenities in Wuyuan County separately exhibit a core-periphery structure. However, the distribution breadth decreases in the order of sightseeing spots, accommodation facilities, and recreational amenities, while the number and area of agglomeration zones also decrease in the same order. Sightseeing spots are distributed throughout the county, and they form five major core regions of varying strengths and moderate-density areas across most towns. Accommodation facilities have three strong core regions, one weak core region, and several smaller moderate-density areas. The moderate-density areas are only distributed in the county town and some other towns. As for the recreational amenities, apart from forming a small core region in the county town, they also form tiny moderate-density areas in a few other towns. The core regions of sightseeing spots, accommodation facilities, and recreational amenities are all located in the county town or ancient villages. Notably, all the National 4A Scenic Areas of the natural type deviate from the core regions of the three tourism elements, suggesting that sightseeing spots, accommodation facilities, and recreational amenities all tend to be clustered in human settlements rather than natural environments.
Figure 1 Kernel density distributions of the elements of sightseeing, accommodation, and recreation in Wuyuan

3.2 Spatial coupling characteristics of the S-A-R system

The concentrations and differences in the spatial distributions of sightseeing spots, accommodation facilities, and recreational amenities result in a relatively low degree of spatial coupling of the S-A-R system for most grid units. As shown in Table 2, both the types of coupling degree and the coupling coordination degree of the grid units exhibit pyramid-like structures. Only a small proportion of grid units show high-level coupling or coupling coordination. Due to the low T values of most grid units, the pyramid-like structure of the coupling coordination degree is more prominent.
Table 2 Coupling characteristics at the level of grid units
Coupling type High-level coupling Running-in stage Antagonistic stage Low-level coupling Sum
Number Average T Number Average T Number Average T Number Average T
Extreme coupling coordination 9 0.836 0 0 0 9
High coupling coordination 15 0.509 12 0.420 0 0 27
Moderate coupling coordination 2 0.221 65 0.265 27 0.285 0 94
Low coupling coordination 316 0.005 478 0.025 822 0.033 1058 0.048 2674
Total 342 0.051 555 0.062 849 0.041 1058 0.048 2804
As shown in Figure 2, the coupling coordination type of the S-A-R system follows a core-periphery distribution pattern in Wuyuan. Grid units with extreme coupling coordination and some grid units with high coupling coordination form the strong core area in the county town. Other grid units with high coupling coordination occur in two large ancient villages: Jiangwan and Huangling, the only two National 5A Scenic Areas in Wuyuan. They form two sub-core areas. The grid units with moderate coupling coordination are mostly distributed around the core areas, sub-core areas, or other well-known ancient villages. Within the National 4A Scenic Areas of the natural type, only the Lingyan Cave Scenic Area has grid units with moderate coupling coordination, and the others are all composed of grid units with low coupling coordination. In summary, most scenic areas in Wuyuan County show low or moderate coupling coordination of the S-A-R system.
Figure 2 Coupling coordination types of grid cells

3.3 Driving factors of the coupling coordination of the S-A-R system

3.3.1 Identification of the major driving factors

To reveal the path by which the explanatory variables influence the coupling coordination of the S-A-R system, the development levels of sightseeing (u1), accommodation (u2), and recreation (u3), the coupling degree (C), the system development level (T), and the coupling coordination degree (D) were used separately as dependent variables. This was achieved by running the Geographic Detector software six times to assess the explanatory power of each independent variable on each of the six dependent variables. The results are shown in Table 3.
Table 3 q values of the explanatory variables
Explanatory variable Independent variable
u1 u2 u3 C T D
Tourism popularity (X1) 0.281* 0.359* 0.207* 0.035* 0.373* 0.455*
Economic industrialization (X2) 0.170* 0.179* 0.664* 0.033* 0.297* 0.296*
Distance from the downtown (X3) 0.046* 0.032* 0.022* 0.065* 0.046* 0.055*
Urbanization level (X4) 0.235* 0.239* 0.848* 0.033* 0.383* 0.362*
Road density (X5) 0.175* 0.186* 0.323* 0.036* 0.256* 0.311*
River network density (X6) 0.023* 0.043* 0.005* 0.004 0.032* 0.040*
Elevation (X7) 0.002 0.002 0.005* 0.032* 0.002 0.003

Note: * indicates significance at the 0.05 level.

The results show that tourism popularity (X1), economic industrialization (X2), urbanization level (X4), and road density (X5) are the major driving factors for the coupling coordination of the S-A-R system (Table 3). Their explanatory power for the coupling coordination is close to or greater than 30%. The other three independent variables, distance from the downtown (X3), river network density (X6), and elevation (X7), have an explanatory power of less than 6% for the coupling coordination degree. Evidently the coupling coordination of the S-A-R system is primarily driven by socioeconomic factors in Wuyuan, and the influences of natural and location factors on the coupling coordination are weak.

3.3.2 Influencing paths and mechanisms of the major driving factors

The explanatory powers of the four major driving factors for u1, u2, u3, and T are far greater than that for C (Table 3). This indicates that their driving effects on the coupling coordination of the S-A-R system are mainly achieved by influencing the development level of each element in the S-A-R system. The results of the ecological detector show that the explanatory power of tourism popularity for the development levels of sightseeing spots and accommodation facilities is significantly stronger than the other three major driving factors at the 0.05 level. The explanatory powers of economic industrialization and urbanization level for the development level of recreation reach 84.8% and 66.4%, respectively, so they are significantly stronger than the 32.3% and 20.7% of road density and tourism popularity at the 0.05 level.
As shown in Figure 3, the influences of the major driving factors on the development levels of sightseeing, accommodation, and recreation are positive. In most cases, they show monotonically increasing relationships. The exception is that when the economic industrialization is highest, the development levels of sightseeing and accommodation are not at their highest levels, because the grid units with the highest level of economic industrialization are located in the county town, where the economy is not dominated by tourism.
Figure 3 The influences of the major driving factors on the development levels
The positive impacts of tourism popularity, economic industrialization, urbanization level, and road density on the development levels of tourism elements can be respectively explained by the attractive effect, growth effect, agglomeration effect, and convenience effect. Tourism popularity facilitates the development of tourism industry elements by attracting tourists, capital investment, human resources, and government support. Economic industrialization drives the growth of tourism elements by stimulating local consumption growth, a migrant population influx, related industry expansion, and enhanced investment capacity. Urbanization contributes to tourism elements through industrial agglomeration effects and the concentration of consumers, production factors, and public services. A high-density road network enhances tourism element development by providing convenience for visitor arrival, attracting investment, operational management, and material supply.
The interaction detection results reveal that the four major driving factors do not independently influence the development level of S-A-R system, but instead exhibit mutual interactions, and all the interactions belong to the two-factor enhancement type. Notably, the explanatory power of the interaction between tourism popularity and any one of the other three major driving factors exceeds 50% in accounting for the system development level. The interaction between tourism popularity and urbanization level demonstrates the strongest explanatory power of 60.4%, followed by the interaction between tourism popularity and economic industrialization at 56.6% (Table 4).
Table 4 q values of the interactions between the major driving factors on the system development level
Driving factor Tourism popularity Economic industrialization Urbanization level Road density
Tourism popularity 0.373
Economic industrialization 0.566* 0.297
Urbanization level 0.604* 0.391* 0.383
Road density 0.502* 0.393* 0.432* 0.256

Notes: * indicates the type of interaction is two-factor enhancement.

Like the interactions on the system development level, the explanatory powers of the interactions between tourism popularity and the other three major driving factors on the development levels of sightseeing and accommodation are also stronger than those of the interactions between the other three major driving factors, yet the explanatory powers of these interactions are all below 50%. However, as illustrated in Table 5, the interactions of the major driving factors on the recreation development level differ from the previously mentioned scenarios. Only the interaction between tourism popularity and road network density has an explanatory power below 50% on the recreation development level. The explanatory powers of other interactions between the major driving factors on the recreation development level all exceed 70%. Among them, the interaction between tourism popularity and urbanization level has the highest explanatory power of 91.0%. This is closely followed by the interaction between tourism popularity and economic industrialization, which is characterized by nonlinear enhancement and has an explanatory power of 87.6%. Furthermore, the interaction between economic industrialization and urbanization level also demonstrates a high explanatory power of 87.1% on the recreation development level.
Table 5 q values of the interactions between the major driving factors on the recreation development level
Driving factor Tourism popularity Economic industrialization Urbanization level Road density
Tourism popularity 0.207
Economic industrialization 0.876** 0.664
Urbanization level 0.910* 0.871* 0.848
Road density 0.484* 0.743* 0.858* 0.323

Notes: * indicates the type of interaction is two-factor enhancement; ** indicates the type of interaction is nonlinear enhancement.

4 Discussion

This case study of Wuyuan County shows that in traditional rural tourism destinations, the coupling coordination of sightseeing-accommodation-recreation is only at low or moderate levels in most scenic areas. The most direct reason for this phenomenon is that the distribution breadths of sightseeing spots, accommodation facilities, and recreational amenities decrease in turn, and the root causes maybe lie in two aspects. 1) One reason concerns the demand side. In traditional rural tourism destinations, sightseeing spots mainly rely on tourist consumption, while accommodation facilities largely depend on the consumption of tourists and other transient populations, and recreational amenities rely not only on all the transient populations but also heavily on residents. So, from the perspective of demand, the tendencies of sightseeing spots, accommodation facilities, and recreational amenities to cluster in large human settlements with many residents and transient populations become stronger in turn. 2) The second reason concerns the supply side. In China, sightseeing spots are usually constructed by the government, and the main economic resources required for sightseeing spot construction are only transportation facilities and funds. Therefore, the sightseeing spots can easily get the resources and develop, which promotes their widespread distribution. In contrast, accommodation facilities and recreational amenities are usually operated by merchants or companies. Their management needs more economic resources, such as transportation facilities and other infrastructure, funds, sites for business operation, and labor. Therefore, under the principle of maximizing economic benefits, these two tourism elements are more inclined to be clustered in large human settlements where the economic resources are more accessible.
Under the influence of market laws and driving factors, recreational amenities in traditional rural tourism destinations demonstrate a stronger tendency to be concentrated in large human settlements compared to sightseeing spots and accommodation facilities. This phenomenon tends to result in two major issues. First, in scenic areas distant from large villages or towns, an insufficient supply of recreational amenities undermines visitor satisfaction and restricts per capita tourism expenditure. Second, excessive commercialization in large traditional villages or towns—due to the clustering of various tourism facilities including recreation amenities—leads to the erosion of cultural landscapes and authentic local atmospheres. To address this, governments must regulate the spatial distribution of recreational amenities through administrative measures and preferential policies.
This study has two obvious shortcomings. First, in this particular study area, the natural factors have only a minor impact on the coupling coordination of sightseeing-accommodation-recreation, so the universality of this result for other traditional rural tourism destinations needs further verification. Wuyuan is located in the hilly areas in the south of the Yangtze River, with gentle terrain and abundant water resources, so the impacts of elevation and river network density on the distribution and coupling of tourism elements would be relatively small. Second, due to the lack of complete information on the scales of sightseeing spots and recreational amenities, no scale weighting was set for them in the kernel density analysis. For consistency, the scale differences of accommodation facilities were not considered either.

5 Conclusions and suggestions

5.1 Conclusions

The spatial coupling rules of sightseeing-accommodation-recreation in traditional rural tourism destinations are important bases for optimizing the layout and configuration of recreational amenities. This study used geographic information to investigate this issue in Wuyuan County in Jiangxi Province, a typical traditional rural tourism destination. The main conclusions are threefold.
(1) Sightseeing spots, accommodation facilities, and recreational amenities all exhibit core-periphery distribution patterns, and they are inclined to be clustered in the central town and high-level scenic areas of the traditional village type. However, because the dependence of the tourism elements of sightseeing, accommodation, and recreation on large human settlements increases sequentially, their distribution breadth decreases in that sequence, and the number and area of their agglomeration regions become sequentially smaller. Therefore, the high or extreme coupling coordination of sightseeing-accommodation-recreation only exists in the central town and a few large and famous traditional villages. The coupling coordination degree of these three tourism elements is usually low in the natural scenic areas of traditional rural tourism destinations.
(2) In traditional rural tourism destinations, socioeconomic factors such as tourism popularity, urbanization level, road density, and economic industrialization positively influence the development levels of sightseeing spots, accommodation facilities, and recreational amenities. These influences constitute the main path driving the coupling coordination of sightseeing-accommodation-recreation. The socioeconomic factor with the greatest impact on the development levels of sightseeing and accommodation is tourism popularity, while the socioeconomic factors with the greatest impacts on the recreation development level are urbanization level and economic industrialization.
(3) The positive impacts of tourism popularity, economic industrialization, urbanization level, and road network density on the development of traditional rural tourism elements can be attributed to attractive, growth, agglomeration, and convenience effects, respectively. Mutual interactions exist among these four drivers, while their specific manifestations depend on the tourism element types. The interactions with relatively strong explanatory power for the development levels of sightseeing and accommodation are all linked to tourism popularity, yet their absolute explanatory power remains only moderate. In contrast, pairwise interactions between tourism popularity, economic industrialization, and urbanization level all demonstrate exceptionally strong explanatory power for recreation development.

5.2 Suggestions

Providing recreation facilities around sightseeing spots and accommodation facilities is critical for the transition of traditional rural tourism destinations from sightseeing-oriented to leisure- and vacation-focused development. However, this case study of Wuyuan County reveals that the current state of spatial coupling of sightseeing-accommodation-recreation in these destinations remains suboptimal. Most scenic areas, particularly those of the natural type, exhibit low levels of spatial coupling and coordination, while high and extreme coupling coordination are only observed in the central town and a few large and famous traditional villages. This is not conductive to meeting the recreational needs of tourists and poses challenges to the holistic preservation of large and famous traditional villages. Based on the research findings, three recommendations are proposed.
Local authorities are advised to promote the equitable distribution of recreational amenities in traditional rural tourism destinations by strategically managing investment projects and land allocation for new construction. Economic industrialization and urbanization level serve as the major factors driving recreation development in such destinations. Therefore, the root cause for the highly concentrated distribution of recreational amenities lies in the uneven economic and social development within these regions. To address this, governments must leverage administrative tools to ensure balanced regional economic and urbanization growth. Priority for allocating public funding and construction land quotas should be given to the villages neighboring scenic areas that face recreational amenity shortages. Conversely, traditional villages already grappling with excessive urbanization and commercialization should be subjected to strict curbs on new investments and land developments.
(2) Remote natural scenic areas within rural tourism zones can enhance their accommodation facilities and recreational amenities through transportation network optimization and aggressive tourism marketing campaigns. These scenic areas—exemplified by Wuyuan's Wulongyuan Scenic Area—often struggle with inadequate hospitality facilities due to limited visitor diversity and their isolation from economic resources like workforce and material. Proposed solutions include elevating their popularity and launching shuttle bus services to maximize the catalytic effects of tourism popularity and road density on tourism element development, while simultaneously attracting workforce and external capital inflows.
(3) Differentiated management strategies for recreational amenities should be adopted for the different types of scenic areas in traditional rural tourism destinations, based on Wuyuan as an example. For traditional villages like Jiangwan that have been commercialized, the total number of tourism facilities should be restricted or reduced, and the coordinated development of sightseeing, accommodation, and recreation should be achieved by optimizing the structure and layout of these tourism elements. For traditional villages like Sixi Yan Village that have been well protected, new recreational amenities should be located on the newly acquired construction land outside the village. For remote high-level natural attractions such as Wulongyuan Scenic Area, considering their lack of accommodation facilities, recreational amenities, and human resources, one suggestion is to build some accommodation facilities and recreational amenities that are mainly operated through self-service by the tourists, such as tent camps, smart cabins, star observation platforms, fitness zones, and rope adventure mazes.
[1]
Chen B, Xu S Z, Zhou Y Y, et al. 2020. Analysis of urban spatial structure based on spatial coupling between POI and nighttime data: A case study of the main urban region in Wuhan. Bulletin of Surveying and Mapping, (7): 70-75. (in Chinese)

[2]
Chen Y, Chen S L. 2018. Model construction on the planning model of rural complexes based on coupling symbiotic theory. Chinese Journal of Agricultural Resources and Regional Planning, 39(12): 7-12. (in Chinese)

[3]
Gao R L, Zheng S Y. 2024. Coupling coordination between agriculture and tourism in the Qinba Mountain area: A case study of Shanyang County, Shanxi Province. Environment, Development and Sustainability, 26(12): 31859-31878.

[4]
Huang S, Li Y L, Li R Y. 2015. Spatial relationship and formation mechanism of geological relics and ethnic cultural resources in Western Guangxi, China. Acta Geographica Sinica, 70(9): 1434-1448. (in Chinese)

DOI

[5]
Kan X X, Gao Y E, Wang C, et al. 2020. Layout of urban tourism infrastructure in Xiamen Island using travel spatio-temporal coupling. Journal of Huaqiao University (Natural Science), 41(6): 772-778. (in Chinese)

[6]
Li J, Zhang J, Li Y X. 2022. Research on the spatio-temporal evolution of the coupling and coordinative development of regional economy, technological innovation, and logistics industry. Journal of Statistics and Information, 37(4): 24-32. (in Chinese)

[7]
Li Z. 2023. Spatial pattern and influence mechanism of national forest villages in Jiangxi Province. Journal of Zhejiang A&F University, 40(6): 1292-1299. (in Chinese)

[8]
Liang T. 2019. Coupling analysis of new rural construction and rural tourism development in Sichuan Province. Chinese Journal of Agricultural Resources and Regional Planning, 40(12): 301-306. (in Chinese)

[9]
Liu J S, Ma Y F, Wu B. 2015. Dynamic analysis of spatiotemporal differences in the coordination degree of inbound tourism flow and regional economy coupling based on panel data from 31 provinces and regions in China from 1993 to 2011. Business and Management Journal, 37(3): 33-43. (in Chinese)

[10]
Lu L, Zeng J, Yu T H. 2021. Assessment of the development potential of ancient villages based on dot rating: Taking Qinhe Ancient Fort Group in Jincheng as an example. Journal of Human Settlements in West China, 36(1): 135-140. (in Chinese)

[11]
Ma H Y. 2017. Coupling degree evaluation model of rural tourism and new rural construction based on capacity coupling coefficient model. Agro Food Industry Hi-Tech, 28(1): 2308-2321.

[12]
Ma M Y, Tang J X, Dombrosky J M. 2022. Coupling relationship of tourism urbanization and rural revitalization: A case study of Zhangjiajie, China. Asia Pacific Journal of Tourism Research, 27(7): 673-691.

[13]
Ma X F, Tan J X, Huang J. 2021. Study on the agglomeration process and influencing factors of the regional tourism industry: A case of the Western Hunan. Tourism Tribune, 36 (9): 13-27. (in Chinese)

[14]
Mao R C, Chen F, Ji X F, et al. 2022. Spatial coupling of the public transport network and the tourism and recreational industry against the background of tourism urbanization: A case study of Lijiang. Tropical Geography, 42(4): 659-673. (in Chinese)

[15]
Nie X Z. 2009. Spatial agglomeration of regional tourism. Beijing, China: Social Sciences Academic Press. (in Chinese)

[16]
Rong H F, Tao Z M. 2020. Hotspot identification and cause analysis of rural tourism based on website data: Taking Jiangsu Province as an example. Journal of Natural Resource, 35(12): 2848-2861. (in Chinese)

[17]
Sun Y H, Wu W J, Song Y X. 2022. Research on the coupling relationship between agricultural cultural heritage tourism and rural revitalization. Journal of Northwestern Ethnic Studies, (2): 133-142. (in Chinese)

[18]
Tian C, Luan W X, Wang H, et al. 2023. Spatio-temporal agglomeration and morphological causes of Shanghai catering clusters. Applied Geography, 152: 102898. DOI: 10.1016/j.apgeog.2023.102898.

[19]
Wang C H, Tang C S, Qiao H H, et al. 2020. Spatial structure characteristics of rural tourism flow based on digital footprint: A case study of Huzhou City in Zhejiang Province. Economic Geography, 40(3): 225-233, 240. (in Chinese)

[20]
Wang D G, Sha M Y, Zhu M. 2020. Coupling analysis of tourism resources superiority and poverty alleviation power in national poverty-stricken counties: A case study of 433 poverty alleviation counties. Human Geography, 35(5): 111-119, 149. (in Chinese)

[21]
Wang J F. Xu C D. 2017. Geodetector: Principle and prospective. Acta Geographica Sinica, 72(1): 116-134. (in Chinese)

DOI

[22]
Wu C, Shao X Y. 2020. Analysis of tourism image perception of ancient villages based on UGC and questionnaire data: A case study of Qikou Ancient Town. Journal of Arid Land Resources and Environment, 34(12): 195-200. (in Chinese)

[23]
Zeng L, Gao Q, Chen X L. 2021. Studying place reconstruction of traditional rural tourism destinations from the perspective of tourists’ embodied experience in Wuyuan, China. Tourism Tribune, 36(11): 69-79. (in Chinese)

[24]
Zhan L Y, Zhu Q Y. 2023. Coupling coordination research on agricultural modernization and rural tourism in the Beijing-Tianjin-Hebei urban agglomeration. Journal of Agricultural Resources and Environment, 40(5): 1146-1155. (in Chinese)

[25]
Zhang X C, Gao N, Wang L Y. 2022. Spatiotemporal evolution and function of the coordination level of the multi-system of rural tourism public service in China. Arid Land Geography, 45(1): 298-309. (in Chinese)

DOI

[26]
Zhou W Y, Liu Q Y, Li Q Y. 2023. The coupling of rural revitalization and rural tourism in former deep poverty areas: Taking Didigu Village, Ebian Yi Autonomous County as an example. Journal of Resources and Ecology, 14(5): 1034-1043.

[27]
Zhu Y F, He D, Cheng Q, et al. 2021. Spatial distribution of shared accommodations and its influencing mechanism in Shanghai: From the perspective of urban tourism. Progress in Geography, 40(8): 1321-1331. (in Chinese)

DOI

Outlines

/