
Journal of Resources and Ecology >
Efficiency of the Tourism Economy in Northeast China: Evolution, Influencing Factors and Insights
|
JIANG Yale, E-mail: 853344074@qq.com |
Received date: 2024-11-01
Accepted date: 2025-05-26
Online published: 2025-10-14
Supported by
The Social Science Research Project of The Education Department of Jilin Province(JJKH20241595SK)
The Social Science Research Project of The Education Department of Jilin Province(JJKH20251755SK)
Innovation and Entrepreneurship Development Fund of the Tourism School of Changchun University(JS2023022)
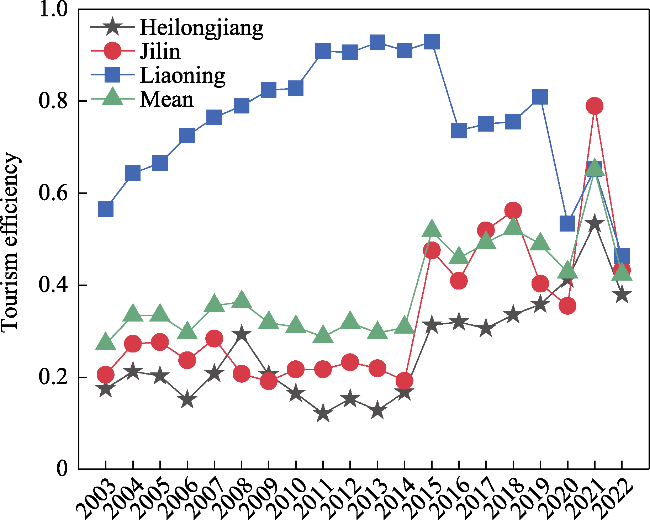
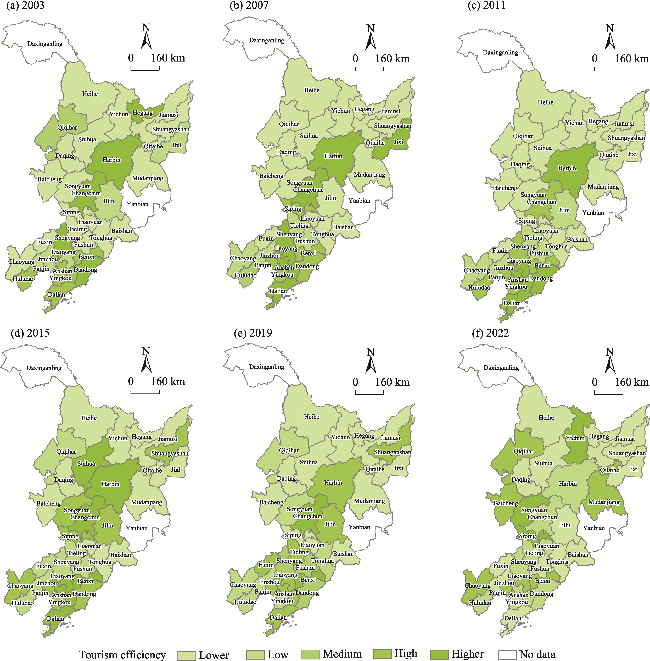
Effectively enhancing the efficiency of the regional tourism economy is a key issue in advancing high-quality tourism development in Northeast China and implementing the Northeast China Revitalization Strategy. Based on a tourism efficiency indicator system, this study employed an SBM super-efficiency model to calculate the tourism efficiency in Northeast China from 2003 to 2022 and analyzed the characteristics of its spatiotemporal evolution. A Tobit model was subsequently used to investigate the influencing factors, which can inform targeted measures to promote the high-quality development of the tourism industry. The results reveal that the tourism efficiency is relatively low overall, and it has been shaped by many factors other than policies. (1) Tourism efficiency in Northeast China remains relatively low overall. Over time, it exhibited a spiralling upward trend that moved through three developmental stages: the stable stage, the stage of rapid growth, and the stage of fluctuations. Spatially, there are two high-efficiency clusters, the Changchun-Harbin urban agglomeration and the Southeast Liaoning urban agglomeration. However, the agglomeration effect waned accordingly as tourism efficiency gradually shifted from a polarized pattern toward a more balanced distribution. (2) While policy plays a role, tourism efficiency in Northeast China is also significantly shaped by factors such as resources, location, industry, science and technology, and education. Its correlation with the level of economic development has been comparatively minor, and there are marked differences in the factors influencing tourism efficiency across the region. According to the research conclusions, a joint development system for the regional tourism economy should be constructed at the macro level. At the micro level, efforts should focus on enhancing market competitiveness through “push-pull” strategies, while each province should pursue differentiated development models tailored to its unique characteristics.
JIANG Yale , SUN Guoxia . Efficiency of the Tourism Economy in Northeast China: Evolution, Influencing Factors and Insights[J]. Journal of Resources and Ecology, 2025 , 16(5) : 1554 -1566 . DOI: 10.5814/j.issn.1674-764x.2025.05.025
Table 1 Indicator system for the efficiency of the tourism economy and descriptive data statistics |
| Index type | Primary indicator | Secondary indicator | Indicator definition | Descriptive data statistics | ||||
|---|---|---|---|---|---|---|---|---|
| N | Min | Max | Mean | SD | ||||
| Input | Labor input | Workforce scale | Total workforce in the accommodation, transportation, and entertainment sectors (104 persons) | 680 | 0.147 | 19.970 | 2.503 | 3.611 |
| Capital input | Food and accommodation facilities | Number of star-rated hotels (units) | 680 | 1.000 | 191.000 | 23.925 | 29.667 | |
| Comprehensive reception | Number of travel agencies (units) | 680 | 7.000 | 1521.000 | 159.496 | 286.894 | ||
| Sightseeing facilities | Number of 4A- and 5A-rated tourist attractions (units) | 680 | 0.001 | 33.001 | 4.464 | 5.175 | ||
| Transportation facilities | Total length of regional highways (104 km) | 680 | 0.201 | 2.797 | 1.089 | 0.642 | ||
| Cultural capital | Total number of public libraries, museums, and gymnasiums (units) | 680 | 5.000 | 409.000 | 39.738 | 46.272 | ||
| Output | Scale output | Total tourist visits | Total of inbound and domestic tourist visits (106 person-trips) | 680 | 0.052 | 150.002 | 16.694 | 20.004 |
| Revenue output | Total tourism revenue | Total of inbound and domestic tourism revenue (108 yuan) | 680 | 0.092 | 2174.530 | 164.875 | 268.854 | |
Figure 1 Tourism efficiency in Northeast China |
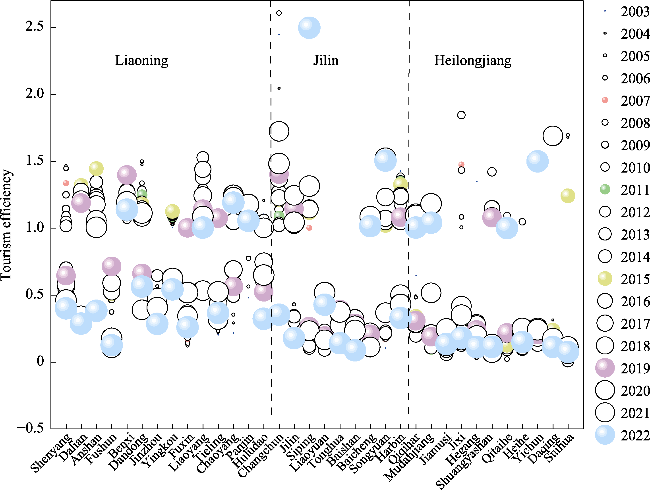
Figure 2 Tourism efficiencies of individual cities in Northeast China from 2003 to 2022 |
Figure 3 Spatial distribution of tourism efficiency in Northeast China from 2003 to 2022 |
Table 2 Spatial autocorrelation of tourism efficiency |
| Year | Moran's I | Z-score | P-value | Year | Moran's I | Z-score | P-value |
|---|---|---|---|---|---|---|---|
| 2003 | 0.102 | 1.210 | 0.226 | 2013 | 0.465 | 4.385 | 0.001 |
| 2004 | 0.208 | 2.134 | 0.033 | 2014 | 0.455 | 4.295 | 0.001 |
| 2005 | 0.104 | 1.319 | 0.187 | 2015 | 0.302 | 2.925 | 0.003 |
| 2006 | 0.181 | 1.942 | 0.052 | 2016 | 0.299 | 2.892 | 0.004 |
| 2007 | 0.337 | 3.245 | 0.001 | 2017 | 0.323 | 3.111 | 0.002 |
| 2008 | 0.211 | 2.116 | 0.034 | 2018 | 0.363 | 3.468 | 0.001 |
| 2009 | 0.283 | 2.781 | 0.005 | 2019 | 0.203 | 2.061 | 0.039 |
| 2010 | 0.354 | 3.398 | 0.001 | 2020 | -0.001 | 0.258 | 0.797 |
| 2011 | 0.507 | 4.764 | 0.001 | 2021 | 0.208 | 2.099 | 0.036 |
| 2012 | 0.515 | 4.831 | 0.001 | 2022 | -0.040 | -0.113 | 0.910 |
Table 3 High/Low clustering of tourism efficiency |
| Year | General G | Z-score | P-value | Year | General G | Z-score | P-value |
|---|---|---|---|---|---|---|---|
| 2003 | - | - | - | 2013 | 0.043 | 4.067 | 0.001 |
| 2004 | 0.037 | 2.255 | 0.024 | 2014 | 0.042 | 3.827 | 0.001 |
| 2005 | - | - | - | 2015 | 0.035 | 2.849 | 0.004 |
| 2006 | 0.036 | 1.927 | 0.054 | 2016 | 0.036 | 2.722 | 0.007 |
| 2007 | 0.039 | 3.131 | 0.002 | 2017 | 0.036 | 2.937 | 0.003 |
| 2008 | 0.036 | 2.467 | 0.014 | 2018 | 0.036 | 3.037 | 0.002 |
| 2009 | 0.038 | 2.648 | 0.008 | 2019 | 0.033 | 1.791 | 0.073 |
| 2010 | 0.039 | 3.116 | 0.002 | 2020 | - | - | - |
| 2011 | 0.045 | 4.474 | 0.001 | 2021 | 0.032 | 1.664 | 0.096 |
| 2012 | 0.044 | 4.509 | 0.001 | 2022 | - | - | - |
Note: “‒” is a null value, indicating that the spatial aggregation effect is not significant. |
Table 4 Influencing factor indicators and descriptive data statistics |
| Influencing factor | Measurement indicator | Descriptive data statistics | ||||
|---|---|---|---|---|---|---|
| N | Minimum | Maximum | Average | S.D. | ||
| res | Number of high-level natural and humanistic resources (units) | 680 | 0.001 | 40.001 | 7.523 | 6.851 |
| eco | Per capita GDP (104 yuan per person) | 680 | 0.445 | 26.614 | 4.635 | 3.464 |
| ope | Amount of actual utilized foreign capital (104 USD) | 680 | 0.001 | 1062260.000 | 41899.520 | 122314.110 |
| ind | Share of tertiary industry value added in GDP (%) | 680 | 10.420 | 82.500 | 45.586 | 12.789 |
| inf | Number of broadband connections (104 households) | 680 | 0.001 | 356.443 | 48.930 | 53.246 |
| mar | Marketization index | 680 | 2.818 | 19.131 | 10.183 | 3.324 |
| edu | Number of students enrolled in regular higher education institutions (104 persons) | 680 | 0.001 | 80.230 | 6.530 | 12.821 |
| infr | Total fixed-asset investment (108 yuan) | 680 | 4.090 | 13182.710 | 838.168 | 1422.806 |
| geo | Distance to central city (km) | 680 | 0.001 | 258.837 | 126.874 | 76.937 |
Table 5 Results of random-effects panel Tobit models |
| Influencing factor | All three north-eastern provinces | Liaoning | Jilin | Heilongjiang | ||||
|---|---|---|---|---|---|---|---|---|
| Coef. | St. Err. | Coef. | St. Err. | Coef. | St. Err. | Coef. | St. Err. | |
| res | ‒0.013** | 0.005 | 0.001 | 0.009 | ‒0.009 | 0.012 | ‒0.006 | 0.008 |
| eco | ‒0.001 | 0.009 | 0.057** | 0.023 | ‒0.050*** | 0.017 | 0.001 | 0.012 |
| ope | 0.001*** | 0.001 | 0.001*** | 0.001 | 0.001*** | 0.001 | 0.001*** | 0.001 |
| ind | 0.009*** | 0.002 | 0.010*** | 0.003 | 0.001 | 0.002 | 0.013*** | 0.003 |
| inf | ‒0.003*** | 0.001 | ‒0.005** | 0.002 | 0.003 | 0.003 | ‒0.004* | 0.002 |
| mar | 0.031*** | 0.010 | ‒0.005 | 0.017 | 0.066*** | 0.014 | 0.029* | 0.015 |
| edu | ‒0.016** | 0.008 | ‒0.012 | 0.017 | 0.018* | 0.010 | 0.072*** | 0.012 |
| infr | 0.001** | 0.001 | ‒0.001 | 0.001 | ‒0.001 | 0.001 | 0.001 | 0.001 |
| geo | ‒0.003** | 0.001 | ‒0.001 | 0.001 | ‒0.001 | 0.001 | ‒0.002 | 0.001 |
| Constant | 0.553** | 0.228 | 0.511** | 0.236 | ‒0.070 | 0.200 | ‒0.284 | 0.233 |
| Observations | 680 | 280 | 160 | 240 | ||||
Note: ***, **, and * indicate significance at the 1% level, 5% level, and 10% level, respectively. |
| [1] |
|
| [2] |
|
| [3] |
|
| [4] |
|
| [5] |
|
| [6] |
|
| [7] |
|
| [8] |
|
| [9] |
|
| [10] |
|
| [11] |
|
| [12] |
|
| [13] |
|
| [14] |
|
| [15] |
|
| [16] |
|
| [17] |
|
| [18] |
|
| [19] |
|
| [20] |
|
| [21] |
|
| [22] |
|
| [23] |
|
| [24] |
|
| [25] |
|
| [26] |
|
| [27] |
|
| [28] |
|
| [29] |
|
| [30] |
|
| [31] |
|
| [32] |
|
| [33] |
|
| [34] |
|
| [35] |
|
| [36] |
|
| [37] |
|
| [38] |
|
/
| 〈 |
|
〉 |