
Journal of Resources and Ecology >
Digital Intelligence Empowerment for Optimizing Rural Human Settlement Environments: An Ecological Strategy Based on Bionic Design and Fuzzy Semantic Computing
|
CHEN Liwei, E-mail: 85166511@qq.com |
Received date: 2025-05-01
Accepted date: 2025-08-25
Online published: 2025-10-14
This study explores the impact of bionic design features on the emotional resonance and ecological identity of residents in the optimization of rural human settlement environments, by employing quantitative analysis based on a fuzzy semantic computing model. An examination of three bionic design features—morphological differences, material integration, and functional interaction—showed that these features significantly influence the emotional resonance and ecological identity of residents. While fulfilling aesthetic and functional needs, morphological differences and material integration foster emotional connections between residents and their environment, thereby enhancing ecological identity. Functional interactivity plays a key role in promoting social interactions and improving the overall living experience. The effects of these design features on emotional resonance and ecological identity were quantified using fuzzy semantic computing, with the results further verifying their effectiveness. Fuzzy semantic computing offers a novel perspective and methodology for the quantitative evaluation of complex design features. This study provides a theoretical foundation for the design and optimization of rural human settlements in the future, and offers valuable insights for both academic research and practical applications in related fields.
CHEN Liwei , LIN Xiaohong . Digital Intelligence Empowerment for Optimizing Rural Human Settlement Environments: An Ecological Strategy Based on Bionic Design and Fuzzy Semantic Computing[J]. Journal of Resources and Ecology, 2025 , 16(5) : 1528 -1539 . DOI: 10.5814/j.issn.1674-764x.2025.05.023
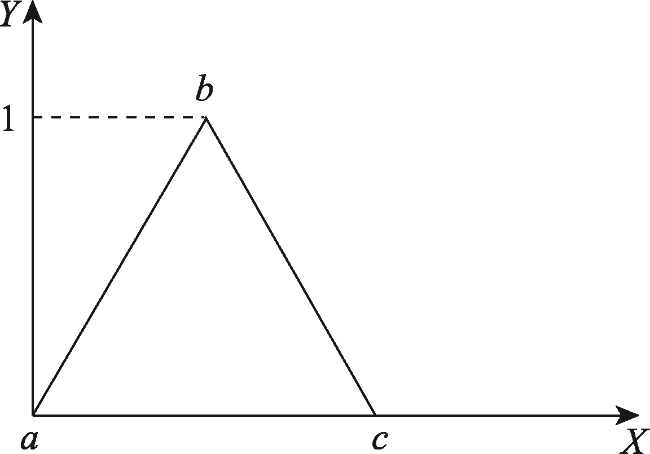
Figure 1 Diagram of the triangular fuzzy number membership degree |
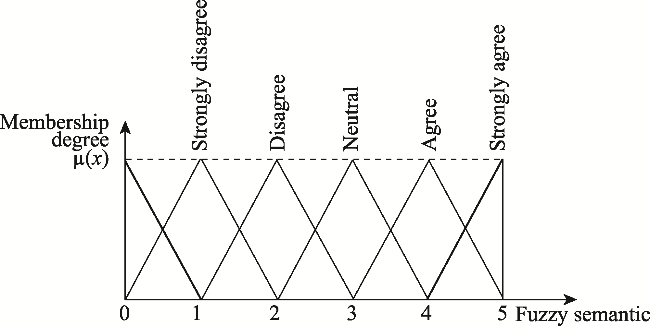
Figure 2 Diagram of the membership degree and fuzzy semantic relationships |
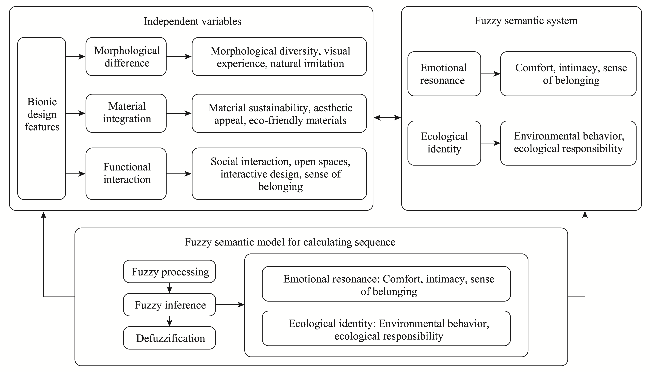
Figure 3 Fuzzy semantic relationship model of the impact of bionic design features on the emotional resonance and ecological identity of residents |
Table 1 Questionnaire design for bionic design features |
| Questionnaire items on bionic design features | 5 | 4 | 3 | 2 | 1 |
|---|---|---|---|---|---|
| Q2-1: The architectural forms in the rural environment are diverse and meet various functional and aesthetic needs | |||||
| Q2-2: The visual effects of the architecture and landscape in rural design make residents feel comfortable and pleased | |||||
| Q2-3: The architectural and landscape design in the rural environment mimics natural forms (e.g., mountains, trees, animals) | |||||
| Q2-4: The integration of natural and modern materials in rural architecture enhances the overall aesthetic appeal and harmony | |||||
| Q2-5: The architectural design in the rural environment meets the residents’ aesthetic standards and enhances comfort and visual enjoyment | |||||
| Q2-6: The design in the rural environment extensively uses eco-friendly and sustainable materials (e.g., recycled wood, green building materials) | |||||
| Q2-7: The design in the rural environment promotes social interaction among residents, such as through public spaces or activity areas | |||||
| Q2-8: Open spaces in rural design (e.g., parks, squares) provide comfortable spaces for social interaction | |||||
| Q2-9: Interactive elements in the rural design (e.g., smart guides, shared spaces) enhance the residents’ living experience | |||||
| Q2-10: Rural design enhances the sense of community belonging among residents, making them feel like part of the community | |||||
Note: This section evaluates the impact of bionic design features on the emotional resonance and ecological identity of residents. The bionic design feature evaluation uses a five-point Likert scale, with five response options for each question: “Strongly Agree”, “Agree”, “Neutral”, “Disagree” and “Strongly Disagree”, corresponding to scores of 5, 4, 3, 2, and 1, respectively. |
Table 2 Questionnaire design for the emotional resonance and ecological identity of residents |
| Emotional resonance and ecological identity | 5 | 4 | 3 | 2 | 1 |
|---|---|---|---|---|---|
| Q3-1: The architectural forms in the rural environment make you feel comfortable and pleased | |||||
| Q3-2: The architecture and landscape in rural design enhance your living experience | |||||
| Q3-3: The design of the rural environment gives you a sense of connection to nature | |||||
| Q3-4: In the rural environment, the architectural and landscape design enhances your emotional resonance | |||||
| Q3-5: The design in the rural environment makes you more willing to live there | |||||
| Q3-6: The materials used in rural design make you feel that the environment is more natural and ap-proachable | |||||
| Q3-7: The public spaces in rural design have helped you establish closer relationships with your neighbors | |||||
| Q3-8: The green spaces in the rural environment make you feel relaxed and com-fortable | |||||
| Q3-9: Interactive elements in rural design have increased your sense of community identity | |||||
| Q3-10: The rural design makes you feel like part of the community, enhancing your sense of belonging | |||||
Note: This section assesses the impact of bionic design features on the emotional resonance and ecological identity of residents. It also uses a five-point Likert scale for scoring, with five options: “Strongly Agree”, “Agree”, “Neutral”, “Disagree” and “Strongly Disagree,” corresponding to 5, 4, 3, 2, and 1 points, respectively. |
Table 3 Demographic descriptive statistics |
| Demographic variable | Sample (N=560) | Percentage (%) | |
|---|---|---|---|
| Gender | Male | 256 | 45.71 |
| Female | 304 | 54.29 | |
| Age (yr) | 20-30 | 121 | 21.61 |
| 31-40 | 416 | 74.29 | |
| 41-50 | 16 | 2.86 | |
| 51-60 | 5 | 0.89 | |
| Older than 60 | 2 | 0.36 | |
| Education | High school or below | 7 | 1.25 |
| College | 151 | 26.96 | |
| Bachelor's degree | 275 | 49.11 | |
| Master's degree | 102 | 18.21 | |
| Doctoral degree | 25 | 4.46 | |
| Annual income (yuan) | Below 20000 | 103 | 18.39 |
| 20000-50000 | 301 | 53.75 | |
| 50001-100000 | 114 | 20.36 | |
| Above 100000 | 42 | 7.50 | |
Table 4 Reliability analysis of bionic design features and the resident perceptions questionnaire |
| Item | Cronbach's α |
|---|---|
| Bionic design features | 0.957 |
| The emotional resonance and ecological identity of residents | 0.963 |
Table 5 Descriptive statistics of bionic design features (N=560) |
| Question | Fuzzy semantic value | Standard deviation |
|---|---|---|
| Q2-1 | 3.58 | 1.379 |
| Q2-2 | 4.19 | 0.967 |
| Q2-3 | 4.14 | 1.039 |
| Q2-4 | 4.08 | 1.051 |
| Q2-5 | 3.98 | 1.153 |
| Q2-6 | 4.32 | 0.800 |
| Q2-7 | 3.73 | 1.248 |
| Q2-8 | 4.11 | 1.037 |
| Q2-9 | 2.87 | 1.288 |
| Q2-10 | 4.48 | 0.543 |
Table 6 Descriptive statistics of the emotional resonance and ecological identity of residents (N=560) |
| Question | Fuzzy semantic value | SD |
|---|---|---|
| Q3-1 | 3.48 | 1.15472 |
| Q3-2 | 3.83 | 1.13738 |
| Q3-3 | 4.08 | 1.03008 |
| Q3-4 | 3.57 | 1.10718 |
| Q3-5 | 4.01 | 1.09349 |
| Q3-6 | 3.64 | 1.26438 |
| Q3-7 | 3.37 | 1.28023 |
| Q3-8 | 4.29 | 0.76578 |
| Q3-9 | 3.57 | 1.10718 |
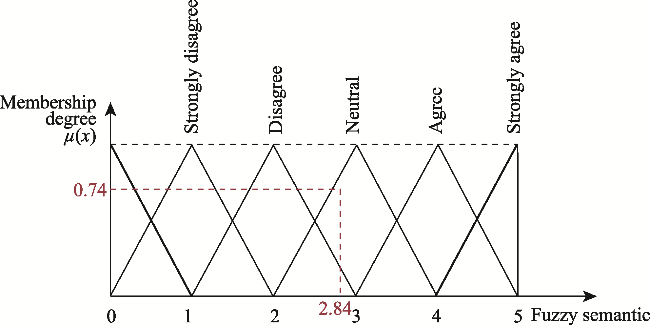
| Q3-10 | 2.84 | 1.36706 |
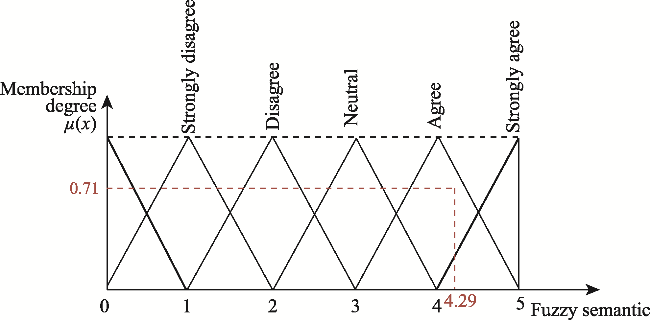
Figure 4 Membership degree and fuzzy semantic relationships of Q3-8 |
Figure 5 Membership degree and fuzzy semantic relationships of Q3-10 |
Table 7 The Chi-square test results for the association between design features and the emotional resonance and ecological identification of residents |
| Design feature | Morphological difference | Material integration | Functional interaction | |||
|---|---|---|---|---|---|---|
| X2 | P | X2 | P | X2 | P | |
| Q3-1 | 17.430 | 0.002 | 24.376 | 0.005 | 48.988 | <0.001 |
| Q3-2 | 17.901 | 0.002 | 20.975 | 0.008 | 14.591 | 0.006 |
| Q3-3 | 24.930 | 0.006 | 31.737 | 0.006 | 13.618 | 0.008 |
| Q3-4 | 17.751 | 0.009 | 20.984 | 0.009 | 45.149 | 0.007 |
| Q3-5 | 23.707 | 0.007 | 29.938 | <0.001 | 17.737 | 0.005 |
| Q3-6 | 14.600 | 0.007 | 19.025 | 0.003 | 18.279 | 0.003 |
| Q3-7 | 15.362 | 0.009 | 17.441 | 0.006 | 31.998 | 0.008 |
| Q3-8 | 12.919 | 0.001 | 10.536 | <0.001 | 6.304 | 0.001 |
| Q3-9 | 17.751 | 0.009 | 20.984 | 0.009 | 45.149 | 0.007 |
| Q3-10 | 25.181 | 0.002 | 40.650 | 0.004 | 15.513 | <0.001 |
Table 8 Regression model fit statistics (N=560) |
| Model | Beta | T | P | Adjusted R² | SD |
|---|---|---|---|---|---|
| Morphological difference | 0.517 | 0.362 | 0.009 | 0.208 | 1.126 |
| Material integration | 0.522 | 0.497 | 0.008 | 0.223 | 1.116 |
| Functional interaction | 0.549 | 1.187 | <0.001 | 0.142 | 1.106 |
Note: The dependent variables are the emotional resonance and ecological identity of residents. Coefficients are based on standardized linear regression results. |
Table 9 ANOVA results for the effects of bionic design features on the emotional resonance and ecological identity of residents |
| Model | Sum of squares | df | Mean square | F | P | |
|---|---|---|---|---|---|---|
| Morphological difference | Regression | 10.336 | 3 | 3.445 | 2.544 | 0.002 |
| Residual | 717.954 | 556 | 1.291 | |||
| Total | 728.2893 | 559 | ||||
| Material integration | Regression | 23.969 | 3 | 7.990 | 5.617 | 0.007 |
| Residual | 704.321 | 556 | 1.267 | |||
| Total | 728.289 | 559 | ||||
| Functional interaction | Regression | 35.942 | 4 | 8.986 | 7.286 | 0.003 |
| Residual | 692.347 | 555 | 1.248 | |||
| Total | 728.289 | 559 | ||||
Note: The dependent variables are the emotional resonance and ecological identity of residents. |
| [1] |
|
| [2] |
|
| [3] |
|
| [4] |
|
| [5] |
|
| [6] |
|
| [7] |
|
| [8] |
|
| [9] |
|
| [10] |
|
| [11] |
|
| [12] |
|
| [13] |
|
| [14] |
|
| [15] |
|
| [16] |
|
| [17] |
|
| [18] |
|
| [19] |
|
| [20] |
|
| [21] |
|
| [22] |
|
| [23] |
|
/
| 〈 |
|
〉 |