
Journal of Resources and Ecology >
Ethnic Minority Villages in the Upper Yangtze River Basin: Spatial Patterns, Formation Mechanisms, and Implications for Rural Revitalization
|
MA Taijia, E-mail: mataijia2022@163.com |
Received date: 2025-04-02
Accepted date: 2025-07-01
Online published: 2025-10-14
Supported by
The National Natural Science Foundation of China(42271228)
The National Natural Science Foundation of China(41871176)
The National Natural Science Foundation of China(42361028)
The Guizhou Science and Technology Foundation(ZK[2021] General 186)
The Natural Science Research Fund of Guizhou Provincial Department of Education(Guizhou Jiaohe KY Zi [2022] 156)
The Guizhou Normal University Doctoral Research Project(GZNUD [2019] 5)
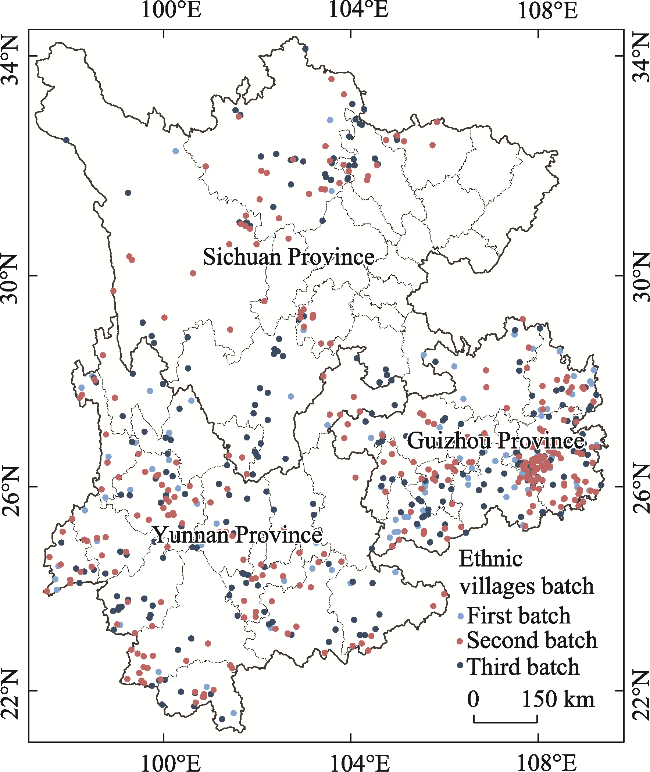
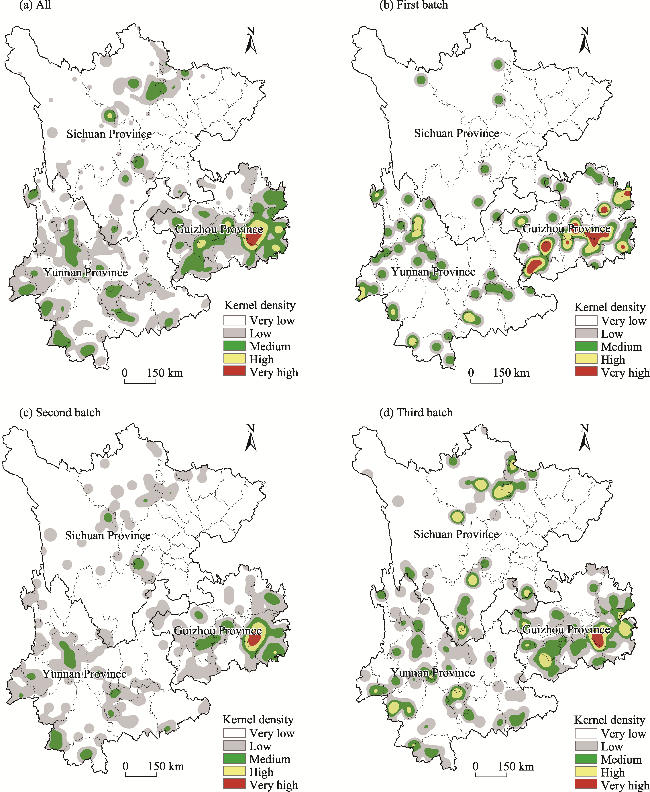
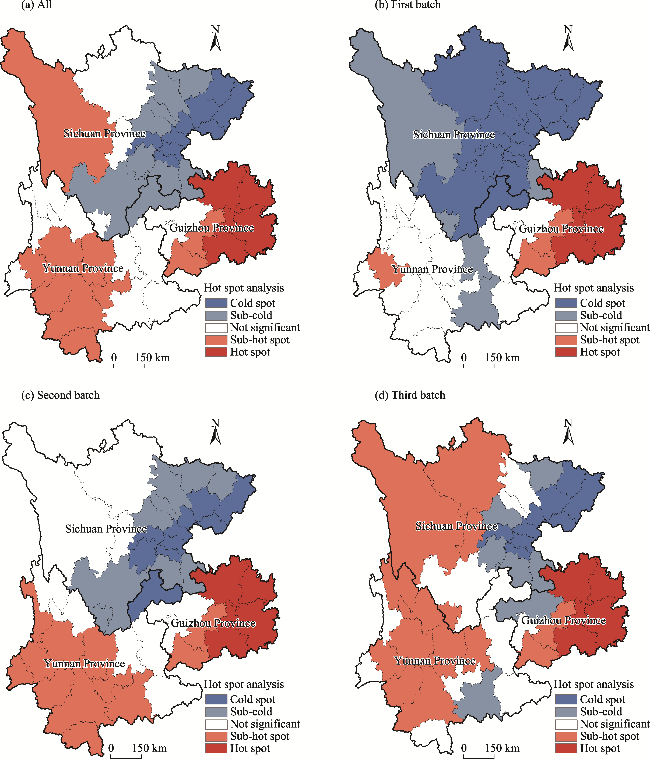
Minority characteristic villages are an important carrier of Chinese cultural heritage and key locations for the implementation of the rural revitalization strategy. This study takes 683 villages with national minority characteristics in the upper reaches of the Yangtze River Basin as the research object. It uses spatial analysis and geographic exploration technology to explore the spatial distribution characteristics of minority characteristic villages in the upper reaches of the Yangtze River Basin, the formation mechanism, and potential for rural revitalization. The results show that: (1) The spatial distribution of ethnic minority villages in the upper reaches of the Yangtze River Basin is not balanced, with an overall distribution pattern of “dense in the south and sparse in the north”. (2) The spatial distribution of ethnic villages is of the aggregation type, and the overall spatial distribution is characterized by “one nucleus with multiple points” and “cold in the north and hot in the east”. (3) The main factors affecting the spatial distribution of ethnic villages are the economy, population, ecology, transportation, and natural environment. (4) The spatial differentiation of ethnic villages in the upper reaches of the Yangtze River Basin is the result of a combination of factors. In the context of future rural revitalization, we should anchor the revitalization and protection of ethnic villages, focus on the construction of inter-regional cooperation mechanisms, refine the spatial layout and optimal integration, and sincerely devote ourselves to the excavation and inheritance of the unique culture of ethnic groups to comprehensively, profoundly, and systematically promote the efficient practice of the rural revitalization strategy.
MA Taijia , CHEN Guolei , LUO Jing , SUN Jianwei , LI Lianlian . Ethnic Minority Villages in the Upper Yangtze River Basin: Spatial Patterns, Formation Mechanisms, and Implications for Rural Revitalization[J]. Journal of Resources and Ecology, 2025 , 16(5) : 1515 -1527 . DOI: 10.5814/j.issn.1674-764x.2025.05.022
Figure 1 Spatial distribution of ethnic villages in the study area |
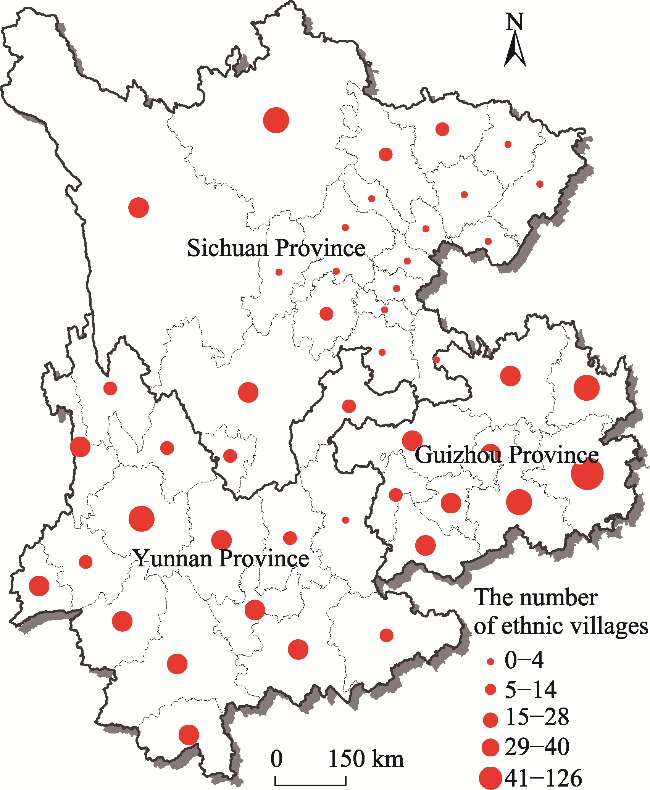
Figure 2 Gradient distribution of ethnic villages in the upper Yangtze River Basin |
Table 1 Ethnic villages at the city/prefecture level in the upper Yangtze River Basin |
| Region | Number | Percentage (%) | Region | Number | Percentage (%) |
|---|---|---|---|---|---|
| Qiandongnan | 126 | 18.45 | Leshan | 11 | 1.61 |
| Aba | 40 | 5.86 | Wenshan | 9 | 1.32 |
| Qiannan | 38 | 5.56 | Zhaotong | 9 | 1.32 |
| Dali | 38 | 5.56 | Lijiang | 7 | 1.02 |
| Tongren | 35 | 5.12 | Guangyuan | 7 | 1.02 |
| Qianxinan | 28 | 4.10 | Diqing | 6 | 0.88 |
| Honghe | 25 | 3.66 | Panzhihua | 5 | 0.73 |
| Pu’er | 24 | 3.51 | Kunming | 5 | 0.73 |
| Ganzi | 24 | 3.51 | Yibin | 4 | 0.59 |
| Anshun | 23 | 3.37 | Qujing | 2 | 0.29 |
| Chuxiong | 21 | 3.07 | Ya’an | 1 | 0.15 |
| Lincang | 20 | 2.93 | Guang’an | 0 | 0.00 |
| Yuxi | 19 | 2.78 | Zigong | 0 | 0.00 |
| Liangshan | 18 | 2.64 | Deyang | 0 | 0.00 |
| Bijie | 18 | 2.64 | Dazhou | 0 | 0.00 |
| Dehong | 17 | 2.49 | Luzhou | 0 | 0.00 |
| Nujiang | 17 | 2.49 | Meishan | 0 | 0.00 |
| Zunyi | 16 | 2.34 | Nanchong | 0 | 0.00 |
| Guiyang | 15 | 2.20 | Chengdu | 0 | 0.00 |
| Xishuangbanna | 15 | 2.20 | Neijiang | 0 | 0.00 |
| Mianyang | 14 | 2.05 | Ziyang | 0 | 0.00 |
| Liupanshui | 13 | 1.90 | Bazhong | 0 | 0.00 |
| Baoshan | 13 | 1.90 | Suining | 0 | 0.00 |
Table 2 Nearest neighbor index values and spatial distribution patterns of ethnic villages in the upper Yangtze River Basin |
| Batch | R | Z | P | Distribution pattern |
|---|---|---|---|---|
| First batch | 0.733 | -5.31 | <0.001 | Aggregation |
| Second batch | 0.649 | -11.89 | <0.001 | Aggregation |
| Third batch | 0.658 | -10.56 | <0.001 | Aggregation |
| Total | 0.635 | -18.27 | <0.001 | Aggregation |
Figure 3 Kernel density map of ethnic villages in the upper Yangtze River Basin |
Table 3 Moran's I values of the overall situation of ethnic villages in the upper Yangtze River Basin |
| Batch | Global Moran's I | Expected index value | Variance | Z value | P value |
|---|---|---|---|---|---|
| First batch | 0.5248 | -0.0222 | 0.0043 | 8.2819 | <0.0001 |
| Second batch | 0.1291 | -0.0222 | 0.0017 | 3.6292 | 0.0003 |
| Third batch | 0.1919 | -0.0222 | 0.0042 | 3.2778 | 0.0010 |
| Total | 0.2495 | -0.0222 | 0.0027 | 5.1971 | <0.0001 |
Figure 4 Cold and hot spot analysis of ethnic villages in the upper Yangtze River Basin |
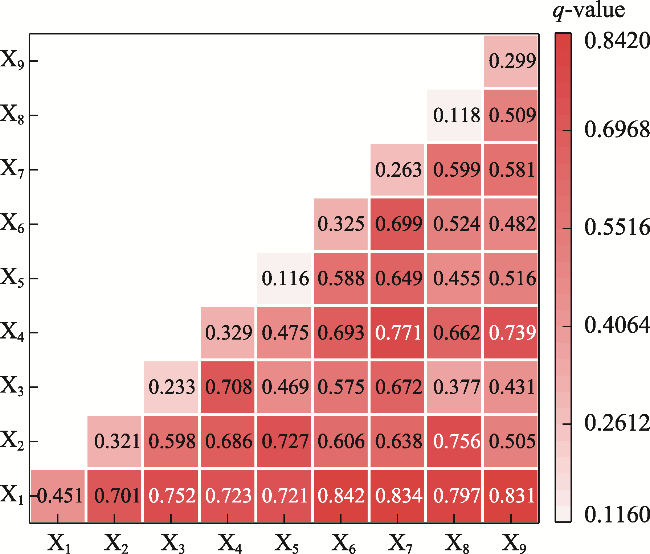
Table 4 Detection results of factors influencing ethnic villages in the upper Yangtze River Basin |
| Dimension | Indicator | Unit | q value | P value |
|---|---|---|---|---|
| Population distribution characteristics | Population of ethnic minority groups (X1) | persons | 0.451 | <0.001 |
| Population density (X2) | persons km-2 | 0.321 | <0.001 | |
| Economic development level | Urbanization rate (X3) | % | 0.233 | <0.001 |
| Rural disposable income per capita (X4) | yuan | 0.329 | <0.001 | |
| GDP per capita (X5) | yuan | 0.116 | <0.001 | |
| Ecological environmental quality | Total water resources (X6) | 108 m3 | 0.325 | <0.001 |
| Forest coverage rate (X7) | % | 0.263 | <0.001 | |
| Transportation capacity | Highway mileage (X8) | km | 0.118 | <0.001 |
| Highway density (X9) | km (104 persons)-1 | 0.299 | <0.001 |
Figure 5 Factor interaction detection results |
Table 5 Relationship between ethnic villages and elevation |
| Elevation (m) | [74, 992] | [993, 1768] | [1769, 2775] | [2776, 3867] | [3868, 7433] |
|---|---|---|---|---|---|
| First batch | 41 | 43 | 20 | 3 | 1 |
| Proportion (%) | 38 | 39.8 | 18.5 | 2.8 | 0.9 |
| Second batch | 120 | 118 | 59 | 15 | 2 |
| Proportion (%) | 38.2 | 37.6 | 18.8 | 4.8 | 0.6 |
| Third batch | 84 | 86 | 74 | 17 | 0 |
| Proportion (%) | 32.2 | 33 | 28.3 | 6.5 | 0 |
| Total | 245 | 247 | 153 | 35 | 3 |
| Proportion (%) | 35.9 | 36.2 | 22.4 | 5.1 | 0.4 |
Table 6 Relationship between ethnic villages and distance to a river |
| Distance (km) | (0, 2] | (2, 4] | (4, 6] | (6, 8] | (8, 10] |
|---|---|---|---|---|---|
| First batch | 34 | 11 | 7 | 13 | 6 |
| Proportion (%) | 31.5 | 10.2 | 6.5 | 12.0 | 5.5 |
| Second batch | 96 | 31 | 37 | 33 | 23 |
| Proportion (%) | 30.6 | 9.9 | 11.8 | 10.5 | 7.3 |
| Third batch | 73 | 30 | 27 | 17 | 26 |
| Proportion (%) | 28.0 | 11.5 | 10.3 | 6.5 | 9.7 |
| Total | 203 | 72 | 71 | 63 | 55 |
| Proportion (%) | 29.7 | 10.5 | 10.4 | 9.2 | 8.0 |
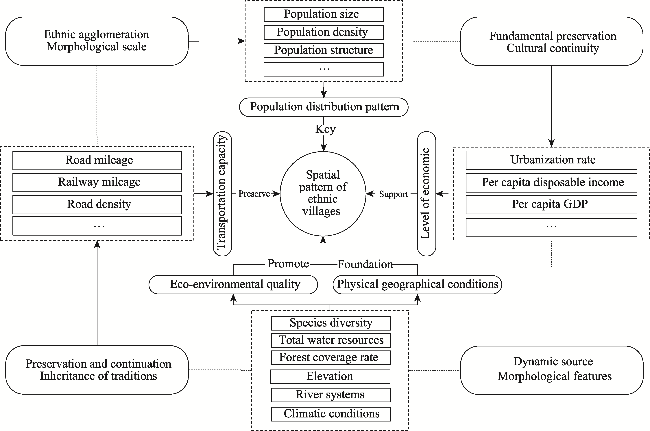
Figure 6 Mechanisms influencing the spatial distribution of ethnic villages in the upper Yangtze River Basin |
| [1] |
|
| [2] |
|
| [3] |
|
| [4] |
|
| [5] |
|
| [6] |
|
| [7] |
|
| [8] |
|
| [9] |
|
| [10] |
|
| [11] |
|
| [12] |
|
| [13] |
|
| [14] |
|
| [15] |
|
| [16] |
|
| [17] |
|
| [18] |
|
| [19] |
|
| [20] |
|
| [21] |
|
| [22] |
|
| [23] |
|
| [24] |
|
| [25] |
|
| [26] |
|
| [27] |
|
| [28] |
|
| [29] |
|
| [30] |
|
| [31] |
|
/
| 〈 |
|
〉 |