Ecosystem Assessment and Ecological Security

Habitat Suitability Analysis and Threats Assessment of Four-horned Antelope (Tetracerus quadricornis) in Banke National Park, Nepal

  • NEUPANE Mahesh , 1 ,
  • PUN Sunjeep 2 ,
  • GURUNG Bimala 3 ,
  • ARYAL Samikshya 3 ,
  • JOSHI Rajeev , 4, 5, *
Expand
  • 1. Department of National Parks and Wildlife Conservation, Chitwan National Park, Bharatpur, Bagmati 44200, Nepal
  • 2. Zoological Society of London, Po Box 5867, Kathmandu, Nepal
  • 3. Tribhuvan University, Institute of Forestry, Pokhara Campus, Pokhara, Gandaki 33800, Nepal
  • 4. College of Natural Resource Management, Faculty of Forestry, Agriculture and Forestry University, Katari, Koshi 56310, Nepal
  • 5. College of Economics and Management, Northwest A&F University, Yangling, Shaanxi 712100, China
* JOSHI Rajeev, E-mail:

NEUPANE Mahesh, E-mail:

Received date: 2024-03-26

  Accepted date: 2024-12-30

  Online published: 2025-10-14

Abstract

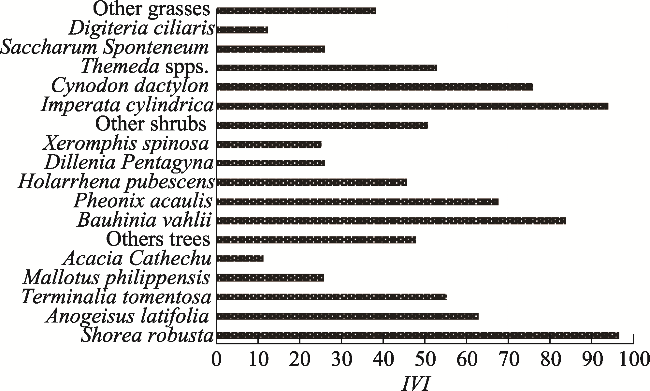
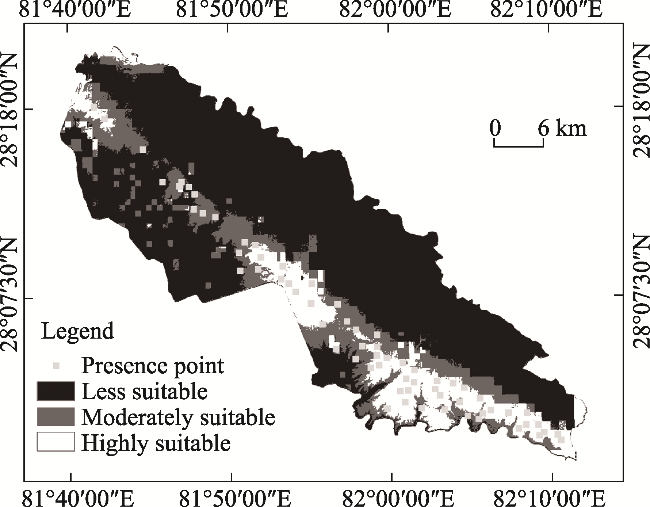
Four-horned antelope is a cryptic species endemic to Nepal and India. But having low density and with little national and global emphasis, very less importance is given in the study of the species and so, the species has very little scientific information virtually. This study signifies outset study of habitat suitability of four-horned antelope in Banke National Park. Vegetation analysis, habitat modelling by MaxEnt and threats assessment by Friedman test were done. The result from vegetation analysis showed that Shorea robusta, Bauhinia vahlii, and Imperata cylindrica were the most dominant tree, shrub, and grass species in the park with the highest IVI of 96.70, 84.06 and 94.16, respectively. Habitat suitability analysis showed that of the total area of 893 km2 of the park, only 119.44 km2 was highly suitable, 160.57 km2 was moderately suitable, whereas the remaining 612.99 km2 was less suitable habitat for FHA. Threats assessment indicated a lack of water resources to be the major threat to the species, with χ2=69.312 and P<0.001. The wildlife in the park had very little access to water, so the park management should focus on the construction and management of conservation ponds in drier areas.

Cite this article

NEUPANE Mahesh , PUN Sunjeep , GURUNG Bimala , ARYAL Samikshya , JOSHI Rajeev . Habitat Suitability Analysis and Threats Assessment of Four-horned Antelope (Tetracerus quadricornis) in Banke National Park, Nepal[J]. Journal of Resources and Ecology, 2025 , 16(5) : 1492 -1498 . DOI: 10.5814/j.issn.1674-764x.2025.05.020

1 Introduction

Habitat suitability model (HSM) or species distribution model or boldly environmental niche models relates the environmental conditions where the species are present, and then estimates the actual or potential geographic distribution of a species in space (Pearson, 2010). HSM is being used for modelling terrestrial and aquatic species’ ecological requirements and also to understand aspects of biogeography, predict existence of unknown species, biological invasions, identification of critical habitat, identify locations for translocations and reintroductions, forecast effects of environmental change, etc. (Elith and Leathwick, 2009). In the early 21st century, the increasing availability of geospatial data and computational resources played an important role in providing tools for storing and manipulating both species records and environmental data and led to a rapid advance in the development of digital models (Phillips et al., 2006). This approach has been successfully applied to model habitat for various threatened mammal species in Nepal, including the Serow (Capricornis sumatraensis) (Joshi et al., 2022) and the Greater One-horned Rhino (Rhinoceros unicornis) (Pun et al., 2022). Overall, it may be said that HSMs are created using presence data, in combination with environmental data (assuming the effects of biotic interactions to be minor), such as climate or soil datasets from various public repositories (Peterson et al., 2011).
The Four-horned Antelope, FHA (Tetracerus quadricornis), also known as Chauka (Nepali), is one of the smallest Asian bovids, found in Nepal and India (Sharma et al., 2009). FHA belongs to Order Artiodactyla and Family Bovidae and is a monotypic species. The IUCN Red List has enlisted the animal as vulnerable species (IUCN SSC Antelope Specialist Group, 2017), and is listed on CITES Appendix III in Nepal (www.cites.org). It is also listed under schedule 1 of the National Park and Wildlife Conservation Act 1973 in Nepal (Government of Nepal, 1973 . FHA is an obscure, elusive and non-gregarious antelope that stands at shoulder height of about 60-65 cm with body length of 80-100 cm and weights 17-25 kg. Population densities are generally low 0.2-2.05 animals km-2 (Rice, 1991; Leslie and Sharma 2009), which represents its solitary nature and lives in open ground to dry deciduous forests and open forests. It is selective browser and prefers nutritious plant parts, such as fruits, flowers, leaves over grass (Sharma et al., 2009; Das et al., 2019). In Nepal, they are reported from Banke NP (BaNP, 2018), Parsa NP, Bardia NP, Chitwan NP (Jnawali et al., 2011) and forests next to these protected areas (Jnawali et al., 2011; Khanal et al., 2017).
Banke National Park (BaNP) is the prime habitat of FHA, where the endemic species is threatened by the loss of its natural habitat due to dried up water resources, fragmented and patchy habitat, forest fire, invasion by weeds (Mikania mickrantha) and woody vegetation (BaNP, 2018). This is the least studied antelope in Nepal and adequate information is not available to make an accurate assessment of the extinction risk of this species (Jnawali et al., 2011). No attempts have been made on habitat analysis of the species to determine whether BaNP can support the sparse population of the endemic species or not. While habitat suitability studies have been conducted for other species in Nepal's protected areas, such as the Sloth Bear (Melursus ursinus) in Chitwan National Park (Sharma et al., 2022), no such attempt has been made for the Four-horned Antelope in BaNP. Nationally, status of the species is data deficient and further research may enlist the species as endangered status. Even the baseline information is lacking for FHA in this young NP. Hence, this research will be carried out to provide baseline information regarding habitat suitability of FHA for their timely management in BaNP. The primary goals of the research included evaluating vegetation composition within BaNP, creating a habitat suitability map using MaxEnt modeling and GIS analysis to identify suitable habitat for T. quadricornis, and assessing the threats posed to the species.

2 Materials and methods

2.1 Study area

Banke National Park was established in 2010 as Nepal's 10th National Park. It lies between 27°58′13″-28°21′26″N and 81°39′29″-82°12′19″E. It covers an area of 550 km² and a buffer zone of 343 km², with most parts falling in the Churia Range. The park has sub-tropical monsoon climate and receives an average rainfall of 1474 mm. The park is home to 263 species of flora, 34 species of mammals, 236 species of birds, 24 species of reptiles, 9 species of amphibians and 55 species of fish (BaNP, 2018).

2.2 Data collection

All the data were collected in March, 2020.

2.2.1 Vegetation analysis

The core area of the national park was limited to slope below 15° in the ArcMap as FHA was said to be found in the foothills of Churia during the key informant interview and are the northernmost limit for FHA (Pokharel et al., 2016). Thus the effective area for the vegetation analysis was 191 km². Two phase systematic sampling was adopted for field survey. In the first phase, 1 km×1 km grid was superimposed in the effective study area, yielding, altogether 192 clusters (Grid cells). In the second phase, out of 192 grid points, 85 were selected by using Cochran's formula, considering homogeniety of study area, which were identified by Random number generator in Excel.
$n=\frac{{{n}_{0}}}{1+\frac{{{n}_{0}}-1}{N}}$
where n is the sample size; n0 is the initial sample size estimate, before adjusting for the finite population size; N is the population size.
${{n}_{0}}=\frac{{{Z}^{2}}pq}{{{e}^{2}}}$
where Z is the selected critical value of desired level; p is the estimated proportion of attribute that is present in the population; e is the desired level of precision, q= 1-p.
Finally, two plots were considered; 250 m eastern and 250 m southern direction from the grid points. Hence, total of 170 sample plots were surveyed. Center point of coordinates of each grid uploaded on GPS was navigated. Three concentric circular plot size of 500 m² was taken for trees, 100 m² for shrubs and 1 m² for grasses in each plot (Poudel et al., 2022). The diameter and height of trees were measured by diameter tape and Abney's level respectively.

2.2.2 Habitat suitability analysis

In Banke National Park is home to angulates such as, spotted deer, samber deer, blue bull, wild boar, etc. For the data collection of FHA first differences in the signs to FHA with other angulates were identified. The footprints are relatively small, with a narrow, elongated shape compared to other antelope species, dung is typically small, pellet-like, and often found in clusters, freshly nipped branches or foliage that show signs of browsing at a height consistent with the antelope's feeding habit, etc. After this, a field survey was conducted, the presence of FHA was recorded by GPS whenever the species was sighted or where the middens, footprints or any other indirect signs of FHA were present. Additional presence points were also obtained from Oli et al. (2018). The environmental data such as DEM (Digital Elevation Model) was obtained from USGS Earth Explorer (https://earthexplorer.usgs.gov/). The road feature was obtained from Open Street Map (https://www.openstreetmap.org/). Settlements were digitized from Google Earth Pro version 7.3. Similarly, the bioclimatic data were downloaded from WorldClim (https://www.worldclim.org/). Hence, total 24 environmental variables were obtained. Table 1 gives the list of environmental variables obtained from various sources with their resolution.
Table 1 Environmental variables obtained from various sources
SN Environmental
variables
Resolution Sources
1. DEM 32 m https://earthexplorer.usgs.gov
2. Landcover 500 m https://earthexplorer.usgs.gov
3. Bioclimatic variables 30 sec
(approx. 1 km)
https://www.worldclim.org
4. Road Vector data https://www.openstreetmap.org
5. Settlements Vector data Google Earth Pro 7.3

2.2.3 Threats assessment

The threat assessment for FHA involved a multi-step approach to ensure a comprehensive evaluation of environmental risks. Initially, focus group discussions were conducted with park officials, Buffer Zone User Committees (BZUC), Buffer Zone User Groups (BZUGs), and local communities.
Subsequently, field surveys included opportunistic searches to observe and document immediate environmental threats not covered in discussions. These surveys allowed for real-time assessment of habitat conditions and emerging issues. In addition, ten key informant interviews were carried out with Assistant Wardens, park staff, and members of Buffer Zone Management Committees (BZMCs), who offered expert evaluations and ranked the severity of various threats. This integrated approach, combining focus group feedback, field observations, and expert interviews, ensured a thorough understanding of the challenges and informed the development of targeted conservation strategies to effectively address and mitigate these threats, thereby supporting the protection and sustainability of Nepal's valuable biodiversity.

2.3 Data analysis

2.3.1 Vegetation analysis

Vegetation composition of study areas was calculated from vegetation data collected from the field using the following relation developed by Curtis (1959).
Density and relative density:
$Density \ of \ species \ A=\frac{ Total \ number \ of \ individuals \ of \ species \ A}{ Total \ number \ of \ plots \ sampled \times { \ Area \ of \ plot }}$
$\begin{array}{l} { Relative \ density \ of \ species \ A}\\ =\frac{ Total \ individuals \ of \ species \ A}{ Total \ individuals \ of \ all \ species } \times 100 \end{array} $
Frequency and relative frequency:
$\begin{array}{l} { Frequency \ of \ species \ A}\\ =\frac{ number \ of \ plots \ in \ which \ species \ A \ occur }{ \ Total \ number \ of \ plots \ sampled } \end{array}$
$\begin{array}{l} { Relative \ frequency \ of \ species \ A}\\ =\frac{ Frequency \ of \ species \ A}{ Total \ frequency \ value \ of \ all \ species } \times 100 \end{array}$
Cover and relative cover:
Cover%=Average cover of species A
${ Relative \ cover }=\frac{ Average \ cover \ of \ species \ A}{Total \ cover \ of \ all \ species } \times 100$
Relative dominance:
$\begin{array}{l} \ { Relative \ dominance \ of \ species \ A}\\ =\frac{ Total \ basal \ area \ of \ species \ A}{ Total \ basal \ area \ of \ all \ species } \times 100 \end{array}$
Basal area of species A=$pi {{\left( \frac{d}{2} \right)}^{2}}$
where d=diameter at breast height.
Importance Value Index (IVI):
For grasses:
IVI=Relative density+Relative frequency+Relative cover
For trees and shrubs:
IVI=Relative Density+Relative Frequency+Relative Dominance

2.3.2 Habitat suitability analysis

All the environmental variables obtained were imported in ArcMap and projected to the same coordinate system (WGS 1994 UTM Zone 44N). Then, the variables were ‘Extracted by mask’ with the same extent as study area, ‘Resampled’ with the same cell size as DEM (30 m), reprojected to geographic coordinate system and finally converted to ASCII format for MaxEnt. Before analysis in MaxEnt, correlation test was done for environmental variables in ENM tools (ActivePeri 5.28), which identifies spatially correlated variables by Pearson correlation test (R>0.75) (Warren et al., 2011). This resulted in 9 non-correlated environmental variables (Table 2). These variables were imported to R version 4.0.2 and enmeval package via dismo version 1.1.4 was used to determine the features and regularization multiplier based on ΔAICc (Akaike Information Criterion) to prevent overfitting of the model. 66 presence data (minimum distance of 30 m) obtained from the field were imported in Excel and converted to.csv format. Finally, the presence data and non-correlated variables were imported in MaxEnt for analysis. The random test percentage was set 30 and 10 replicates were performed (Phillips and Dudik, 2008), Linear, Quadratic and Hinge features were used, regularization multiplier was set to 3 and background points and all other values were kept as default. The Jackknife test was done to measure each variable importance. The AUC value analysis was done to measure the model performance. If AUC>0.5, it is no better than any random model, AUC>0.8 it is a good model and if AUC>0.9 it is a very good model (Glover- Kapfer, 2015). This model evaluation metric has been similarly employed in recent habitat suitability studies within the region (e.g., Joshi et al., 2022). Then, a suitability map was prepared in ArcMap.
Table 2 Variables with low correlation
SN Environmental variables
1. Bio1-Annual mean temperature
2. Bio3-Isothermality (Bio2/Bio7) (×100)
Bio2-Mean diurnal range (Mean of monthly (max temp-min temp))
Bio7-Temperature annual range (Bio5-Bio6)
Bio5-Max temperature of warmest month
Bio6-Min temperature of coldest month
3. Bio9-Mean temperature of driest quarter
4. Bio19-Precipitation of coldest quarter
5. Elevation
6. Landcover
7. Slope
8. Road
9. Settlement

2.3.3 Threats assessment

Major five threats to the species prevalent in the area were identified and ranked. People were asked to rank the threats from 1 (Extremely high) to 5 (Low). The rankings were then imported to SPSS version 23 and mean ranks was obtained by the Friedmann test with 0.05 level of significance.
$F=\frac{12}{nk(k+1)}+\underset{i=1}{\overset{k}{\mathop{\mathop{\sum }^{}}}}\,R_{i}^{2}-3n(k+1)$
where F= Friedmann test (Q); n= number of observations; k=number of treatments i.e. threats; and Rj=sum of ranks for the j-th treatments.

3 Results and discussion

3.1 Vegetation analysis

In the study area, the Importance Value Index (IVI) of the recorded species is summarized in Figure 1. Among the tree species, Shorea robusta was identified as the most dominant, exhibiting the highest IVI of 96.70. This was followed by Anogeissus latifolia, which had an IVI of 62.96. Additional tree species observed include Semecarpus anacardium, Garuga pinnata, Bombax ceiba, and Ougeinia oojeinensis. For shrubs, Bauhinia vahlii demonstrated the highest dominance, with an IVI of 84.06, surpassing Phoenix acaulis, which had an IVI of 67.78. Other shrub species recorded are Ziziphus nummularia, Dioscorea spp., and Senegalia pennata. In the grass category, Imperata cylindrica was the most dominant species, achieving an IVI of 94.16. Other grass species present include Thysanolaena maxima, Eulaliopsia binata, Equisetum debile, and Kyllinga brevifolia.
Figure 1 Importance Value Index (IVI) of vegetation

3.2 Habitat suitability analysis

3.2.1 Habitat suitability map

Figure 2 shows the probability of occurrence of FHA, the probability of occurrence between 0 (unsuitable) to 1 (suitable). Map was prepared in ArcMap using 10 percentile training presence logistic threshold which was 0.2331 i.e. area below this value is less suitable and value above this threshold was equally divided into two further categories: moderately suitable and most suitable. Out of total area of 893 km², including core area and buffer zone, only 119.44 km2 was highly suitable, 160.57 km2 was moderately suitable, whereas remaining 612.99 km2 was less suitable habitat for FHA in BaNP. The average test AUC for 10 replicates was 0.884, with the standard deviation of 0.033, which indicates that the model is close to a very good model.
Figure 2 Suitability map of FHA in Banke NP

3.2.2 Jackknife test of variable importance

Figure 3 shows the results of the jackknife test of individual variable importance. Bio1 (Annual mean temperature) has the highest gain when it is used in isolation which appears to have the most useful information by itself and Landcover decreases the gain the most when it is removed from the model which seems to contain information that isn’t present in other variables.
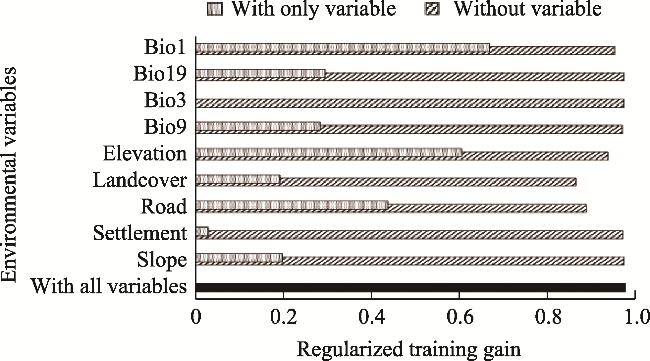
Figure 3 Jackknife test of each variable importance
The table 3 gives average estimates of relative contributions of each environmental variable for the 10 replicates to the model. Road is the highest contributor to the model both in percent contribution and Bio1 is the highest contributor in permutation importance.
Table 3 Contribution of variable model
Variables Percent contribution (%) Permutation importance
Road 30.4 30.8
Bio1 21.3 34.6
Elevation 17.6 26.3
Landcover 16.8 1.1
Bio19 11.3 0.2
Bio9 0.9 3.7
Slope 0.8 1.6
Settlement 0.6 0
Bio3 0.3 1.7

3.3 Threats assessment

Non-parametric Friedman Test of ranking of the threats showed that majority of the people have perceived absence of water resources to be the major threat to the FHA in the area which is then followed by lack of grassland, forest fire, invasive species (Mikania micrantha) and road kills. Test showed that there is statistically significant difference in the mean ranks of the different threats perceived by the informants (χ² = 69.312, P<0.001), see Table 4.
Table 4 Friedman Test of ranking of the threats
S.N. Threats Mean rank
1. Absence of water resources 1.36
2. Lack of grassland 2.52
3. Forest fire 2.56
4. Invasive species 3.76
5 Road kills 4.80

4 Discussion

The result of vegetation analysis showed that Shorea robusta was the most dominant tree species in the study area with the highest IVI of 96.70 followed by Anogeissus latifolia, Terminalia tomentosa, Mallotus philippensis, Acacia catechu and others. This finding was similar to the result from Khadka et al. (2019) having Shorea robusta as the dominant species. In the case of shrubs, Bauhinia vahlii was the dominant species with an IVI of 84.06. Subsequently, the dominant shrub species were Pheonix acaulis, Holarrhena pubenscens, Dillenia pentagyna, Xeromphis spinosa and other species. Similarly, Imperata cylindrica was the dominant grass species with an IVI of 94.16 followed by Cynodon dactylon, Themeda spp., Saccharum spontaneum, Digiteria ciliaris and other species. Diet analysis of FHA by Oli et al. (2018) found that species mostly fed on Mallotus philippensis, Xeromphis spinosa, Terminalia sps., Acacia catechu, Imperata cylindrica, etc. This indicates that the park has suitable vegetation composition for the species.
The habitat suitability model showed that of the total area of 893 km² of BaNP, only 119.44 km² was highly suitable habitat for FHA, 160.57 km² was moderately suitable, whereas the remaining 612.99 km² was less suitable. The model also showed that some areas of the buffer zone had suitable habitat for the species. Consequently, these buffer zone areas must be taken into consideration while preparing the management plan for FHA. The presence of suitable habitat in the buffer zone necessitates inclusive conservation planning that engages local communities, an approach that has proven necessary for the conservation of other species, such as the Wild Water Buffalo (Subedi et al., 2023). Majority of the suitable areas are in the southeastern and western parts of the park which indicates that the species moves to the southern forests and Bardia NP crossing the East West highway and crossing Kohalpur-Surkhet highway respectively. The result from the Jackknife test of individual variable importance indicated that Bio1 (Annual mean temperature) had the highest gain when it is used in isolation which means that it has the most useful information by itself. Landcover decreases the gain the most when it is removed from the model which seems to contain the information that isn’t present in other variables. Road had highest percent contribution and Bio1 had the highest permutation importance for the model. Response curve of Road indicated that species presence decreases upto 500 m distance to the road and increases after that. Landcover type Savannas was the most suitable landcover to the species. Bio1 having high importance indicates that species presence is affected by the fluctuation in the temperature of the area. This result is in contrast with the results obtained from Pokharel et al. (2016) in which bioclimatic variable 17 (BIO17-Precipitation of driest quarter) is the major contributor to the model. This difference might be because preselected variables were used by Pokharel et al. (2016) and the species occurrence data was obtained from GBIF (Global Biodiversity Information Facility).
The Friedmann test indicated that absence of water resources in BaNP is the major threat prevailing to the species. The dried up seasonal rivers and unmanaged conservation pond promoted to low water availability in the park. Lack of grassland was the subsequent threat to the species. The grasslands were patchy and sparse in the park. Similarly, forest fire in the dry season is another major threat to the species. The dry season fire burns most of the ground vegetation. Other threats include invasive species (Mikania micrantha, Lantana camara) and road kills. This finding is in contrast to the findings of Koirala (2018) in which forest fire was major threat to the species. This difference in result may be because of difference in season of data collection. Irrespective of the primary threat ranking, effective conservation strategies must address these habitat limitations while also managing potential human-wildlife conflicts in the buffer zones, a common challenge for protected areas in Nepal (Bhatta and Joshi, 2020; Subedi et al., 2020).

5 Conclusions

Shorea robusta was the dominant tree species in the study area. Similarly, Bauhinia vahlii and Imperata cylindrica were the dominant shrub and grass species respectively. The habitat suitability analysis using presence points based on direct sighting and sign surveys such as middens and footprints, and environmental variables, showed that only 119.44 km² was highly suitable and 160.57 km² was moderately suitable habitat for FHA. The large portion of the suitable area lies on core area at the foothills of Churia in the flatter areas. Road and Bio1 (Annual mean temperature) contributed the most for the model in MaxEnt. Friedman test of ranking of the threats indicated lack of water resources inside the park to be the prominent threats to the species.

Acknowledgements

The authors would like to acknowledge Banke National Park and Department of National Park and Wildlife Conservation (DNPWC) for providing permission to conduct the research. Similarly, authors also like to acknowledge Institute of Forestry, Banke officials, Banke Army and local people of BaNP for assisting us in the research. This work was supported by President Chure-Terai Madhesh Conservation Development Board.
[1]
BaNP. 2018. Banke National Park and its buffer zone management plan 2075/76-2079/80. Banke, Nepal: Banke National Park Office. http://dnpwc.gov.np/media/publication/Banke_National_Park_Management_Plan_pdf.

[2]
Bhatta M, Joshi R. 2020. Analysis of human-wildlife conflict in buffer zone area: A case study from Shuklaphanta National Park, Nepal. Grassroots Journal of Natural Resources, 3(3): 28-45.

[3]
Curtis J T. 1959. The vegetation of Wisconsin: An ordination of plant communities, Madison, USA: University of Wisconsin Press.

[4]
Das U K, Behere S K, Behera S N, et al. 2019. Study on habitat occupancy of the chousingha or Four-horned Antelope (Tetracerus quadricornis, Blainville 1816) in Boudh forest division, Central Odisha, India. International Educational Scientific Research Journal, 5: 15-19.

[5]
Elith J, Leathwick J R. 2009. Species distribution models: Ecological explanation and prediction across space and time. Annual Review of Ecology, Evolution, and Systematics, 40: 677-697.

[6]
Glover-Kapfer P. 2015. A training manual for habitat suitability and connectivity modeling modeling using tigers (Panthera tigris) in Bhutan as example. WWF Bhutan, DOI: 10.13140/RG.2.2.34804.86409.

[7]
IUCN SSC Antelope Specialist Group. 2017. Tetracerus quadricornis. The IUCN Red List of Threatened Species 2017: e.T21661A50195368. DOI: 10.2305/IUCN.UK.2017-2.RLTS.T21661A50195368.en.

[8]
Jnawali S R, Baral H S, Lee S, et al. 2011. The status of Nepal mammals: The national red list series. Kathmandu, Nepal: Department of National Parks and Wildlife Conservation.

[9]
Joshi R, Basnet D B, Paudel B. 2022. Geospatial analysis of habitat suitability for Capricornis sumatraensis (Bechstein, 1799) (Mammalia: Herbivora) in Annapurna Conservation Area of Nepal using MaxEnt Model. Iranian Journal of Animal Biosystematics, 18(2): 121-138.

[10]
Khadka G, Mandal R, Mathema A B. 2019. Comparison of growing stock, carbon stock and biodiversity in and around Banke National Park, Nepal. International Journal of Advanced Research in Botany, 5(4): 1-9.

[11]
Khanal C, Ghimirey Y, Acharya R, et al. 2017. First record of four- horned antelope (Tetracerus quadricornis) (De Blainville, 1816) in Deukhuri valley: First camera trap record outside protected areas of Nepal. Gnusletter, 34: 24-26.

[12]
Koirala S. 2018. Empirical study and community awareness on four-horned antelope (FHA) in Banke National Park and its buffer zones. The Rufford Foundation. RSG reference 20908-1. https://www.rufford.org/projects/sabina_koirala.

[13]
Leslie D M Jr, Sharma K. 2009. Tetracerus quadricornis (Artiodactyla: Bovidae). Mammalian Species, 843: 1-11.

[14]
Oli C B, Panthi S, Subedi N, et al. 2018. Dry season diet composition of Four-horned Antelope Tetracerus quadricornis in tropical dry deciduous forests, Nepal. PeerJ, 6: e5102. DOI: 10.7717/peerj.5102.

[15]
Pearson R. 2010. Species’ distribution modeling for conservation educators and practitioners. Lessons in Conservation, 3: 54-89.

[16]
Peterson A T, Soberón J, Pearson R G, et al. 2011. Ecological niches and geographic distributions (MPB-49). Princeton, USA: Princeton University Press.

[17]
Phillips S J, Anderson R P, Schapire R E. 2006. Maximum entropy modeling of species geographic distributions. Ecological Modelling, 190(3-4): 231-259.

[18]
Phillips S J, Dudík M. 2008. Modeling of species distributions with Maxent: New extensions and a comprehensive evaluation. Ecography, 31(2): 161-175.

[19]
Pokharel K P, Ludwig T, Storch I. 2016. Predicting potential distribution of poorly known species with small database: The case of Four-horned Antelope Tetracerus quadricornis on the Indian subcontinent. Ecology and Evolution, 6(8): 2297-2307.

[20]
Poudel A, Joshi M, Jha S, et al. 2022. Analysis of vegetation dynamics of tree species inside the forest of institute of forestry, Hetauda. Forestry: Journal of Institute of Forestry, Nepal, 19(1): 100-109.

[21]
Pun S, Joshi R, Subedi R, Bhattarai S, et al. 2022. Geospatial analysis of habitat suitability for greater one-horned Rhino Rhinoceros unicornis (Linnaeus, 1758) in central lowlands of Nepal using MaxEnt model. Borneo Journal of Resource Science and Technology, 12(1): 166-176.

[22]
Rice C G. 1991. The status of Four-horned Antelope Tetracerus quadricornis. Bombay, India: Bombay Natural History Science.

[23]
Sharma B, Joshi R, Sathyakumar S. 2022. Habitat suitability modelling for sloth bear (Melursus ursinus) in Chitwan National Park, Nepal. Journal of Animal Diversity, 4(3): 31-43.

[24]
Sharma K, Rahmani A R, Chundawat R S. 2009. Natural history observation of Four-horned Antelope Tetracerus quadricornis. Journal of the Bombay Natural History Society, 106: 72-82.

[25]
Subedi A, Joshi R, Ghimire S, Bhatta S, et al. 2023. Exploring habitat suitability for Bubalus arnee (Kerr, 1792) (Mammalia: Artiodactyla: Bovidae) and its interplay with domestic cattle within Koshi Tappu Wildlife Reserve. Journal of Animal Diversity, 5(3): 55-71.

[26]
Subedi P, Joshi R, Poudel B, et al. 2020. Status of human-wildlife conflict and assessment of crop damage by wild animals in buffer zone area of Banke National Park. Asian Journal of Conservation Biology, 9(2): 196-206.

[27]
Warren D, Glor R, Turelli M. 2011. ENMTools user manual v1.0. http://www.danwarren.net/enmtools/ENMTools_User_Manual%201.0.pdf

Outlines

/