Ecosystem Assessment and Ecological Security

Comprehensive Evaluation of Soil Quality in the Siltation Area of the Lower Reaches of the Yellow River Based on the Minimum Data Set

  • FENG Yongguang , 1 ,
  • MA Shuai 2 ,
  • CHEN Kun , 1, * ,
  • ZHOU Kunhong 1 ,
  • DENG Wenbin 1 ,
  • DENG Haoren 1 ,
  • LI Cheng 2 ,
  • SUN Zhilong 2
Expand
  • 1. China Coal Geology Group Co., Ltd., Beijing 100040, China
  • 2. College of Soil and Water Conservation, Beijing Forestry University, Beijing 100083, China
* CHEN Kun, E-mail:

FENG Yongguang, E-mail:

Received date: 2025-04-17

  Accepted date: 2025-08-11

  Online published: 2025-10-14

Supported by

The Project of China Coal Geology Group Co., Ltd.(2023HXFWSBXY005)

Abstract

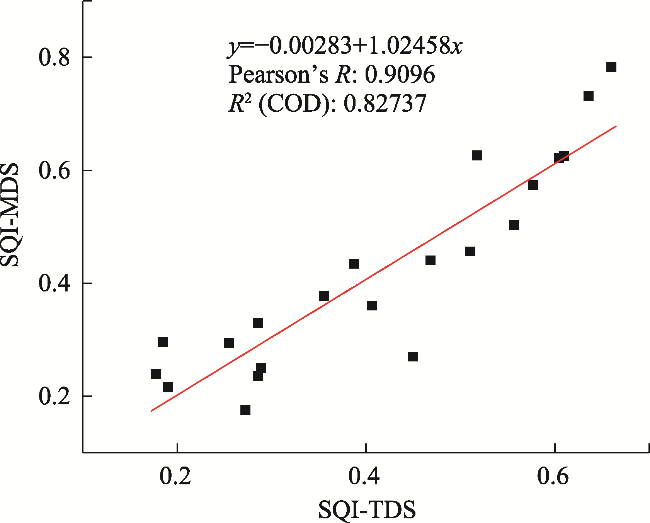
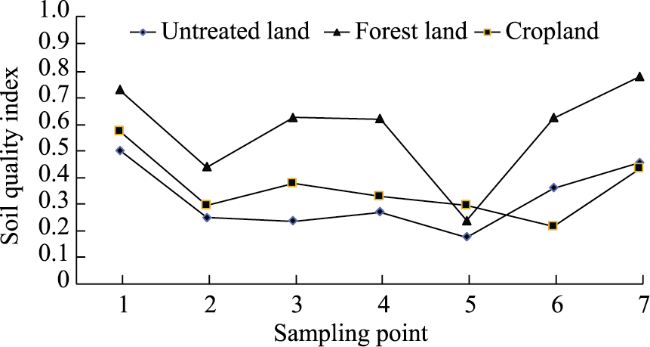
Preserving the soil quality of the siltated back area in the lower reaches of the Yellow River Basin is the key to the sustainable ecological development of the Yellow River Basin. Soil quality has gradually become an important part of the ecological landscape construction, so the evaluation of soil quality in the lower reaches of the Yellow River is helpful for the rational utilization of soil resources, and can effectively guide the actual development and construction of the silt back area. After collecting the siltated soil under three different utilization modes in the Gaoqing County section of the lower reaches of the Yellow River Basin, 16 soil physical and chemical properties were used as evaluation indexes. The principal component analysis method was used to combine the correlations between the indexes, and the suitable soil indexes were selected to establish a minimum data set for comprehensively evaluating the soil quality of the silt back soil. The results show three key aspects of this system. (1) The minimum dataset for the quality evaluation of siltated soil in the siltation area of the lower reaches of the Yellow River comprised six indexes: capillary water holding capacity, available phosphorus, water content, water-stable macroaggregate content, available potassium and alkaline hydrolyzable nitrogen. The soil quality index SQI-MDS was 0.421, the overall soil quality level was low, and the soil nutrient content was generally “nitrogen deficiency and potassium deficiency”. (2) The linear fitting R2=0.82737 between the full dataset and the minimum dataset indicated a positive correlation, so the minimum dataset can accurately evaluate the quality of the soil in the silt back area. (3) The soil quality index values of bare land, forest land and cultivated land were 0.321, 0.581 and 0.360, respectively, with the highest soil quality in forest land and the lowest soil quality in bare land. The findings of this paper can provide a theoretical basis and reference for the rational utilization and sustainable development of sedimentary soil in the lower reaches of the Yellow River.

Cite this article

FENG Yongguang , MA Shuai , CHEN Kun , ZHOU Kunhong , DENG Wenbin , DENG Haoren , LI Cheng , SUN Zhilong . Comprehensive Evaluation of Soil Quality in the Siltation Area of the Lower Reaches of the Yellow River Based on the Minimum Data Set[J]. Journal of Resources and Ecology, 2025 , 16(5) : 1450 -1459 . DOI: 10.5814/j.issn.1674-764x.2025.05.016

1 Introduction

As the largest river with the highest sediment content in the world, the Yellow River has undergone many diversions, drying events and flood discharges in the process of its for-mation and development, and it is well-known to the world for its “siltation and migration” (Huang et al., 2023). Ecological governance in the Yellow River Basin has always been an important part of China's sustainable ecological development. The siltation area refers to the sediment in the river channel, which is transported to the back side of the Yellow River embankment within a specified width through a pipeline and deposited by mechanical suction, all with the help of water flow. As the basic material for vegetation growth, the structural stability and sufficient fertility of soil are important prerequisites for vegetation growth and development (Xu et al., 2022). However, the soil formed by dredging of the Yellow River is faced with problems such as low organic matter content, uneven distribution of the nitrogen, phosphorus and potassium contents, and very few soil aggregates. The ecological and economic benefits of silt soil are of great concern to scholars (Xu and Jiang, 2021).
Soil quality is closely related to various soil indicators, and a greater number of general indicators can more accurately reflect soil quality. However, there is a certain degree of correlation between each index, which will cause redundancy in the analysis of data. To address this issue, scholars at home and abroad have identified a variety of efficient methods for evaluating soil quality, such as the soil quality index method (Doran and Jones, 1996), multivariate index Krieger method (Liu et al., 2006), soil quality model method (Larson and Pierce, 1994), and others, and the different soil quality evaluation methods have different advantages and disadvantages, such as the use of the gray correlation analysis method (Tang et al., 2016). The accuracy of soil quality evaluation with scattered evaluation index values will be skewed, and it is difficult to obtain data using the neural network method (Yang et al., 2008b) in model analysis. In addition, the threshold for use is high and the accuracy of evaluation will also cause bias, while the SQI method is still one of the most commonly used methods due to its simplicity of data acquisition and analysis operation (Mei et al., 2021). For the selection of evaluation indicators, indicators that are easy to obtain and have a great impact on local soil quality are generally selected (Ren et al., 2023), such as organic matter content, pH value, water-stable macroaggregate content, nitrogen, phosphorus and potassium element contents, conductivity, and others. Generally, each index is decentralized by principal component analysis, and then combined with Pearson correlation analysis (Cong et al., 2020) to construct a minimum data set (MDS). This method was first proposed by Larson and Pierce (1994), and many domestic scholars have used this method to evaluate the quality of soil in various regions of China. For example, Wang et al. (2023) evaluated the soil quality of alfalfa fields in semi-arid areas of the Loess Plateau in different planting years using a minimum dataset, and found that the long-term planting of alfalfa can increase soil organic carbon, total nitrogen, and soluble carbon content, but reduce soil moisture and available phosphorus content, thus promoting the sustainable use of regional artificial alfalfa grasslands. Based on an analysis of the utilization characteristics of sloping farmland in Yunnan, China, Chen et al. (2020) constructed a quality evaluation system for sloping farmland based on “elements demand regulation”. They explored the quality of red soil, purple soil, yellow soil, and yellow brown soil in sloping farmland in Yunnan and analyzed the spatial distribution characteristics of sloping farmland quality. Li et al. (2019) conducted a quality evaluation of reclaimed soil in the Loess Plateau mining area and found that vegetation restoration measures significantly improved the quality of reclaimed soil in the mining area. However, different vegetation restoration measures and their restoration effects vary, with natural vegetation having the best restoration effect, which was illustrated by changes in the quality of reclaimed soil in mining areas during the process of vegetation restoration (Li et al., 2019; Wang et al., 2021). Compared with the linear soil quality evaluation method, the nonlinear soil quality evaluation method was shown to have better applicability to soil quality evaluation in this region.
Due to the lack of silted soil quality evaluation in the lower back area of the Yellow River based on resource utilization, this study used 16 soil indexes to selected six soil indexes, such as bulk density, water-stable macro-aggregate content, and nitrogen, phosphorus and potassium nutrient contents, to construct a comprehensive evaluation system for soil quality based on the minimum data set (MDS). This MDS was then used to comprehensively evaluate the quality of silted soil in the lower reaches of the Yellow River, and explore the differences in soil quality indexes among three different use methods: natural leaching (bare land), afforestation land, and cultivated land. This study provides a reference for the selection of rational soil utilization methods in the siltation area of the lower reaches of the Yellow River.

2 Materials and methods

2.1 Overview of the study area

The study area is located in Gaoqing County, Shandong Province, in the alluvial plain of the lower reaches of the Yellow River, and it is connected to the leading edge of the alluvial plain in front of the mountain in the south. The siltation area of the Yellow River is mainly covered with fluvial soil, which is formed by the accumulation of sediment and siltation of the Yellow River, and the land use types were divided into bare land, forest land and cultivated land. The uses were classified according to the current “Classification of Land Use Status”. The characteristics of bare land include bare soil and a lack of green plants, which can include barren grassland, saline-alkali land, sandy land and other types. Afforestation land is mainly divided into four categories: barren mountain wasteland; farmland on the four sides of agricultural land and abandoned land; logging land; and burned land, partially regenerated land, secondary forest land and afforestation land under the canopy. The main representative types of cultivated land are paddy field, irrigated land and dry land. The average altitude is 12 m, and the continental monsoon climate zone of the north temperate zone is mostly affected by the westerly wind flow of the westerly belt. The climate change often occurs from west to east, the four seasons are distinct, the light energy resources are abundant, and the frost-free period is long, which is conducive to the planting of overwintering crops and summer-sown crops.
Gaoqing County belongs to the warm temperate continental monsoon climate zone, with an annual average temperature of 12.9 ℃, an average annual rainfall of 598.1 mm, an average evaporation of 1628.5 mm, a perennial dominant wind direction that is southwesterly, an annual average wind speed of 2.7 m s-1, and the water resources include surface water and groundwater. It is rainy in summer, dry in winter and spring, and dry in late autumn, with uneven precipitation, and drought and flood disasters often occur. The temperature is slowly rising, and the wind does not change much. There are two main soil types: fluvial soil and saline soil, and the vegetation distribution belongs to the warm temperate deciduous broad-leaved forest zone.

2.2 Sample collection and analysis

2.2.1 Sample collection

A total of 21 sample plots were selected in the proposed area. Five sample plots were selected according to the “S” type five-point sampling method (Ren, 1998) for sampling in each sample plot, with a sample size of 25 m×25 m. Three random points in the front, middle and back areas were selected in the quadrat to evenly take 0-40 cm soil from top to bottom, and 2.0 kg soil samples were taken by the four-point method after removing impurities such as roots and stones. Samples were respectively packed into sealed bags, numbered, and brought back to the laboratory to be air-dried and sieved for the determination of soil chemistry and mechanical composition. At the same time, 0-20 cm and 20-40 cm soil layer ring knives (100 cm3) were used at the same position to seal and shock, to measure the physical indicators such as soil bulk density, water content, and porosity. An undisturbed surface was selected at a location close to the soil sampling and ring knife sampling. The soil surface debris was removed, then the undisturbed soil was removed so that the original soil structure was not damaged. The soil was brought back to the laboratory for natural air drying and removal of 1 cm along the surface for the analysis of soil water-stable large aggregates.

2.2.2 Determination indexes and methods

(1) Soil physical indicators: The ring knife method was used to measure (Zhang et al., 2021) soil bulk density, saturated water content, field water content, porosity, and other parameters. Soil firmness was measured by a firmness meter. A Malvern 3000 laser particle size analyzer was used for soil mechanical composition. The “dry-wet” sieve method was used to measure the content of soil aggregates (Cao et al., 2011).
(2) Soil chemical indicators: The potassium dichromate method was used to measure organic matter. The pH value was measured by the potentiometric method (at a soil to water ratio of 2.5:1). Total nitrogen was measured by the Kjeldahl method, total phosphorus was measured by perchloric acid digestion, and total potassium was measured by the tri-acid digestion method. The alkali hydrolyzable diffusion method was used to measure the alkali hydrolyzable nitrogen, and the available potassium was measured by NH4OAc extraction-flame photometry. The 0.05 mol L-1 NaHCO3 method was used to measure available phosphorus (Yang et al., 2008a).

2.3 Soil quality evaluation methods

2.3.1 Minimum dataset construction

The construction of a minimum data set (MDS) by correlation analysis and principal component analysis (PCA) can avoid the redundant analysis caused by too much correlated data in the total data set (TDS), and the test accuracy is high (Zhou et al., 2022). The TDS was divided into a group of principal components with an eigenvalue of ≥1 and a load of ≥ 0.5 for each factor. After grouping, the largest Norm value and the Norm value greater than 90% of the group were selected for the next step, and then the indicators taken to the next step were compared based on relevance. The indicators with significant correlations were selected for the minimum data set, and the indicators with small correlations were directly entered into the minimum data set.
The formula for calculating the Norm value (Jiang, 2009) is:
${{N}_{iK}}=\sqrt{\underset{k=1}{\overset{K}{\mathop \sum }}\,\left( U_{ik}^{2}\times {{\lambda }_{k}} \right)}$
where NiK refers to the comprehensive load of the i-th index on the first K-th principal components with an eigenvalue ≥1; Uik is the load of the i-th index on the k-th principal component; and λk is the eigenvalue of the k-th principal component.

2.3.2 Standardization of indicators and calculation of weights

The various soil physicochemical properties will have either positive or negative effects on the soil quality of the Yellow River silt, and the dimensions of each index are different, so they need to be standardized (Song and Guo, 2023). The dimensionless value range of 0-1 is generally established by a nonlinear scoring equation (Feng et al., 2021) or membership calculation. According to the positive and negative effects of each index on soil quality, the membership function was divided into the Sigmoid function, the inverse Sigmoid function and the parabolic function. The Sigmoid function indicates that the soil quality increases with the improvement of the index, the inverse Sigmoid function is the opposite (Lou et al., 2019), and the parabolic function indicates that the soil quality increases with an increase in the index within a certain range, but the soil quality decreases after the index reaches a critical value. The formulas for calculating these three functions are:
Sigmoid function:
$U\left( x \right)=\left\{ \begin{matrix} 1\ \ \ \ \ \ \ \ \ \ \ \ \ \ \ \ \ \ x\ge b \\ \frac{x-a}{b-a}\ \ \ \ \ \ \ \ \ a<x<b \\ 0\ \ \ \ \ \ \ \ \ \ \ \ \ \ \ \ \ \ x\le a \\\end{matrix} \right.$
Inverse sigmoid function:
$U\left( x \right)=\left\{ \begin{matrix} 1\ \ \ \ \ \ \ \ \ \ \ \ \ \ \ \ \ \ \ x\le a \\ \frac{x-b}{a-b}\ \ \ \ \ \ \ \ \ a<x<b \\ 0\ \ \ \ \ \ \ \ \ \ \ \ \ \ \ \ \ \ x\ge b \\\end{matrix} \right.$
Parabolic function:
$U\left( x \right)=\left\{ \begin{array}{*{35}{l}} 1\ \ \ \ \ \ \ \ \ \ \ \ \ \ \ \ \ \ \ \ \ \ {{b}_{2}}\ge x\ge {{b}_{1}} \\ \frac{x-{{a}_{1}}}{{{b}_{1}}-{{a}_{1}}}\ \ \ \ \ \ \ \ \ \ \ \ \ \ \ {{a}_{1}}<x<{{b}_{1}}~~~~~~~~ \\ \frac{x-{{a}_{2}}}{{{b}_{2}}-{{a}_{2}}}\ \ \ {{a}_{2}}>~x>{{b}_{2}},x\le {{a}_{1}}\ \text{or}\ x\ge {{a}_{2}} \\\end{array} \right.$
where U(x) is the degree of membership; a and b are the lower and upper limits of the critical values of the indicators in the Sigmoid function and the inverse Sigmoid function, respectively, which are the minimum and maximum values of the measured values; a1 and a2 are the lower and upper limits of the critical values of the indicators in the parabolic function, respectively, which are the minimum sum of the measured values maximum; and b1 and b2 are the lower and upper bounds of the most suitable values in the parabolic function.
The weights were calculated as the ratio of the common factor variance to the sum of the variances of each index after principal component analysis.

2.3.3 Soil quality index

The soil quality index (SQI) is a description of the quality of the soil, and the higher the SQI, the higher the quality of the soil (Deng et al., 2016). In this study, 16 indexes affecting soil quality were selected for principal component analysis and correlation analysis. The SQI values of the total soil dataset (TDS) and the minimum dataset (MDS) in the siltation back area of the Yellow River were calculated, and the soil quality index values under different land use types were compared according to the TDS. The calculation formula is:
$SQI=\underset{i=1}{\overset{n}{\mathop \sum }}\,{{W}_{i}}{{N}_{i}}$
where SQI is the soil quality index; Wi is the score value of the i-th soil index; Ni is the weight of the i-th index in the principal component analysis, that is, the ratio of the variance of the common factor to the total variance; and n is the number of soil indexes included in soil quality evaluation.

2.3.4 Verifying the rationality of the minimum data set

In this study, a total of 16 indicators of the soil in three land use types (woodland, bare land and cultivated land) in the siltation area of the Yellow River in Gaoqing County, were used to calculate the soil quality index based on the TDS. Then the soil quality index calculation based on the MDS was constructed by principal component analysis combined with correlation analysis. Linear regression fitting between the TDS and MDS was carried out to explore the rationality of the MDS.

2.4 Data processing

In this study, Excel 2016 was used to organize and summarize the data, ArcMap 10.8 and Origin2021 were used to make the charts, and SPSS 26.0 was used to perform the principal component analysis (PCA) and Pearson correlation analysis.

3 Results and analysis

3.1 Soil physicochemical properties

In this study, the physical and chemical indexes of soil in the siltation area of the lower reaches of the Yellow River under different land use patterns were determined (Table 1). The coefficients of variation for the bulk density, capillary water holding capacity, capillary porosity, moisture content, and pH value under the condition of 0-40 cm soil were each ≤0.1, indicating they are insensitive indexes (Shi et al., 2020). The coefficients of variation for clay, soil firmness, maximum water holding capacity, total phosphorus and total potassium were in the range of 0.1≤CV≤0.5, indicating they are low-sensitivity indicators; while the coefficients of variation for water-stable aggregates, total organic carbon, alkali-hydrolyzable nitrogen, available phosphorus and available potassium were in the range of 0.5≤CV≤1, indicating they are moderately sensitive indexes.
Table 1 Physical and chemical properties of soil under different land use patterns
Indicator Mean Grand mean Total standard deviation Coefficient of
variation
Untreated land Forest land Cropland
Clay (%) 7.11 6.44 6.42 6.66 2.09 0.31
Soil penetration resistance (N) 207.18 192.85 217.23 205.76 50.13 0.24
Water stable aggregates (%) 2.78 12.74 12.97 9.50 5.03 0.53
Bulk density (g cm-3) 1.53 1.47 1.60 1.53 0.12 0.08
Maximum water holding capacity (%) 26.46 29.04 24.04 26.51 4.62 0.17
Capillary water capacity (%) 22.82 23.73 21.02 22.52 2.16 0.10
Capillary porosity (%) 34.79 34.67 33.45 34.30 1.27 0.04
Soil water content (%) 17.02 16.63 16.58 16.74 1.05 0.06
pH 8.66 8.73 8.93 8.77 0.27 0.03
Total organic carbon (%) 0.53 0.77 0.39 0.56 0.28 0.50
Total nitrogen (g kg-1) 0.35 0.45 0.27 0.36 0.21 0.59
Available nitrogen (mg kg-1) 17.46 39.46 3.52 20.15 17.36 0.86
Total phosphorus (g kg-1) 0.50 0.40 0.41 0.44 0.16 0.36
Available phosphorus (mg kg-1) 4.97 8.05 4.95 5.99 3.73 0.62
Total potassium (g kg-1) 37.92 27.60 25.31 30.28 11.70 0.39
Available potassium (mg kg-1) 119.89 150.88 168.96 146.58 80.87 0.55
According to the second national soil nutrient classification standard (National Soil Census Office, 1998), the overall soil total nitrogen content in the siltation area was 0.36 g kg-1, which is a very low level. The content of alkaline hydrolyzable nitrogen in soil was 20.15 mg kg-1, which is also a very low level. The total phosphorus content of silt soil was 0.44 g kg-1, which belongs to the intermediate level. The content of available phosphorus in silt soil was 5.99 mg kg-1, indicating a moderate level. The total potassium content of silt soil was 30.28 g kg-1, which is higher than the first-level standard of 25 g kg-1 in the soil nutrient grading standard, so the total potassium content of silt soil is extremely high. The available potassium content was 146.58 mg kg-1, which belongs to the middle and upper levels.
For soils of the different land use types, the clay contents in the mechanical composition of forest land and cultivated land were similar, while the clay content of bare land was the highest. The soil firmness and bulk density of forest land were lower than those of bare land and cultivated land. The content of water-stable aggregates in bare land was much lower than that in forest land (21.82%) and cultivated land (21.43%). The maximum water holding capacity and capillary water holding capacity of forest land were higher than those of bare land and cultivated land. In terms of chemical properties, the total nitrogen contents of bare land, forest land and cultivated land in the silt back area were less than 0.5 g kg-1, which indicates very low levels. The alkali hydrolyzable nitrogen contents of bare land and cultivated land were at very low levels, while that of forest land was 39.46 mg kg-1, indicating a low level. The total phosphorus contents of bare land, forest land and cultivated land ranged from 0.4-0.6 g kg-1, which belongs to the intermediate level. The content of available phosphorus in forest land was 8.55 mg kg-1, which indicates a moderate level. The contents of available phosphorus in bare land and cultivated land were low. The total potassium contents of bare land, forest land and cultivated land were higher than 25 g kg-1, which belong to the extremely high level of nutrient content. The available potassium content of cultivated land was 168.96 mg kg-1, which is at the middle and upper nutrient level, and the available potassium contents of forest soil and cultivated soil were higher than 150 mg kg-1, indicating advanced levels.

3.2 Minimum dataset metric filtering

Through the principal component analysis of 16 soil indicators, a total of five principal components with eigenvalues greater than 1 were obtained (Table 2), and their cumulative contribution rate reached 83.601%. Therefore, they could replace the soil physical and chemical indexes in the full silt back area, and the minimum dataset was constructed based on the correlation analysis results in Table 3. The soil quality evaluation index of the absolute value of the rotation factor load for each principal component (PC) ≥0.5 was screened out, and PC1 included nine factors: clay particles, firmness, bulk density, maximum water holding capacity, capillary water holding capacity, capillary porosity, water content, total organic carbon content, total nitrogen, and alkali hydrolyzable nitrogen. The absolute loading values of clay particles in PC1 and PC5 were 0.573 and 0.572, both of which were greater than 0.5. However, there was a significant correlation between clay particles and bulk density, maximum water holding capacity and capillary water holding capacity in the group, so the clay particles were placed into group 5. The absolute loading values of water holding capacity in PC1 and PC3 were 0.576 and 0.525, both of which were greater than 0.5. However, the water content was significantly correlated with the weight of the group, the maximum water holding capacity and the capillary water holding capacity, which were placed into group 3. The absolute loading values of alkali hydrolyzable nitrogen in PC1 and PC5 were 0.723 and 0.632, both of which were greater than 0.5. However, alkali hydrolyzable nitrogen had significant correlations with total nitrogen and organic matter in PC1, so it was placed into group 5. The evaluation indexes of soil quality placed into the first group were firmness, bulk density, maximum soil water holding capacity, soil capillary water holding capacity, soil capillary porosity, total organic carbon content, and total nitrogen. Main component 2 had total phosphorus, available phosphorus and total potassium, and the absolute loading values of total potassium in PC2 and PC3 were 0.73 and 0.518, both of which were greater than 0.5. However, total potassium had a strong correlation with available phosphorus in the group, so it was placed into group 3, and the two soil quality evaluation indexes of group 2 were total phosphorus and available phosphorus. PC3 contained water content, pH, and total potassium, and according to the results of PC1 and PC2, these three were included in group 3. PC4 with water-stable macroaggregate content and available potassium was placed into group 4, and PC5 with clay particles and alkali hydrolyzable nitrogen was placed into group 5.
Table 2 Principal component analysis of soil quality indexes in the silt back area of the Yellow River
Soil indicator Group Principal component Norm value
PC1 PC2 PC3 PC4 PC5
Clay (%) 5 -0.573 0.128 0.175 -0.242 0.572 1.59
Soil penetration resistance (N) 1 -0.642 -0.385 0.325 -0.260 0.167 1.80
Water stable aggregates (%) 4 0.182 -0.424 -0.111 0.784 0.059 1.31
Bulk density (g cm-3) 1 -0.933 0.153 0.220 0.069 0.061 2.33
Maximum water holding capacity (%) 1 0.931 -0.173 -0.152 -0.093 0.002 2.32
Capillary water capacity (%) 1 0.976 0.031 -0.035 -0.167 -0.037 2.41
Capillary porosity (%) 1 0.509 0.498 0.370 -0.257 -0.021 1.61
Soil water content (%) 3 0.576 -0.046 0.525 -0.139 -0.305 1.64
pH 3 0.124 -0.337 0.734 0.329 -0.129 1.29
Total organic carbon (%) 1 0.875 -0.045 -0.156 0.004 -0.065 2.17
Total nitrogen (g kg-1) 1 0.784 -0.215 0.301 -0.077 0.318 2.03
Available nitrogen (mg kg-1) 5 0.723 -0.106 -0.074 -0.120 0.632 1.91
Total phosphorus (g kg-1) 2 -0.004 0.786 -0.188 -0.113 -0.177 1.31
Available phosphorus (mg kg-1) 2 0.159 0.638 -0.460 0.435 0.204 1.41
Total potassium (g kg-1) 3 0.147 0.73 0.518 -0.040 0.045 1.43
Available potassium (mg kg-1) 4 0.170 0.419 0.470 0.680 0.167 1.37
Eigenvalue 6.048 2.555 2.028 1.663 1.081
Variance contribution rate (%) 37.801 15.969 12.676 10.396 6.759
Cumulative contribution rate (%) 37.801 53.770 66.446 76.842 83.601
Table 3 Correlation analysis of soil quality indexes in the Yellow River silt back area
Indicator Clay SPR WSA BD MWHC CWC CP SWC pH TOC TN AN TP AP TK AK
Clay 1
SPR 0.421 1
WSA -0.281 -0.128 1
BD 0.594** 0.637** -0.157 1
MWHC -0.517* -0.583** 0.152 -0.969** 1
CWC -0.524* -0.617** 0.048 -0.933** 0.939** 1
CP -0.132 -0.273 -0.223 -0.244 0.308 0.572** 1
SWC -0.289 -0.167 -0.028 -0.461* 0.447* 0.552** 0.416 1
pH -0.062 0.171 0.359 0.014 0.071 0.068 0.166 0.337 1
TOC -0.527* -0.531* 0.241 -0.810** 0.799** 0.836** 0.395 0.527* 0.031 1
TN -0.286 -0.291 0.128 -0.700** 0.731** 0.742** 0.379 0.452* 0.310 0.524* 1
AN -0.118 -0.248 0.148 -0.654** 0.684** 0.700** 0.363 0.181 -0.047 0.627** 0.756** 1
TP 0.033 -0.320 -0.307 0.073 -0.071 0.093 0.481* -0.219 -0.236 -0.051 -0.208 -0.164 1
AP -0.062 -0.477* 0.168 -0.098 0.052 0.099 0.088 -0.169 -0.437* 0.259 -0.19 0.168 0.439* 1
TK 0.086 -0.178 -0.427 0.054 -0.074 0.118 0.478* 0.392 0.017 0.048 0.116 0.022 0.32 0.269 1
AK -0.089 -0.304 0.256 0.036 -0.022 0.041 0.224 0.143 0.375 -0.028 0.226 0.054 0.076 0.373 0.578** 1

Note: * and ** indicate that the correlations are significant at the 0.05 and 0.01 levels (two-tailed), respectively. SPR: Soil penetration resistance; WSA: Water stable aggregates; BD: Bulk density; MWHC: Maximum water holding capacity; CWC: Capillary water capacity; CP: Capillary porosity; SWC: Soil water content; TOC: Total organic carbon; TN: Total nitrogen; AN: Available nitrogen; TP: Total phosphorus; AP: Available phosphorus; TK: Total potassium; AK: Available potassium.

After the group division was completed, in order to avoid the problem of high correlations among the indicators in each group, the indicators within 90% of the maximum norm value and the maximum norm value in the group and the correlation coefficients between the indicators were used as the criteria for judging the final entry into the MDS. The sensitivity of capillary water holding capacity of 10% indicates it is a low sensitivity index. However, this group contains two important soil indexes (bulk density and maximum water holding capacity) that have a greater ability to reflect soil quality, and have a strong correlation between them, so the capillary water holding capacity was included in the MDS. In group 2, the index that met the maximum norm value and the maximum norm value within 90% was available phosphorus, so it was included in the MDS. The index within 90% of the maximum norm value and the maximum norm value in group 3 was the water content, so it was included the MDS as the only indicator that met the norm. The indexes in group 4 were water-stable large aggregate content and available potassium, and the correlation between them was 0.256, so they were entered into the MDS. Group 5 only included the index of alkali hydrolyzable nitrogen, which was included in the MDS. Ultimately, the MDS included six soil quality evaluation indexes: capillary water holding capacity, available phosphorus, water content, water-stable macroaggregate content, available potassium and alkaline hydrolyzable nitrogen.

3.3 Verifying the rationality of the soil quality index and minimum data set

After the MDS index screening was completed, the soil quality index of the 16 soil indexes (TDS) and the MDS of the soil in the silt back area were calculated according to the variances and weights of the common factors, as shown in Table 4. The results showed that the soil quality index for the 16 indexes (SQI-TDS) was 0.175-0.783 and the average value was 0.421, while the MDS soil quality index (SQI-MDS) was 0.177-0.660 with an average value of 0.414. In this study, referring to the soil quality index grading standard by Ma et al. (2018), every 0.2 grade was divided into five grades of I-V, among which I soil quality is the highest and V soil quality is the lowest. The soil quality index of the silted soil in the silted back area of the Yellow River was 0.414, which belongs to grade III, indicating a low level of soil quality.
Table 4 Common factor variances and weights of the soil quality evaluation indexes
Soil indicator Total data set Minimum data set
Common factor variance Weight Common factor variance Weight
Clay (%) 0.760 0.057
Soil penetration resistance (N) 0.761 0.057
Water stable aggregates (%) 0.844 0.063 0.844 0.159
Bulk density (g cm-3) 0.951 0.071
Maximum water holding capacity (%) 0.929 0.069
Capillary water capacity (%) 0.984 0.074 0.984 0.186
Capillary porosity (%) 0.709 0.053
Soil water content (%) 0.722 0.054 0.722 0.136
pH 0.793 0.059
Total organic carbon (%) 0.797 0.060
Total nitrogen (g kg-1) 0.858 0.064
Available nitrogen (mg kg-1) 0.953 0.071 0.953 0.180
Total phosphorus (g kg-1) 0.698 0.052
Available phosphorus (mg kg-1) 0.874 0.065 0.874 0.165
Total potassium (g kg-1) 0.826 0.062
Available potassium (mg kg-1) 0.916 0.068 0.916 0.173
In order to verify whether the soil quality evaluation based on the MDS is applicable, the linear fitting of the two is shown in Figure 1. The results show that the SQI-TDS and SQI-MDS show a significant positive correlation, so the comprehensive evaluation system of soil quality in the siltation area based on the minimum dataset can effectively reflect the evaluation results of the full dataset.
Figure 1 Correlation of soil quality indexes

Note: SQI-MDS is the soil quality index based on the minimum data set, and SQI-TDS is the soil quality index based on the total data set.

3.4 Comprehensive evaluation of the soil quality of different land use types

The soil quality index of the smallest dataset (SQI-MDS) for the three different land use types in the silted back area of the Yellow River is shown in Figure 2. Note that the soil quality index of bare land is in the range of 0.175-0.503, with an average value of 0.321, indicating grade IV soil; the soil quality index of forest land is in the range of 0.239- 0.782, and the average value is 0.581, indicating grade III soil; and the soil quality index of cultivated land is in the range of 0.216-0.574, with an average value of 0.360, indicating grade IV soil. The soil quality index of forest land was 180% and 161.39% of the bare land and cultivated land values, respectively. Except for sampling point 5, the soil quality of forest land was better than those of bare land and cultivated land, while the soil quality of cultivated land at sampling points 6 and 7 was lower than that of bare land, and the soil quality values of other sampling points were higher than those of bare land.
Figure 2 Soil quality index values of different land use types and sampling sites

4 Discussion

At present, the use of land in the silt back area is in a stage of giving full play to the ecological benefits such as flood control and wind resistance. The scenic shelter forest composed of acacia, poplar and willow is mostly used in the construction of a corridor on both sides of the Yellow River, where the tree species is relatively singular. In addition, when the construction unit carries out the soil improvement of the afforestation land, the improvement plan of the silted soil is relatively basic, and there is a problem of fewer fertilizer types and application rates, and the improvement measures are single, and it is easy to have the phenomenon of slow growth or even stiff seedlings of shelter forest trees. Therefore, when evaluating soil quality in the soil siltation area, the selection of indicators should be fully considered.
In this study, 16 soil physical and chemical indexes were considered for comprehensively evaluating the quality of soil in the siltation area of the lower reaches of the Yellow River. For selecting the physical property evaluation indexes, the mechanical composition of soil determines soil texture, and the permeability and fertilizer retention of different textures are quite different (Yuan et al., 2023). Aggregates play an important role in improving soil porosity, water-holding capacity, soil fertility, and vegetation growth due to the irregular structure generated by their unifying soil particles (Zhao et al., 2017). Soil bulk density, maximum water holding capacity, capillary water holding capacity, capillary porosity, and water content are important components of soil physical properties, which affect plant root growth, water transport, and air permeability, and play a key role in plant growth (Yang et al., 2022). Regarding soil chemical properties, components such as the total organic carbon, nitrogen, phosphorus, and potassium and their available amounts provide the nutrients required for plant growth and development, and soil chemical properties have strong interactions with plant growth and development (Lin et al., 2019).
There are many methods for soil quality assessment. Each method has its own advantages and disadvantages, and the advantage of using principal component analysis to construct a minimum dataset is that it can reduce data redundancy and human factors (Cui et al., 2022). The overall soil quality in the siltation area of the lower reaches of the Yellow River is at a moderately low level. There are problems such as high soil bulk density and low porosity, which may be caused by the silt soil coming from the sediment of the Yellow River and the large proportion of clay particles in the mechanical composition of the soil. The soil pH value was 8.77, indicating alkaline soil, which may result from the return of salt from the Yellow River. The soil nitrogen and phosphorus were at the middle and lower levels, but the potassium content was high, and the nutrients were extremely unbalanced, especially nitrogen. This was consistent with previous research results on the sediment siltation soil in the middle and lower reaches of the Yellow River (Chen et al., 2022).
Under the three different land use modes of bare land, forest land and cultivated land, the clay contents in the mechanical composition of the soil of forest land and cultivated land were lower than that of bare land, indicating that the planting of plants had a certain promotional effect on the mechanical composition of the soil. The soil quality index of forest land was 0.581, which was higher than those of bare land (0.321) and cultivated land (0.360). This is because forest land produces more litter, and after falling to the surface, the litter produces organic matter and other nutrients through microbial action. Because of this source of foreign nutrients for the soil, the soil quality of forest land was the best. The differential performance of soil quality under the three different land use modes can provide a theoretical reference for the management policies and utilization modes of silt back soil.

5 Conclusions

In this study, a soil quality evaluation system based on the minimum dataset in the siltation area of the middle and lower reaches of the Yellow River was constructed by principal component analysis and correlation analysis, and the physical and chemical properties of the soil under different land use modes were comprehensively evaluated. Three main conclusions were drawn.
(1) The overall level of soil quality in the siltation area of the Yellow River in Gaoqing County, Shandong Province was low, and the degrees of change in the chemical properties of soil were higher than those of the physical properties among the different soil sampling points. The contents of total organic carbon, total nitrogen and alkaline hydrolyzable nitrogen were all very low, the contents of total phosphorus and available phosphorus were at intermediate levels, the total potassium content was at a very high level, and the available potassium content was at a high level.
(2) The six soil quality evaluation indexes of the minimum dataset in the siltation area of the Yellow River were capillary water holding capacity, available phosphorus, water content, water-stable large aggregates, available potassium and alkali hydrolyzable nitrogen. The soil quality index values of the total soil index and the minimum dataset index were 0.421 and 0.414, respectively, indicating that the MDS can evaluate the soil quality in the silted back area of the Yellow River to a certain extent.
(3) The comprehensive evaluation of soil quality based on the minimum data set clarified that the soil qualities under different land use types were in the sequence of forest land (0.581) > cultivated land (0.360) > bare land (0.321). Thus, forest land had the best effect on soil improvement in the siltation area of the lower reaches of the Yellow River.
[1]
Cao L H, Liu H M, Zhao S W. 2011. Effect of soil conditioners on water stability of soil aggregates and its mechanisms in loessal soil. Science of Soil and Water Conservation, 9(5): 37-41. (in Chinese)

[2]
Chen Z J, Xiao Y T, Dong X D, et al. 2022. Effects of sediment deposition on soil stoichiometric ratios in the middle and lower reaches of the Yellow River. Chinese Journal of Ecology, 41(7): 1334-1345. (in Chinese)

DOI

[3]
Chen Z, Shi D, He W, et al. 2020. Quality evaluation of slope farmland in Yunnan Province based on “Element-Demand-Regulation” framework. Transactions of the Chinese Society of Agricultural Engineering, 36(12): 236-246. (in Chinese)

[4]
Cong P, Wang J, Li Y, et al. 2020. Changes in soil organic carbon and microbial community under varying straw incorporation strategies. Soil and Tillage Research, 204: 1-16.

[5]
Cui X, Wang H Y, Zou J H, et al. 2022. Soil quality assessment of natural coniferous and broad-leaved mixed forest under different cutting intensities using minimum data set. Journal of Northeast Forestry University, 50(5): 88-94. (in Chinese)

[6]
Deng S, Zeng L, Guan Q, et al. 2016. Minimum dataset-based soil quality assessment of waterlogged paddy field in South China. Acta Pedologica Sinica, 53(5): 1326-1333. (in Chinese)

[7]
Doran J W, Jones A J. 1996. Methods for assessing soil quality. Madison, USA: SSSA Special Publications.

[8]
Feng R Q, Pan P, Ouyang X Z, et al. 2021. Soil quality evaluation of Minnan natural secondary forest based on minimum data set. Acta Agriculturae Universitatis Jiangxiensis, 43(3): 585-597. (in Chinese)

[9]
Huang L, Chen S, Li P, et al. 2023. Spatiotemporal distribution of suspended sediment in the tail channel of the Huanghe River Delta from 2016 to 2020. Marine Science Bulletin, 42(3): 303-313. (in Chinese)

[10]
Jiang D S. 2009. Study on the evolution law and influencing factors of cultivated land fertility quality in hilly region of red soil. Diss., Changsha, China: Hunan Agricultural University. (in Chinese)

[11]
Larson W E, Pierce F J. 1994. The dynamics of soil quality as a measure of sustainable management. Defining Soil Quality for a Sustainable Environment, 35: 37-51.

[12]
Li P F, Zhang X C, Hao M D, et al. 2019. Soil quality evaluation for reclamation of mining area on Loess Plateau based on minimum data set. Transactions of the Chinese Society of Agricultural Engineering, 35(16): 265-273. (in Chinese)

[13]
Lin W, Cai J, Xue L. 2019. Short-term interactive effects of nitrogen and phosphorus additions and different planting densities on soil chemical properties of Cinnamomum camphora seedlings. Acta Ecologica Sinica, 39(24): 9162-9170. (in Chinese)

[14]
Liu Z, Fu B, Liu G, et al. 2006. Soil quality: Concept, indicators and its assessment. Acta Ecologica Sinica, 26(3): 901-913. (in Chinese)

[15]
Lou Y, Shi D, Jiang G, et al. 2019. Evaluation of soil quality in the cultivated-layer of sloping farmland in purple hilly area based on minimum data set. Science of Soil and Water Conservation, 17(5): 75-85. (in Chinese)

[16]
Ma Q H, Zhang G H, Geng R, et al. 2018. Evaluation on soil quality of different land use types in Zhifanggou Watershed of the Loess Plateau. Research of Soil and Water Conservation, 25(4): 30-35. (in Chinese)

[17]
Mei N, Gu Y, Li D, et al. 2021. Soil quality evaluation in topsoil layer of black soil in Jilin Province based on minimum data set. Transactions of the Chinese Society of Agricultural Engineering, 37(12): 91-98. (in Chinese)

[18]
National Soil Census Office. 1998. Soil in China. Beijing, China: China Agriculture Press. (in Chinese)

[19]
Ren J Z. 1998. Scientific research methods of prataculture. Beijing, China: China Agriculture Press. (in Chinese)

[20]
Ren X, Wang L, Xu X, et al. 2023. Evaluation on soil quality changes due to land from hill cutting in Beishan Mountain in Lanzhou City. Bulletin of Soil and Water Conservation, 43(4): 61-67, 82. (in Chinese)

[21]
Shi D, Jiang N, Jiang G, et al. 2020. Influencing factors and sensitivity analysis of cultivated-layer quality of purple soil slope farmland. Transactions of the Chinese Society of Agricultural Engineering, 36(3): 135-143. (in Chinese)

[22]
Song H, Guo W. 2023. Comprehensive evaluation of soil quality in Jianghuai hilly area based on minimum data set. Agriculture and Technology, 43(12): 93-98.

[23]
Tang B Z, He B H, Yan J M. 2016. Gray correlation analysis of the impact of land use type on soil physical and chemical properties in the hilly area of central Sichuan, China. Chinese Journal of Applied Ecology, 27(5): 1445-1452. (in Chinese)

[24]
Wang C S, Wu X W, Du Y Y. 2021. Discussion on the development model of silt back area in the east section of the Yellow River. Shandong Water Resources, (3): 24-25. (in Chinese)

[25]
Wang S, Luo Z, Niu Y, et al. 2023. Soil quality evaluation of alfalfa fields in semi-arid areas of the Loess Plateau based on minimum data set. Chinese Journal of Grassland, 45: 81-90. (in Chinese)

[26]
Xu H, Lyu Q, Yang Y H, et al. 2022. Evaluation of slope re-vegetation effect: Research progress and prospect. Chinese Journal of Ecology, 41(3): 589-596. (in Chinese)

DOI

[27]
Xu P, Jiang H. 2021. Problems and countermeasures in the management of the Yellow River silt back area. Shandong Water Resources, (6): 20-21.. (in Chinese)

[28]
Yang J, Wang C, Dai H. 2008a. Soil agrochemical analysis and environmental monitoring. Beijing, China: China Land Press. (in Chinese)

[29]
Yang X T, Fan J, Ge J M, et al. 2022. Soil physical and chemical properties and vegetation characteristics of different types of grassland in Qilian Mountains, China. Chinese Journal of Applied Ecology, 33(4): 878-886. (in Chinese)

[30]
Yang X Y, Fu Q, Wang B H, et al. 2008b. Construction and application of fuzzy neural network model in evaluation on the soil quality changes of Sanjiang Plain. Research of Soil and Water Conservation, 15(3): 54-57. (in Chinese)

[31]
Yuan Q, Lu W, Wang J, et al. 2023. Effects of irrigation strategies of accumulated solar radiation on cucumber growth under different soil textures in the solar greenhouse. Transactions of the Chinese Society of Agricultural Engineering, 39(11): 98-105. (in Chinese)

[32]
Zhang Z, Ai N, Liu G, et al. 2021. Soil quality evaluation of various microtopography types at different restoration modes in the loess area of Northern Shaanxi. CATENA, 207: 1-13.

[33]
Zhao J, Chen S, Hu R, et al. 2017. Aggregate stability and size distribution of red soils under different land uses integrally regulated by soil organic matter, and iron and aluminum oxides. Soil and Tillage Research, 167: 73-79.

[34]
Zhou W, Lan T, Pan Y, et al. 2022. Construction of minimum data set with small number of samples for soil quality assessment: A case study of a typical land in the south bank of Yellow River irrigation area of Hangjin Banner, Inner Mongolia. Journal of China Agricultural University, 27(6): 225-235. (in Chinese)

Outlines

/