Ecosystem Assessment and Ecological Security

Study on the Spatial Coordination Relationship between High Quality Development and Ecological Environmental Protection in the Yellow River Basin under the Perspective of Ecosystem Service Value

  • LI Enze , 1 ,
  • XU Minghao 2 ,
  • TANG Yuanxiu , 3, 4, *
Expand
  • 1. School of Statistics and Mathematics (Research Center for Statistics and Interdisciplinary Sciences), Shandong University of Finance and Economics, Jinan 250014, China
  • 2. School of Economics and Management, Henan Polytechnic, Zhengzhou, 450046, China
  • 3. School of Statistics and Mathematics, Zhejiang Gongshang University, Hangzhou 310018, China
  • 4. School of Big Data Statistics, Guizhou University of Finance and Economics, Guiyang 550025, China
* TANG Yuanxiu, E-mail:

LI Enze, Email:

Received date: 2024-01-22

  Accepted date: 2024-10-20

  Online published: 2025-10-14

Supported by

The Commerce Statistical Society of China 2024 Annual Planning Project(2024STY75)

The Research Project of Higher Education Institutions in Guizhou Province for the Year 2023 (Youth Project)([2022]164)

The 2024 Annual Henan Province Federation of Social Sciences Circles Research Project(SKL-2024-1765)

Abstract

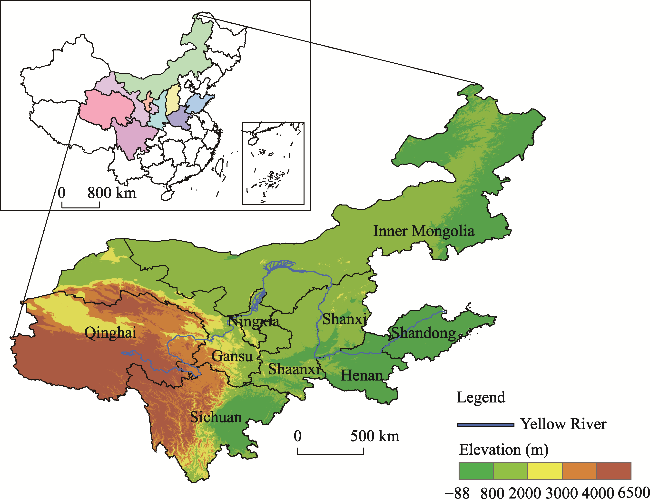
This study employs the coupled coordination gravity model to explore the spatial relationship between high-quality development and ecological environmental protection in the Yellow River Basin, using ecosystem service value (ESV) as a key perspective. The research begins by introducing the ecological and developmental context of the Yellow River Basin alongside relevant theoretical foundations. Subsequently, data from nine provinces in the Yellow River Basin from 2011 to 2022 are analyzed. ESV are calculated using established methodologies, and an index system for high-quality development is constructed and evaluated. The coupled coordination gravity model is then applied to analyze the data. The results indicate that the value of ecosystem services in the basin has fluctuated upward over the study period. Spatial development in high-quality development indices is evident across provinces, with Shaanxi and Ningxia achieving the highest levels of coupling and coordination, while Inner Mongolia exhibits relatively lower levels. Based on these findings, policy recommendations include continuing ecological restoration projects, enhancing policy support for central and western regions, fostering synergies between ecological and economic development, and promoting deeper regional cooperation.

Cite this article

LI Enze , XU Minghao , TANG Yuanxiu . Study on the Spatial Coordination Relationship between High Quality Development and Ecological Environmental Protection in the Yellow River Basin under the Perspective of Ecosystem Service Value[J]. Journal of Resources and Ecology, 2025 , 16(5) : 1366 -1376 . DOI: 10.5814/j.issn.1674-764x.2025.05.010

1 Introduction

The Outline of the Plan for Ecological Protection and High-Quality Development of the Yellow River Basin underscores the significance of the basin. Spanning four major geomorphological units and three terraces, the Yellow River Basin features natural ecological corridors, key ecological function zones, a robust agricultural and animal husbandry foundation, abundant energy resources, and a rich cultural foundation. However, the region faces significant challenges, including a fragile ecological environment, acute water shortages, severe soil erosion, weak resource and environmental carrying capacity, reliance on low-quality and inefficient industries, and a pronounced gap in high-quality development. Geographical conditions and other constraints exacerbate these challenges, as the economic ties among provinces and regions along the Yellow River Basin remain limited. The regional division of labor and collaboration is weak, the mechanisms for efficient and coordinated development are underdeveloped, and the modernization of the governance system and capacity is insufficient. Consequently, protecting the ecological environment of the Yellow River Basin, promoting high-quality economic development, protecting and promoting the Yellow River culture, and strengthening the synergistic cooperation of the whole basin have far-reaching historical and strategic significance.
Scholars have long examined the relationship between economic development and ecological environmental protection. The environmental Kuznets curve hypothesis and the green Solow model suggest a coupling between ecological, environmental protection, and economic growth. As China's economy transitioned to a stage of high-quality development, domestic researchers have increasingly focused on exploring the coupling and coordination between these dimensions within the Yellow River Basin. Most existing studies evaluate ecological, environmental protection, and high-quality development by constructing separate index systems. These indices are then integrated into a coupling coordination model to derive relevant insights. However, traditional index systems fail to capture the regional ecological environment adequately. Some scholars have employed ecosystem service value (ESV) derived from remote sensing data to address this limitation. This approach provides a more intuitive representation of the ecological environment and clarifies the mechanisms underlying ecosystem service formation and assessment outcomes (Guo et al., 2023).
The value of ecosystem services encompasses the life- supporting products and services obtained directly or indirectly through ecosystem structures, processes, and functions. These services are categorized into four primary types: provisioning, regulating, cultural, and supporting services. The sustainable provision of these services forms the foundation for sustainable economic and social development. Currently, scholars worldwide are conducting research on the measurement of ESV from multiple perspectives. Costanza et al. (1997) established the equivalent factor method for quantifying ESV globally. This method summarized and classified ecosystem service functions into 17 categories and estimated the ecological value of each function (Costanza et al., 2014). While the equivalence factor table enables the calculation of ecological value per unit area for different ecosystems, practical applications in developing countries have revealed inconsistencies between these estimates and actual conditions. Furthermore, regional variations in ecological value estimation introduce biases. To address these limitations, Xie et al. (2015) synthesized findings from over 200 ecologists in China and classified ecosystem services into 4 categories and 11 subcategories. This systematically sorted out and improved the ecological value equivalent factor table, resulting in the development of “China Ecosystem Service Equivalent Factor Table”, offering a simplified, intuitive, and data-efficient estimation method for estimating ESV. It has since been widely applied in ecosystem service valuation studies. For instance, Cao et al. (2021) analyzed the ESV in the Yangtze River Basin, comparing them to those of other basins, laying the groundwork for spatial planning and high-quality development in key river basins across China. Similarly, Raihan et al. (2023) utilized a geographically weighted regression model to assess the temporal and spatial dynamics of aquatic ecosystem services in the Loess Plateau from 2010 to 2020. Using land cover data from three distinct periods, Wei et al. (2024) examined the spatial and temporal evolution of ESV and gradient effects in Yangtze River.
Despite these advancements, limited research has been conducted on measuring ESV in the Yellow River Basin. Moreover, there is a lack of research on the spatial coordination between ecological, environmental protection, and regional high-quality development from the perspective of ESV (Zhao et al., 2017; Sun et al., 2024). ESV represents a measure of ecological capital, serving as an additional input factor alongside traditional production factors such as physical and human capital. It constrains ecological-economic activities and underpins regional high-quality development. At the same time, ESV serves as an output, influencing production efficiency. Its integration into green development accounting provides a monetized framework for ecological protection in the Yellow River Basin. Recognizing that ecological protection safeguards natural value and enhances natural capital underscores its role as a backbone of economic and social development. It can make the green hills and mountains continue to play an ecological, economic, and social role and help the regional high-quality development (Tang et al., 2024; Yao et al., 2024). This study takes the ESV of nine provinces in the Yellow River Basin from 2011 to 2022 as its foundation and research focus. It measures the ESV of the Yellow River Basin and carries out a systematic and comprehensive analysis of its spatial distribution, as well as temporal and spatial evaluation characteristics. Furthermore, it explores the spatial coordination between ecological, environmental protection, and high-quality regional development. By quantifying the ESV in the Yellow River Basin, this research highlights the important contribution of ecological resources to regional development. Additionally, it provides a scientific basis for formulating ecological protection policies, establishing ecological compensation mechanisms, optimizing resource allocation, promoting coordinated regional development, and strengthening the scientific foundation of policy formulation. This supports a win-win scenario for high-quality development and ecological environmental protection in the Yellow River Basin.

2 Study area, data sources, and research methodology

2.1 Research area

The Yellow River Basin encompasses the geographical region through which the Yellow River Basin flows from its source to the sea, located between 96°E and 119°E longitude and 32°N and 42°N latitude. It primarily includes nine provinces: Qinghai, Sichuan, Gansu, Ningxia, Inner Mongolia, Shaanxi, Shanxi, Henan, and Shandong. The basin spans four major geomorphic units from west to east: the Tibetan Plateau, the Inner Mongolia Plateau, the Loess Plateau, and the Yellow-Huaihai Plain (Figure 1). This region holds significant political, economic, and ecological importance for China. It ranks first in the country regarding forests and grasslands and the extent of water surfaces, wetlands, deserts, and sandy, serving as a vital ecological security barrier. Additionally, it is a key area for human activity and economic development. However, the basin faces challenges from global climate change and urban development pressures, leading to frequent and severe regional disasters. The ecosystem has become increasingly unstable and imbalanced. Compared with the 1980s, the Heyuan District has experienced a 52% reduction in the area of permanent glaciers and snow, a 20% decline in wetlands, and a 5.5% decrease in grasslands. These changes have significantly undermined the natural foundation required for high-quality development. Economic and social challenges further exacerbate the fragile ecological environment of the region, as certain provinces struggle to balance ecological protection with consolidating achievements in high-quality development.
Figure 1 Geographical location of the Yellow River Basin

2.2 Data source

The land use data in this study is derived from the CLDC dataset, which features 30 m resolution land cover data published by Yang and Huang (2024). Based on the Google Earth Engine platform and Landsat series satellite imagery, this dataset achieves an overall classification accuracy of 79.31%. Grain yield and sown area data, essential for calculating ESV, were obtained from the National Compendium of Agricultural Product Yield Data. Additionally, all indicators used in the high-quality development indicator system were obtained from the China Statistical Yearbook and the statistical yearbooks of individual provinces and cities.

2.3 Research methodology

2.3.1 Accounting for the value of ecosystem services

This study follows the delineation of land use types in the central and western regions proposed by Wei et al. (2022). It adapts to the specific context of the study area. Woodland, scrub, water, ice, desert, and bare ground ecosystems were aligned accordingly. These land types were excluded from the analysis if their ESV was zero, as seen in the case of construction land. Drawing upon the newly revised table of ecological service value equivalent factors per unit area for Chinese ecosystems and considering the unique characteristics of each service type in the Yellow River Basin, the equivalent value of secondary ecosystem services was averaged by type. The values were then merged and corrected to determine the equivalent factor for each ecological type, as shown in Table 1.
Table 1 Ecosystem service equivalent value per unit area in the Yellow River Basin
Ecosystem
classification
Supply service Regulation service Support service Cultural service
Food
production
Production
of material
Gas
conditioning
Climate
regulation
Hydrologic
condition
Soil
conservation
Maintain nutrient cycle Bio-
diversity
Aesthetic
landscape
Farmlands 1.11 0.25 0.89 0.47 0.19 0.52 0.16 0.17 0.08
Forests 0.25 0.58 1.91 5.71 4.04 2.32 0.18 2.12 0.93
Grasslands 0.23 0.34 1.21 3.19 2.53 1.47 0.11 1.00 0.59
Waters 0.40 0.12 0.48 1.42 59.91 0.47 0.04 1.28 0.99
Wetlands 0.51 0.50 1.90 3.60 26.82 2.31 0.18 7.87 4.73
Deserts 0.01 0.02 0.07 0.05 0.13 0.08 0.01 0.07 0.03
This study calculates the economic value of grain production per unit area in the Yellow River Basin to facilitate comparative analysis across each study period and account for fluctuations in grain prices over time. The rule applied is that the economic value of an ecosystem service equivalent factor is equal to one-seventh of the average grain yield market value for the year. The calculation formula is as follows:
${{E}_{a}}=\frac{1}{7}\underset{i=1}{\overset{4}{\mathop \sum }}\,\frac{{{m}_{i}}\times {{p}_{i}}\times {{q}_{i}}}{M}$
In the Formula (1), Ea represents the economic value of per-unit-area grain yield in the Yellow River Basin (104 yuan km-2); i denotes the crop type, with a focus on rice, wheat, corn, and potatoes, which are the primary crops planted in the Yellow River Basin; mi is the sowing area of various crops (km2); pi is the average price of the crops in a given year; qi is the average grain yield per unit area of crops (t km-2); and M is the total planting area of all crops in a given year (km2).
The ESV equivalent per unit area of different land use types in the study area was determined based on the revised coefficients and formulas. The ESV for various land use types in each province of the Yellow River Basin was then calculated using Equation (2):
$ESV=\sum\limits_{m=1}^{9}{\sum\limits_{n=1}^{6}{\left( {{E}_{a}}\times {{M}_{mn}}\times {{A}_{n}} \right)}}$
where, ESV represents the ESV of the Yellow River Basin (in 108 yuan); An denotes the area of the n-th type of ecosystem within the region; Mmn is the ecological service value equivalent per unit area for the m-th service of the n-th ecosystem type within the Yellow River Basin; and Ea is the economic value of per-unit-area grain yield (104 yuan km-2).

2.3.2 Comprehensive evaluation of high-quality economic development in the Yellow River Basin

There is no universally accepted standard in academia for measuring high-quality development. Most scholars assess high-quality development by constructing an indicator system based on comprehensive evaluation methods (Zhou and Chao, 2023; Li et al., 2024a; Tang et al., 2024). The selection of first-level indicators is guided by high-quality development, emphasizing innovation, coordination, greenness, openness, and sharing. However, the criteria for selecting second-level indicators vary across studies. In light of this, the present study adopts the high-quality development indicator system developed by many scholars based on data availability, scientific rigor, and comparability (for details, see Table 2). In the innovation dimension, the inclusion of secondary indicators such as “regional GDP growth rate” and “technology trade activity rate” accounts for the impact of economic development and capital investment on scientific and technological advancements. The “demand structure” indicator is added to reflect the coordination dimension's balance between internal and external demand. In the openness dimension, the “degree of marketization” is included to capture the tendency of highly market-oriented economies to undertake market-oriented reforms and strengthen international integration. The sharing dimension encompasses common prosperity, resource sharing, and social justice. Therefore, indicators in this dimension include “share of workers’ compensation”, “elasticity of personal income growth”, “urban-rural consumption gap”, and “share of private fiscal expenditure”.
Table 2 High-quality development indicator system in the Yellow River Basin
Dimension Aspect Indicator Effect
Innovation Regional GDP growth rate Regional GDP growth rate +
R&D investment intensity R&D expenditures of industrial enterprises / Regional GDP +
Investment efficiency Investment rate / Regional GDP growth rate -
Technology trade activity rate Technology transaction turnover / Regional GDP +
Coordination Demand structure Total retail sales of consumer goods / Regional GDP +
Urban and rural structures Urbanization rate +
Government debt burden Government debt stock / Regional GDP -
Industry structure Share of tertiary sector in GDP +
Greenness Energy consumption per unit of GDP Total energy consumption / Regional GDP -
Energy consumption elasticity coefficient Growth rate of energy consumption / Regional GDP growth rate -
Wastewater per unit of output Wastewater discharge / Regional GDP -
Exhaust gas per unit of output Sulfur dioxide emissions / Regional GDP -
Openness Degree of marketization Regional marketization index +
Share of foreign investment Actual utilization of foreign investment / Regional GDP +
External trade dependence Total exports and imports / Regional GDP +
Level of financial development Growth in individual loans / Regional GDP +
Sharing Share of workers’ compensation Remuneration of workers / Regional GDP +
Elasticity of personal income growth Growth rate of disposable income per capita / Regional GDP +
Urban-rural consumption gap Consumption expenditure of urban residents / Consumption expenditures of rural residents -
Share of private fiscal expenditure Financial expenditure on people's livelihoods / Total financial expenditure +
The evaluation process begins with standardizing all secondary indicators rendered dimensionless using the effectiveness coefficient method. Positive and negative indicators are normalized using the maximum-minimum method, with positive indicators following Formula (3) and negative indicators following Formula (4).
$X_{ij}^{'}=\frac{{{X}_{ij}}-\min \left( {{X}_{ij}} \right)}{\max \left( {{X}_{ij}} \right)-\min \left( {{X}_{ij}} \right)}$
$X_{ij}^{'}=\frac{\text{max}\left( {{X}_{ij}} \right)-{{X}_{ij}}}{\max \left( {{X}_{ij}} \right)-\min \left( {{X}_{ij}} \right)}$
where, i represents each indicator; j represents each province; and Xij represents the i indicator of province j. This method helps minimize the relative differences between provinces.
Next, the contribution of each indicator is determined, accounting for the diverse development directions of provinces. Ej can be used to represent the contribution of all indicators to Xj.
${{E}_{j}}=-K\underset{i=1}{\overset{9}{\mathop \sum }}\,\frac{X_{ij}^{'}}{\sum\limits_{i=1}^{n}{X_{ij}^{'}}}\ln \left( \frac{X_{ij}^{'}}{\sum\limits_{i=1}^{9}{X_{ij}^{'}}} \right)$
where, $K=1/\text{ln}\left( n \right)$, n represents the number of secondary indicators, ensuring that Ej is greater than 0 and less than 1.
The weights of the five primary indicators—Innovation, Coordination, Greenness, Openness, and Sharing—are then calculated using the entropy method.
${{w}_{j}}=\frac{1-{{E}_{j}}}{\sum\limits_{j=1}^{20}{\left( 1-{{E}_{j}} \right)}}$
Finally, the economic high-quality development index for each province is computed using the linear weighting method.
${{Z}_{i}}=\underset{j=1}{\overset{20}{\mathop \sum }}\,\left( X_{ij}^{'}\times {{w}_{j}} \right)$
where Zi represents the economic high-quality development index of province i; and wj represents the j-th indicator weights.

2.3.3 Coupling and coordination gravity model

The degree of coupling and coordination is a critical indicator used to examine the interactive influence and integration of two or more factors. This study applies a gravity model to measure the spatial coupling interaction between ESV and the level of high-quality development (Li et al., 2024b; Liu et al., 2024). The specific method for constructing this model is as follows:
$C={{\left[ \frac{{{U}_{S}}\times {{U}_{L}}}{{{\left( \frac{{{U}_{S}}+{{U}_{L}}}{2} \right)}^{2}}} \right]}^{\frac{1}{2}}}$
$T=\alpha \times {{U}_{S}}+\beta \times {{U}_{L}}$
$D=\sqrt{C\times T}$
${{f}_{ab}}=\frac{\overline{{{D}_{a}}}\times \overline{{{D}_{b}}}}{{{d}_{ab}}}$
In this model, US represents the ESV; UL represents the high-quality development level index; C represents the coupling degree, which reflects the synchronicity between ecological capital efficiency and the tourism development level. T is the comprehensive evaluation index, capturing the synergistic benefits of ESV and high-quality development level, where α=β=0.5; D represents the coupling coordination degree, which reflects the overall coupled development level of ESV and high-quality development level. Additionally, fab represents the coupling and coordination gravity level between the ESV and the high-quality development level of the two provinces; $\overline{{{D}_{a}}},\ \overline{{{D}_{b}}}$ are the average coupling coordination degrees of provinces a and b; dab represents the distance between provinces a and b, expressed as the straight-line distance between their administrative divisions.

3 Empirical results

3.1 Spatial and temporal changes in ESV

Table 3 shows that the ESV of different land types in the Yellow River Basin underwent significant changes from 2011 to 2021. Among all land types, the ESV per unit area of waters consistently ranked the highest across all ecosystem service categories, followed by wetlands, forests, grasslands, farmlands, and deserts. The corresponding unit ESV average was 110794.54 yuan km-2, 41279.09 yuan km-2, 24415.07 yuan km-2, 8786.68 yuan km-2, and 1075.45 yuan km-2, respectively.
Table 3 ESV of different land types in the Yellow River Basin (Unit: yuan km-2)
Year Farmland Forest Grassland Water Wetland Desert
2011 8203.16 38537.76 22793.68 139090.55 103436.72 1004.03
2012 8799.75 41340.49 24451.39 149206.17 110959.34 1077.05
2013 8708.17 40910.24 24196.91 147653.32 109804.54 1065.84
2014 9357.83 43962.29 26002.09 158668.79 117996.36 1145.36
2015 8532.36 40084.29 23708.39 144672.31 107587.67 1044.32
2016 7621.04 35803.03 21176.18 129220.35 96096.59 932.78
2017 8101.18 38058.67 22510.31 137361.40 102150.81 991.55
2018 7715.67 36247.59 21439.12 130824.86 97289.81 944.37
2019 8141.02 38245.82 22621.00 138036.86 102653.13 996.43
2020 9127.47 42880.09 25362.00 154762.89 115091.68 1117.16
2021 10084.76 47377.36 28021.98 170994.47 127162.53 1234.33
2022 11047.76 51901.46 30697.82 187322.85 139305.36 1352.20
Table 4 Changes in the total ESV in the Yellow River Basin from 2011 to 2022 (Unit: 108 yuan)
Year Farmlands Forests Grasslands Waters Wetlands Deserts Total
2011 8.10 33.21 51.17 8.96 0.10 0.97 102.52
2012 8.68 35.73 54.81 9.54 0.11 1.04 109.91
2013 8.56 35.44 54.18 9.25 0.11 1.03 108.57
2014 9.21 38.13 58.08 9.85 0.11 1.11 116.49
2015 8.36 34.90 52.96 9.02 0.09 1.01 106.34
2016 7.43 31.33 47.27 8.10 0.08 0.90 95.11
2017 7.87 33.49 50.16 8.65 0.08 0.96 101.20
2018 7.48 32.05 47.54 8.08 0.09 0.92 96.16
2019 7.88 34.05 49.91 8.59 0.12 0.97 101.53
2020 8.79 38.36 55.77 9.78 0.14 1.10 113.93
2021 9.71 42.51 61.52 10.76 0.15 1.21 125.86
2022 10.64 46.74 67.09 11.64 0.15 1.33 137.61
The total ESV of the Yellow River Basin exhibited fluctuations during the study period, as shown in Table 3. From 2011 to 2016, the ESV decreased by 741.23 million yuan, with the individual land types contributing to declines of 67.32 million yuan, 187.73 million yuan, 390.21 million yuan, 86.61 million yuan, 2.42 million yuan, and 6.93 million yuan, respectively. In 2017, China carried out the third national land survey that changed how land types were counted, and from the results, it can be seen that the value of ecosystem services in the Yellow River Basin in 2019 has improved to 10153 million yuan. Compared to 2011, the ESV of forests and wetlands in 2019 increased by 84.23 million yuan and 2.10 million yuan, respectively, while the ESV of farmlands, grasslands, and waters decreased by 22.48 million yuan, 126.32 million yuan, and 37.44 million yuan, respectively. Between 2019 and 2022, the ESV of the Yellow River Basin increased steadily each year, reaching 13761 million yuan in 2022—substantially higher than the total ESV recorded in previous years. During this period, the ESV of individual land types increased by 253.95 million yuan, 1353.48 million yuan, 1591.65 million yuan, 268.06 million yuan, 5.24 million yuan, and 36.28 million yuan, respectively, compared to 2011.
Over the full study period (2011-2022), the total ESV of the Yellow River Basin exhibited an upward trend, with a cumulative growth rate of 34.22%. The ESV of individual land types also increased, with growth rates of 31.34%, 40.76%, 31.10%, 29.91%, 52.06%, and 37.35%, respectively. During this period, the trends in the ESV of forests and waters were characterized by steady growth, experiencing only minor declines followed by rapid growth. Farmlands and grasslands showed relatively flat growth from 2011 to 2016 but exhibited more significant increases from 2019 to 2022, with growth rates surpassing previous years. The ESV of wetlands and deserts remained relatively stable. The area of land use can intuitively reflect the amount of ESV of the region. Furthermore, through relevant research, the area of all land types in the Yellow River Basin increases during the study period, in which a large amount of unutilized land is converted into forests, grasslands, waters, and wetlands. This shift aligns with the policies promoting farmland-to-forest conversion, afforestation of barren mountains, and soil erosion control in the Yellow River Basin.
The trend of ESV changes in the nine provinces of the Yellow River Basin can be observed in Figure 2. The analysis reveals that, from 2011 to 2022, the overall ESV in the Yellow River Basin shows a fluctuating upward trend. Regarding regional distribution, the ESV of the Inner Mongolia Autonomous Region is much higher than that of the other provinces, making it the province with the highest average ESV, followed by Qinghai Province. At the same time, Ningxia Hui Autonomous Region consistently registers the lowest ESV. Spatially, the ESV of the nine provinces in the Yellow River Basin demonstrates a decreasing pattern from the Taihang Mountains to the North China Plain, reflecting a spatial distribution where the northern and southern regions have higher ESV, and the eastern and central parts exhibit lower ESV.
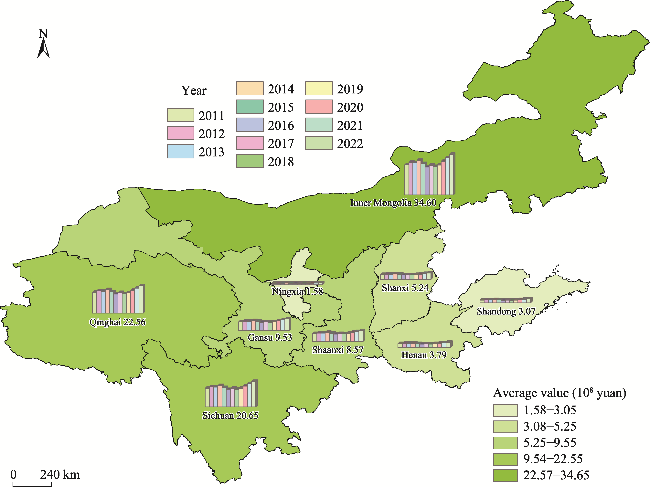
Figure 2 Changes in the spatial pattern of ESV in the Yellow River Basin

Note: For each province, the embedded column chart displays the annual ecosystem service value (ESV) for 2011-2022.

This spatial pattern can be attributed to several factors. First, economic growth has driven increased investment in environmental protection and enhanced environmental governance, leading to ecological improvements. Second, scholarly research indicates significant ecological progress in the Yellow River Basin over the past 15 years. Excluding Henan and Shandong, improvements are particularly evident in the middle and upper reaches of the Yellow River Basin, with increases ranging from 7% to 27%. Gansu Province, in particular, has seen notable improvements due to afforestation, which has significantly boosted ecosystem services. However, reducing wetlands (lakes and marshes) has led to declining ESV in the basin's middle and lower reaches.
Since the reform and opening-up period, China has undertaken numerous ecological restoration and construction projects in the Yellow River Basin. These include the construction of a green ecological corridor in the lower Yellow River, enhancing ecological functions and the estuarine environment; protecting and restoring wetlands in the Yellow River Delta; ceasing legal oil extraction in the estuary to facilitate aquatic life and fish spawning ground restoration; assessing the impact of water and sediment management on aquatic habitats; implementing ecological water replenishment in the Yellow River Delta; accelerating the construction of the Yellow River Estuary National Park; and supporting the creation of a “Beautiful Bay” in the estuary. The primary goal of these initiatives is to strengthen ecological protection and governance, ensuring the long-term stability of the Yellow River, promoting high-quality development in its provinces, and meeting public demand for a healthy ecological environment. Since 1999, China has consistently implemented initiatives to convert farmland into forests and grasslands, with Sichuan, Shaanxi, and Gansu provinces leading the pilot projects. However, despite these efforts, the evapotranspiration rate in the middle reaches of the Yellow River has increased by 3 to 4 mm per year. While soil moisture has remained relatively stable in the middle reaches, it has decreased at 0.0013% per year in ecological restoration areas. The average runoff at hydrological stations from 1961 to 2018 has also shown a consistent annual decrease.

3.2 Temporal and spatial changes of high-quality development indices

The high-quality development index of the nine provinces in the Yellow River Basin, as shown in Table 5, reveals distinct trends that can be divided into three categories. Sustainable growth regions, such as Shandong, Shaanxi, Sichuan, and Henan, have sustained growth in the high-quality development index between 2011 and 2022. Shandong's index increased from 0.2946 to 0.3831, Sichuan's index increased from 0.2360 to 0.3715, Shaanxi's index increased from 0.2336 to 0.3219, and Henan's index increased from 0.2365 to 0.2950 This indicates that these provinces have made more significant progress in high-quality development. The second is the fluctuating growth region represented by Shanxi, Ningxia, and Gansu. Although the index of these provinces as a whole shows fluctuation in growth and growth in fluctuation, the overall trend is upward. This suggests that while progress is being made, it is relatively unstable. Inner Mongolia and Qinghai Province are regions where the index initially increased but later decreased. The index of Inner Mongolia peaked at 0.2838 between 2011 and 2017 but declined to 0.3376 by 2022. Similarly, the index of Qinghai decreased from 0.2396 in 2011 to 0.2050 in 2022 after an initial rise. These trends suggest that while economic development in these provinces improved in the medium term, factors such as resource depletion, environmental protection policies, and adjustments in economic priorities constrained growth momentum in the later stages.
Table 5 High-quality development indices
Year Shandong Henan Shanxi Shaanxi Inner Mongolia Ningxia Gansu Sichuan Qinghai
2011 0.2946 0.2365 0.2285 0.2336 0.2185 0.1919 0.2249 0.2360 0.2396
2012 0.2967 0.2466 0.2249 0.2337 0.2270 0.1917 0.2197 0.2361 0.2146
2013 0.2987 0.2285 0.2288 0.2607 0.2013 0.1886 0.2275 0.2276 0.2144
2014 0.2904 0.2220 0.2431 0.2612 0.1889 0.1839 0.2269 0.2422 0.1931
2015 0.2744 0.2184 0.2757 0.2753 0.1836 0.1682 0.2299 0.2421 0.1983
2016 0.2332 0.1750 0.1822 0.2138 0.1553 0.1280 0.1905 0.1887 0.1468
2017 0.3229 0.2416 0.2260 0.2794 0.2838 0.2243 0.3481 0.2552 0.1998
2018 0.3500 0.2459 0.2681 0.2954 0.2071 0.2348 0.2754 0.2853 0.2027
2019 0.3522 0.2576 0.2633 0.3006 0.1748 0.2325 0.2728 0.3130 0.1824
2020 0.3365 0.2444 0.2427 0.2681 0.2546 0.2293 0.2457 0.3051 0.1848
2021 0.3598 0.2697 0.2620 0.2950 0.2961 0.2569 0.2513 0.3383 0.1949
2022 0.3831 0.2950 0.2813 0.3219 0.3376 0.2845 0.2569 0.3715 0.2050
As shown in Figure 3, the eastern and central regions of the Yellow River Basin, including Shandong, Henan, Shaanxi, and Sichuan, exhibit robust and sustainable economic growth. This is attributed to their solid economic foundations, policy support, and location advantages, which collectively boost the quality of their economies. Conversely, the central and western regions, such as Shanxi, Gansu, and Ningxia, face challenges, including industrial structure, resource constraints, and market environment, leading to more volatile development patterns. Although these regions have experienced some growth in their high-quality development indices, instability remains high. The northwestern regions, including Qinghai and Inner Mongolia, showed improvement in the medium term, driven by resource-based growth and initial economic momentum. However, in recent years, pressures from resource depletion and stringent environmental regulations have hindered sustained development, resulting in a declining trend in the quality of the economy.
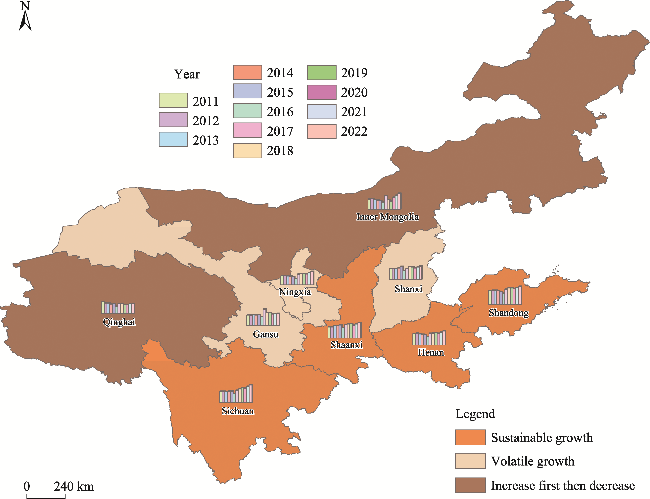
Figure 3 Changes in the spatial pattern of the high-quality development indices in the Yellow River Basin

Note: For each province, the inset column chart depicts annual high-quality development indices.

3.3 Analysis of the coupled and coordinated gravitational relationship between ESV and high-quality development

The spatial linkages between the ESV and the high-quality development levels of the nine provinces in the Yellow River Basin were analyzed using the coupled coordination gravity model. Table 6 presents the coupled coordination gravity matrix, which indicates that Ningxia Hui Autonomous Region and Shaanxi Province exhibit the highest levels of coupled coordination gravity with other provinces, with total values of 4.68 and 4.83, respectively. Shanxi Province ranks second with a total value of 4.46, while Inner Mongolia Autonomous Region shows the lowest coupled coordination gravity, with a total value of 0.98. Individual provincial regions have the lowest level of coupled coordination gravity for the other eight provinces, with a total value of 0.98. Between individual provinces, Shanxi and Henan, Shaanxi and Ningxia, and Shaanxi and Shanxi have coupling coordination gravity values exceeding 1. Conversely, the lowest value is observed between Inner Mongolia and Qinghai, with a coupling coordination gravity of 0.02. The vast territory of Inner Mongolia and the significant distances between its eastern and western regions contribute to weak coupling and coordination. Strengthening spatial connections within this region remains a pressing concern. Further analysis reveals that Shaanxi Province and Ningxia Hui Autonomous Region are the primary sources of gravitational force for coupling ESV and high-quality development. This is largely attributed to the abundance of rivers, lakes, and wetlands in northern Shaanxi and the Ningxia Loop, key recharge sites for the Yellow River's water sources. Moreover, these regions are actively implementing initiatives like the comprehensive management of farmland water pollution and projects like the Loess Plateau Fixed Ditch and Protected Plateau Program in Dongzhi Plateau, Longdong. These efforts have significantly enhanced the ecological quality of the Yellow River Basin while fostering economic development. In contrast, the low level of coupled coordination gravity between Inner Mongolia and other provinces can be primarily attributed to geographic factors. Although Inner Mongolia borders eight provinces and is situated in northern China, its vast area, long spatial distances, and limited transportation accessibility hinder stronger spatial linkages. As a result, the coupling coordination gravity level of Inner Mongolia with other provinces remains the lowest in the region.
Table 6 Coupling and coordination gravity matrix of ESV and high-quality development level in the Yellow River Basin
Province Gansu Henan Inner Mongolia Ningxia Qinghai Shandong Shanxi Shaanxi Sichuan Total
Gansu - 0.10 0.05 0.72 0.47 0.07 0.13 0.22 0.23 1.99
Henan 0.10 - 0.13 0.41 0.05 0.97 1.44 0.83 0.13 4.06
Inner Mongolia 0.05 0.13 - 0.15 0.02 0.20 0.28 0.11 0.03 0.98
Ningxia 0.72 0.41 0.15 - 0.16 0.21 0.68 2.01 0.34 4.68
Qinghai 0.47 0.05 0.02 0.16 - 0.03 0.05 0.08 0.15 1.01
Shandong 0.07 0.97 0.20 0.21 0.03 - 0.68 0.25 0.07 2.48
Shanxi 0.13 1.44 0.28 0.68 0.05 0.68 - 1.08 0.11 4.46
Shaanxi 0.22 0.83 0.11 2.01 0.08 0.25 1.08 - 0.24 4.83
Sichuan 0.23 0.13 0.03 0.34 0.15 0.07 0.11 0.24 - 1.28

4 Conclusions and policy recommendations

4.1 Conclusions

This paper utilized provincial panel data from 2011 to 2022 and employed the Composite Weighting method to measure the comprehensive index of high-quality development. It then analyzed the spatiotemporal evolution characteristics and influencing factors of ESV using the equivalence factor method. Following this, the coupling and coordination gravity model was used to examine the impact of high-quality development on ESV. Based on this, the following conclusions were drawn:
(1) During 2011-2022, the ESV of the Yellow River Basin exhibited an overall fluctuating upward trend, increasing by 34.22%. Forests and wetlands demonstrated the most significant growth in ESV, while other ecosystems, such as waters and grasslands, also experienced notable increases. In particular, the middle and upper reaches of the basin benefitted significantly from policies such as farmland conversion to forests and soil and water conservation initiatives.
(2) The high-quality development indices of provinces in the Yellow River Basin revealed pronounced spatial differences. Eastern and central regions, including Shandong, Shaanxi, Sichuan, and Henan, exhibited robust and sustained growth. In contrast, central and western provinces, such as Shanxi, Ningxia, and Gansu, showed fluctuating growth patterns. Meanwhile, provinces like Qinghai and Inner Mongolia experienced initial growth followed by a decline, indicating a slowdown in economic development quality during later stages.
(3) According to the coupled coordination gravity model, Shaanxi and Ningxia achieved the highest levels of coupled coordination between ESV and high-quality development. This outcome can be attributed to the implementation local wetland and ecological restoration projects. Conversely, provinces such as Inner Mongolia exhibited lower levels of coupled coordination, primarily due to geographic limitations and transportation challenges.

4.2 Policy recommendations

Based on these conclusions, and with a commitment to guiding ecological environmental protection through high- quality development, this paper proposes the following suggestions:
(1) Continue implementing ecological restoration initiatives such as converting farmland to forests and grasslands, soil and water conservation, and wetland protection. Special attention should be given to the middle and upper reaches of the Yellow River Basin, with increased ecological investment to enhance ecosystem service capacity. Efforts should prioritize the protection of wetlands and water ecosystems to elevate their ecological service value further.
(2) The empirical results indicate significant disparities in high-quality development across the eastern, central, and western regions. The state should enhance policy support for western and central provinces, foster resource sharing and technology exchanges, optimize resource allocation, reduce regional development gaps, and promote greater regional economic synergy to address this imbalance.
(3) Actively facilitate the synergistic development of ecosystem services and high-quality economic growth through ecological compensation funds and intelligent ecological management mechanisms. For regions like Inner Mongolia and Qinghai, where ecological foundations are relatively weak, measures should include strengthening transportation infrastructure, improving ecosystem protection and restoration, and fostering linkage within and beyond these regions to align economic and ecological development objectives.
(4) Deepen regional cooperation: Enhance interprovincial and interregional collaboration within the Yellow River Basin, particularly in transboundary ecosystem management and water resource protection. Establish a comprehensive basin management mechanism to balance the interests of upstream and downstream regions and trunk and tributaries. This collaborative approach aims to achieve simultaneous ecosystem protection and high-quality development for the entire Yellow River Basin.
[1]
Cao Y, Kong L, Zhang L, et al. 2021. The balance between economic development and ecosystem service value in the process of land urbanization: A case study of China's land urbanization from 2000 to 2015. Land Use Policy, 108: 105536. DOI: 10.1016/j.landusepol.2021.105536.

[2]
Costanza R, Arge R, De Groot R, et al. 1997. The value of the world's ecosystem services and natural capital. Nature, 387(6630): 253-260.

[3]
Costanza R, De Groot R, Sutton P, et al. 2014. Changes in the global value of ecosystem services. Global Environmental Change, 26: 152-158.

[4]
Guo X, Guo Q, Li Y, et al. 2023. Comparison of the application of different process-based models in the study of spatio-temporal patterns of ecosystem service value. Journal of Resources and Ecology, 14(1): 147-157.

DOI

[5]
Li E, Tang Y, Zhang Y, et al. 2024a. Mechanism research on digital inclusive finance promoting high-quality economic development: Evidence from China. Heliyon, 10(3): e25671. DOI: 10.1016/j.heliyon.2024.e25671.

[6]
Li E Z, Sun C H, Zhang Y W. 2024b. Study on the measurement of ecological capital efficiency in Inner Mongolia and its coupling coordination with tourism based on gravity model. Journal of Inner Mongolia University of Finance and Economics, 22(1): 86-92. (in Chinese)

[7]
Liu M, Lu M, Li Z. 2024. Coupling coordination analysis on digital economy-tourism development-ecological environment. Journal of Cleaner Production, 470: 143320. DOI: 10.1016/j.jclepro.2024.143320.

[8]
Raihan A. 2023. A review on the integrative approach for economic valuation of forest ecosystem services. Journal of Environmental Science and Economics, 2(3): 1-18.

[9]
Sun C H, Li E Z, Gao X. 2024. Ecological factors and economic growth in minority-concentrated provincial-level regions: analysis of endogenous growth model based on resource and environmental constraints. Forward Position, (3): 45-55. (in Chinese)

[10]
Tang X B, Yan X T, Yang M Y, et al. 2024. Coupling coordination of innovative smart city, high-quality economic development, and environment quality—Evidence from Chinese mega-cities. The World of Survey and Research, (12): 17-30. (in Chinese)

[11]
Wei H Q, Wu L, Zhang L. 2024. Spatial relationship of coupling coordination between human settlement environment and digital economy: A case study of urban agglomeration and surrounding cities in the middle reaches of the Yangtze River. Resources and Environment in the Yangtze Basin, 33 (10): 2112-2126. (in Chinese)

[12]
Wei J H, Wen Y L, Gong Z J, et al. 2022. Land use changes and ecosystem service value in the buffer zone of Poyang Lake in recent 30 years. Acta Ecologica Sinica, 42(22): 9261-9273. (in Chinese)

[13]
Xie G D, Zhang C X, Zhang C S, et al. 2015. The value of ecosystem services in China. Resources Science, 37(9): 1740-1746. (in Chinese)

[14]
Yang J, Huang X. 2024. The 30 m annual land cover datasets and its dynamics in China from 1985 to 2024. Earth System Science Data, 13(1): 3907-3925.

[15]
Yao M, Yan F T, Ning Z Z, et al. 2024. The impact of tourism industry agglomeration on the high-quality development of China's tourism economy: Testing based on the Spatial Durbin and Threshold models. Journal of Resources and Ecology, 15(3): 769-781.

[16]
Zhao Z L, Wu X, Zhang Y, et al. 2017. Assessment of changes in the value of ecosystem services in the Koshi River Basin, Central High Himalayas based on land cover changes and the CA-Markov model. Journal of Resources and Ecology. 8(1): 67-76.

DOI

[17]
Zhou W J, Chao X J. 2023. Coupling coordinated development of digital infrastructure, economic resilience and environmental protection in the Yellow River Basin—An approach of ternary system coupling coordination model. Journal of Arid Land Resources and Environment, 37 (9): 1-9. (in Chinese)

Outlines

/