
Journal of Resources and Ecology >
Topological Characteristics and Influencing Factors of the Global Productive Service Trade Network Based on a Social Network Analysis Method
Received date: 2025-04-24
Accepted date: 2025-07-22
Online published: 2025-10-14
Supported by
The National Social Science Fund Project of China(23BJL091)
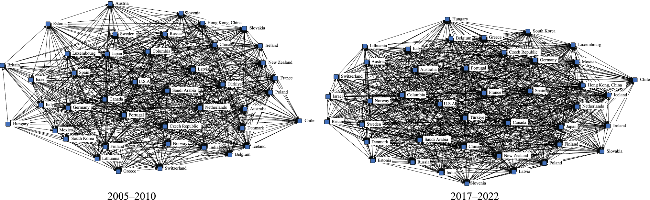
This study explores the spatial correlation of global productive service trade in three stages (2005-2010, 2011-2016, 2017-2022) using the exports of productive services from 42 countries worldwide from 2005 to 2022 as a sample, and then uses social networks and QAP methods to analyze the evolutionary pattern and determining factors of the global productive service trade network. The results showed several key features of this system. (1) During the sample study period, the number of relationships in the global productive service trade network gradually increased and the stability continued to be enhanced. The network has obvious “small world” characteristics, and the speed of node interaction is accelerating. Some developed countries have a clear central position in the network, but developing countries led by China are increasingly playing a bridging role in the global productive service trade network. (2) The members of the global productive service trade network can be divided into four different sectors: “bidirectional spillover”, “intermediary”, “main benefit”, and “net benefit”, and the spillover effects of the export growth of productive service industries in different sectors have obvious ladder characteristics. However, with the increasing frequency of global trade in productive services, its network modularity continues to decline, and the division of member factions is becoming increasingly unclear. (3) The spatial relationships of the global productive service trade network exhibit characteristics of “neighborhood interaction” and “club groups”. During the three sample periods of 2005-2010, 2011-2016, and 2017-2022, geographic adjacency, economic development level, similarity in economic development mode, and the signing of regional trade agreements could collectively explain 52.6%, 60.2%, and 75.8%, respectively, of the spatial correlation in global productive service trade.
ZHOU You . Topological Characteristics and Influencing Factors of the Global Productive Service Trade Network Based on a Social Network Analysis Method[J]. Journal of Resources and Ecology, 2025 , 16(5) : 1257 -1269 . DOI: 10.5814/j.issn.1674-764x.2025.05.001
Table 1 Description of basic indicators of the complete global productive service trade network |
| Indicator | Stage | ||
|---|---|---|---|
| 2005-2010 | 2011-2016 | 2017-2022 | |
| Nodes | 42 | 42 | 42 |
| Edges | 973 | 1138 | 1276 |
| Density | 0.565 | 0.6609 | 0.741 |
| Area | 1 | 1 | 1 |
| Average path length | 1.435 | 1.339 | 1.259 |
| Cluster coefficient | 0.576 | 0.671 | 0.744 |
| Average degree | 32.476 | 35.286 | 37.810 |
| Maximum penetration | 29 | 35 | 36 |
| Degree variance | 21.044 | 27.705 | 15.569 |
| Maximum output | 30 | 35 | 41 |
| Output variance | 13.472 | 13.372 | 13.236 |
| Average intensity (Unit: billion USD) | 23.686×10³ | 28.045×10³ | 41.213×10³ |
| Maximum input intensity (Unit: billion USD) | 17.338×10³ | 25.431×10³ | 35.871×10³ |
| Input intensity variance | 1.732×10⁶ | 2.221×10⁶ | 3.604×10⁶ |
| Maximum output intensity (Unit: billion USD) | 36.536×10³ | 45.981×10³ | 59.102×10³ |
| Output intensity variance | 1.282×10⁶ | 2.193×10⁶ | 2.886×10⁶ |
| Network efficiency | 0.305 | 0.411 | 0.563 |
| Network level degree | 0.211 | 0.183 | 0.132 |
Table 2 Top 15 countries (regions) with degree centrality in the complete network of global productive service trade |
| 2005-2010 | 2017-2022 | ||||||||||||||
|---|---|---|---|---|---|---|---|---|---|---|---|---|---|---|---|
| Total degree | Point out degree | Point in degree | Betweenness centrality | Total degree | Point out degree | Point in degree | Betweenness centrality | ||||||||
| USA | 54 | USA | 30 | Mexico | 29 | USA | 31.951 | USA | 70 | USA | 41 | Chinese Mainland | 37 | USA | 28.348 |
| Netherlands | 51 | Italy | 26 | India | 27 | Sweden | 27.205 | Chinese Mainland | 69 | Germany | 39 | Saudi Arabia | 37 | Spain | 23.906 |
| South Korea | 49 | Spain | 26 | Brazil | 26 | Luxembourg | 26.217 | Mexico | 65 | Netherlands | 36 | India | 36 | Saudi Arabia | 19.010 |
| Japan | 47 | South Korea | 25 | Netherlands | 26 | Lithuania | 25.691 | Germany | 62 | India | 34 | Mexico | 36 | Portugal | 18.596 |
| Canada | 46 | Netherlands | 25 | Canada | 26 | Saudi Arabia | 24.629 | Italy | 62 | France | 33 | Brazil | 34 | Italy | 18.418 |
| Germany | 45 | Germany | 25 | USA | 24 | Japan | 24.339 | France | 61 | Australia | 33 | Turkey | 34 | Mexico | 17.107 |
| Chinese Mainland | 42 | Finland | 25 | Japan | 24 | Spain | 23.300 | Japan | 59 | Canada | 33 | Portugal | 34 | Columbia | 17.005 |
| Czech Republic | 39 | Switzerland | 25 | South Korea | 24 | Portugal | 23.147 | Netherlands | 49 | Chinese Mainland | 32 | Hong Kong, China | 33 | France | 16.930 |
| Spain | 37 | Japan | 23 | Chinese Mainland | 23 | Italy | 22.615 | Israel | 43 | Denmark | 32 | Iceland | 33 | Latvia | 16.598 |
| Luxembourg | 36 | France | 23 | France | 22 | Russia | 22.172 | Australia | 42 | South Korea | 31 | Sweden | 32 | Canada | 16.575 |
| Australia | 36 | Sweden | 20 | Hong Kong, China | 22 | Latvia | 21.805 | Turkey | 41 | Japan | 31 | Italy | 32 | Chinese Mainland | 16.230 |
| Switzerland | 33 | Canada | 20 | Finland | 22 | Denmark | 21.538 | Portugal | 40 | Finland | 30 | Mexico | 31 | Luxembourg | 16.156 |
| Israel | 32 | Luxembourg | 20 | Germany | 20 | Colombia | 21.075 | Columbia | 40 | Italy | 30 | Germany | 30 | Turkey | 16.099 |
| Finland | 30 | Chinese Mainland | 19 | Chile | 19 | Turkey | 20.562 | Spain | 40 | Mexico | 29 | USA | 29 | Russia | 15.796 |
| Hong Kong, China | 29 | Hong Kong, China | 18 | Portugal | 18 | Chinese Mainland | 20.351 | Greece | 37 | Austria | 26 | Czech Republic | 27 | Lithuania | 15.658 |
Figure 1 Complete networks of global productive service trade from 2005-2010 and 2017-2022 |
Table 3 Changes in club members |
| Club | Countries (regions) |
|---|---|
| Stable members of the first club | USA, Australia, Belgium, Czech Republic, Denmark, Finland, France, Germany, Japan, Spain, Sweden, Turkey |
| Stable members of the second club | Canada, Chile, Iceland, Israel, Netherlands, Chinese Mainland, Colombia, Greece, Italy, India, Mexico, South Korea |
| Stable members of the third club | New Zealand, Austria, Portugal, Poland, Norway, Luxembourg, Switzerland, Saudi Arabia, Ireland, United Kingdom, Hong Kong (China) |
| Free members between clubs | Estonia, Slovakia, Latvia, Lithuania, Russia, Slovenia, Hungary |
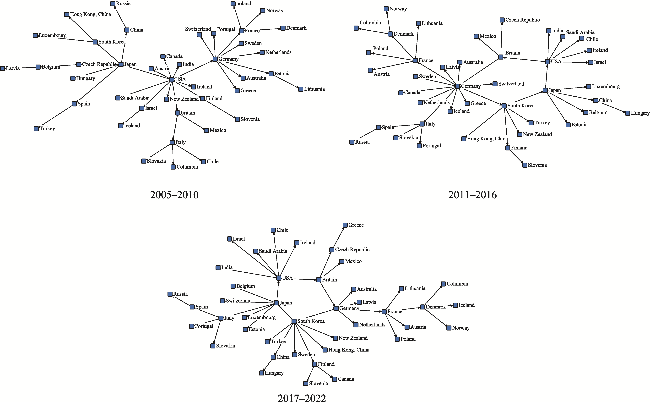
Figure 2 Top 1 network structures of global productive service trade from 2005-2010, 2011-2016, and 2017-2022 |
Table 4 The top five countries for each period in terms of the out-degree of the Top 1 network nodes in the global trade of productive service industries |
| 2005-2010 | 2011-2016 | 2017-2022 | |||
|---|---|---|---|---|---|
| Country | Node output degree | Country | Node output degree | Country | Node output degree |
| USA | 9 | South Korea | 7 | Germany | 11 |
| Japan | 6 | USA | 6 | USA | 6 |
| Germany | 6 | Japan | 6 | Japan | 5 |
| Italy | 4 | Germany | 5 | France | 4 |
| South Korea | 3 | France | 4 | Britain | 3 |
Table 5 Correlation analysis between the spatial correlation matrix of global productive service trade and its influencing factors |
| Stage | Variable | ||||||
|---|---|---|---|---|---|---|---|
| S | Pgdpc | Roadc | Pfrc | Struc | Openc | F | |
| 2005-2010 | 0.061** | -0.187** | -0.022 | -0.075* | -0.126* | -0.072* | 0.103** |
| 2011-2016 | 0.076* | -0.194* | -0.051 | -0.095* | -0.173* | -0.085* | 0.136** |
| 2017-2022 | 0.084** | -0.301*** | -0.037 | -0.186** | -0.190** | -0.106** | 0.177*** |
Note: *, **, and *** indicate significance at the 10%, 5%, and 1% levels, respectively. The same below. |
Table 6 Model fitting results |
| Stage | R2 | Adjusted R2 | Probability that the null hypothesis does not hold |
|---|---|---|---|
| 2005-2010 | 0.563 | 0.526 | 0.003 |
| 2011-2016 | 0.669 | 0.602 | 0.005 |
| 2017-2022 | 0.794 | 0.758 | 0.001 |
Table 7 QAP regression results of factors influencing the spatial correlation of global productive service trade |
| Variable | Stage | ||
|---|---|---|---|
| 2005-2010 | 2011-2016 | 2017-2022 | |
| Intercept | 1.170 | 0.813 | 1.142 |
| S | 0.094** | 0.141** | 0.196** |
| Pgdpc | -0.136* | -0.162* | -0.221** |
| Pfrc | -0.055** | -0.087* | -0.133** |
| Struc | -0.087* | -0.104** | -0.202** |
| Openc | -0.029** | -0.081** | -0.135* |
| F | 0.102** | 0.136* | 0.164** |
Table 8 Results of the robustness test |
| Variable | Stage | ||
|---|---|---|---|
| 2005-2010 | 2011-2016 | 2017-2022 | |
| Intercept | 5.372 | 4.811 | 6.437 |
| S | 0.081 | 0.094 | 0.116 |
| Pgdpc | -0.343** | -0.264** | -0.337*** |
| Pfrc | -0.031* | -0.065* | -0.098* |
| Struc | -0.207* | -0.317* | -0.393** |
| Openc | -0.122** | -0.186** | -0.223** |
| F | 0.291** | 0.325* | 0.443** |
| [1] |
|
| [2] |
|
| [3] |
|
| [4] |
|
| [5] |
|
| [6] |
|
| [7] |
|
| [8] |
|
| [9] |
|
| [10] |
|
| [11] |
|
| [12] |
|
| [13] |
|
| [14] |
|
| [15] |
|
| [16] |
|
| [17] |
|
| [18] |
|
| [19] |
|
| [20] |
|
| [21] |
|
| [22] |
|
| [23] |
|
| [24] |
|
| [25] |
|
/
| 〈 |
|
〉 |