Ecosystems and Ecosystem Services

Assessing the Effects of Ecological Restoration Technology on Soil Erosion, Runoff and Sediment in Luoyugou Watershed of the Loess Plateau

  • LUO Qi , 1, 2 ,
  • YANG Fan 2 ,
  • LI Zihan 2 ,
  • WANG Hongxing 2 ,
  • LIU Zujian 2 ,
  • XIA Ruiheng 2 ,
  • YE Junzhi 3, 4 ,
  • ZHEN Lin , 3, 4, *
Expand
  • 1. State Key Laboratory of Hydroscience and Engineering, Tsinghua University, Beijing 100084, China
  • 2. China Aero Geophysical Survey and Remot Sensing Center for Natural Resources, Beijing 100083, China
  • 3. Institute of Geographic Sciences and Natural Resources Research, Chinese Academy of Sciences, Beijing 100101, China
  • 4. School of Resources and Environment, University of Chinese Academy of Sciences, Beijing 100049, China
*ZHEN Lin, E-mail:

LUO Qi, E-mail:

Received date: 2024-07-20

  Accepted date: 2024-11-20

  Online published: 2025-08-05

Supported by

The Open Research Fund Program of State Key Laboratory of Hydroscience and Engineering(sklhse-2024-A-01)

The Key Laboratory of Airborne Geophysics and Remote Sensing Geology Foundation(2023YFL18)

The Asia-Pacific Network for Global Change Research(CRRP2022-02MY-Shoyama)

Abstract

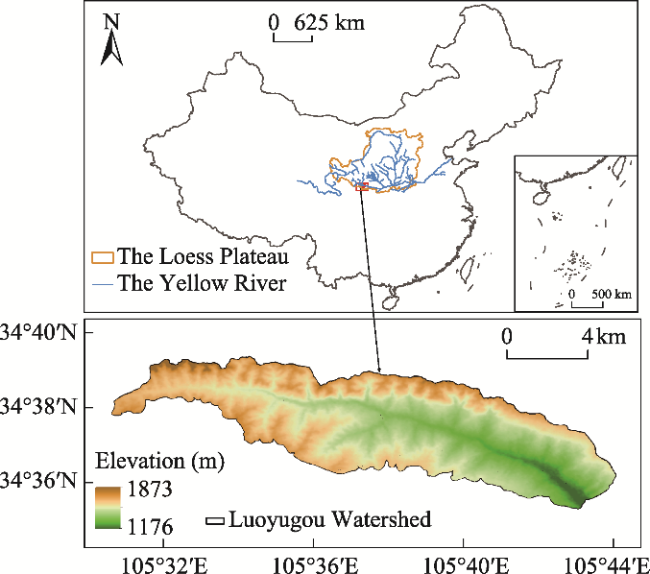
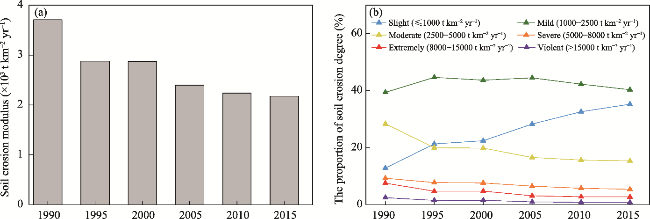
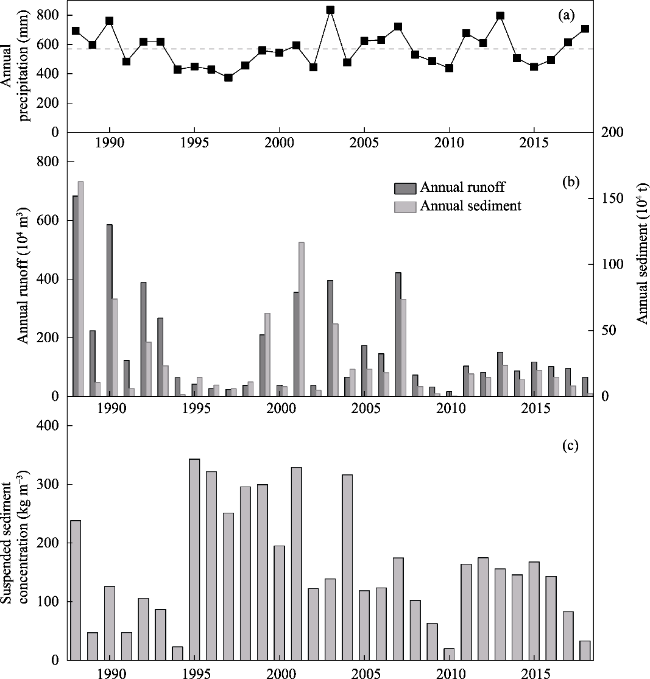
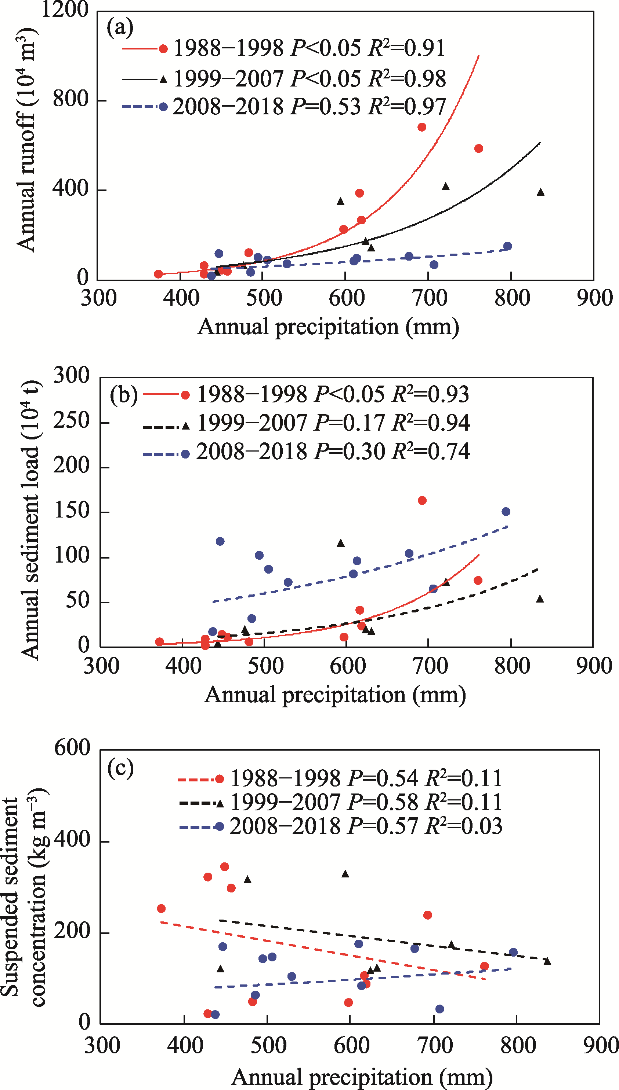
The Loess Plateau is a densely populated, important ecological security frontier and a major grain- producing region in China. Conversely, it is highly susceptible to soil erosion. In response to soil erosion, a series of restoration technologies were launched, including afforestation, check dams, terraces and so on. Research on the restoration of the soil erosion is a key to regional sustainable development, and ecological protection and high-quality development in the Yellow River Basin. In this research, we analyzed the spatial and temporal patterns of soil erosion and compared the changes in runoff and sediment transportation in the whole watershed using spatial data, statistical data and GIS spatial analysis tools and RUSLE models. The main results include: (1) from 1990 to 2015, the soil erosion modulus in the Luoyugou Watershed dropped from 3706.2 t km-2 yr-1 to 2176.5 t km-2 yr-1, among which, the decline from 1990 to 1995 and 2000 to 2005 was the largest, with decrease of 827.8 t km-2 yr-1 and 480.7 t km-2 yr-1, respectively. (2) From 1988 to 2018, the M-K test of runoff and sediment transportation in the Luoyugou Watershed showed a downward trend. In the early period (1988-1998), the average annual runoff, annual sediment transportation, and sediment transportation per runoff were 2.23 million m3, 351000 t, and 182.2 kg m-3, respectively. In the later period (2008-2018), these values dropped to 852000 m3, 114000 t and 115.2 kg m-3, showing the decreases of 61.8%, 67.5% and 36.7%, respectively. (3) From 1988 to 2018, the runoff and sediment transportation showed a significant correlation with the annual rainfall in the Luoyugou Watershed. With the increase in rainfall, the runoff of Luoyugou increased rapidly in the early period (1988-1998) and the sediment transportation increased rapidly in the later period (2008-2018). The findings of this research provide reference for understanding the ecological and environmental effects of restoration technology and scientifically guiding ecological restoration practices.

Cite this article

LUO Qi , YANG Fan , LI Zihan , WANG Hongxing , LIU Zujian , XIA Ruiheng , YE Junzhi , ZHEN Lin . Assessing the Effects of Ecological Restoration Technology on Soil Erosion, Runoff and Sediment in Luoyugou Watershed of the Loess Plateau[J]. Journal of Resources and Ecology, 2025 , 16(4) : 973 -981 . DOI: 10.5814/j.issn.1674-764x.2025.04.005

1 Introduction

Soil erosion affects the material cycle and energy flow of ecosystems, causing changes in ecological processes such as soil moisture, nutrients, surface runoff and erosion, altering the supply capacity of ecosystem services, thereby disrupt-ing ecosystem balance, affecting sustainable development of the environment and regions, and global carbon cycling (Galy et al., 2015; Wang at al., 2016). The Loess Plateau is the most serious area of soil erosion in the world. And it is a densely populated area, an important food production area, a region with severe poverty in China, and a key area for soil and water conservation and ecological construction (Liu et al., 2017). The ecological environment of the Loess Plateau is fragile and sensitive to climate change, and it is one of the regions with the most concentrated contradictions in population, resources, and environment in China (Fu et al., 2017; Wu et al., 2020). The easily eroded area in the Loess Plateau is about 4.72×10⁵ km2, accounting for 72.8% of the total area, and its sediment production accounts for about 90% of the total sediment of the Yellow River (Chen et al., 2015). In response to the problem of soil erosion, China has launched a series of ecological governance projects, such as the National Key Project of Soil and Water Conservation, the Return of Farmland to Forests, and the Yellow River Soil and Water Conservation Ecological Plan (Bryan et al., 2018). Vegetation restoration technologies represented by returning farmland to forests and afforestation, as well as engineering technologies represented by check dams, terraces, and fish scale pits have been widely used (Zhen et al., 2019; Zhen et al., 2020).
The evaluation of governance effectiveness always based on remote sensing data, socio-economic yearbooks, hydrological and meteorological observation data, etc., using single indicator or indicator system (vegetation cover, soil moisture, soil erosion, runoff, sediment, etc.), applying ecological models (soil erosion model RUSLE/CSLE, plant growth model DSSAT, soil moisture model simulation and vegetation carrying capacity model SWCCV, soil organic carbon model RothC, etc.) and statistical analysis methods (including DPSIR conceptual framework, TOPSIS entropy weight method, vector autoregression model and structural equation, etc.) to analyze land use and vegetation cover changes, soil and water conservation, river runoff, soil erosion intensity and socio-economic changes at multiple scales (land parcels, watersheds, typical sample areas, administrative regions, and geomorphic units) (Zhao et al., 2017; Guo et al., 2019; Luo et al., 2020; Wen and Zhen, 2020; Fu, 2022). Researches shows that the Grain for Green Project has increased the vegetation coverage in the Loess Plateau from 31.6% in 1999 to 65.0% in 2017 (Chen et al., 2015; Feng et al., 2016). Such a large-scale afforestation significantly decreased the sediment deposition in the Yellow River (Wang et al., 2016), meanwhile, it also posing a risk of water resource shortages (Feng et al., 2016). More than 100000 check dams have been built in the Loess Plateau since the 1950s (Wang et al., 2016; Xu et al., 2018), which have shown quick effectiveness in flood control and sediment reduction, but their functions are influenced by their capacity (Vaezi et al., 2017). Compared with the image of ecological governance on land degradation, precipitation is also an important influencing factor of soil erosion. In the studied recent 61-year period, both of the annual precipitation and precipitation intensity in the Yellow River Basin followed increasing trends, and the number of days of heavy rain, rainstorm, and heavy rainstorm followed an upward trend (Yuan et al., 2024). However, the evaluation of ecological management effects often lack attention to the changes in soil erosion caused by precipitation changes.
The Luoyugou Watershed located in the Loess Plateau is a critical and sensitive area for the ecosystem. It is also a key demonstration area for major forestry ecological projects and soil and water conservation in China, such as the Natural Forest Protection Project and the Grain for Green Project. It has the first soil and water conservation observation station established in China in 1942. This study explores the spatial and temporal changes in soil erosion in this basin over the past 30 years using remote sensing data and soil erosion models. Additionally, it analyzes changes in runoff and sediment yield in the basin and the impact of precipitation on these factors based on hydrological and meteorological observation data. The goal is to clarify the ecological and environmental effects of ecological management and restoration measures in this small watershed over the past 30 years, providing more direct guidance for strategies to restore soil and water conservation.

2 Materials and methods

2.1 Study area

The Luoyugou Watershed is located in Tianshui City, Gansu Province, situated at the southern edge of the Loess Plateau. It is a first-order tributary of the Ji River, itself a tributary of the Wei River. The central point of the watershed is positioned at 105°37′E, 34°38′N. The annual average temperature is 10.7 ℃, with January and July averages of -2.3 ℃ and 22.6 ℃, respectively. The annual average precipitation is 554.2 mm, with more than 60% occurring from June to September. The annual evaporation rate is 1293.3 mm. The watershed covers an area of approximately 72.8 km², characterized by a narrow shape. The main channel is 21.63 km long, and there are 138 tributaries of varying sizes (Figure 1).
Figure 1 Location of the study area

2.2 Data collection

Precipitation data were obtained from the Tianshui Soil and Water Conservation Scientific Experimental Station and the National Earth System Science Data Center. Runoff and sediment yield data were sourced from the Tianshui Soil and Water Conservation Scientific Experimental Station and relevant literature (Zhang et al., 2007; Chen, 2008; Yan et al., 2013), with all runoff and sediment yield data monitored by hydrological stations within the Luoyugou Watershed. For the RUSLE model, the rainfall erosivity factor (R) was calculated using monthly weather data from World Clim V2.1; the soil erodibility factor (K) was derived using the EPIC model, utilizing soil characteristic datasets from the “Chinese Soil Taxonomy” and local soil taxonomy records. These K values were linked to a 1:1000000 soil map to create the soil erodibility map, with gaps filled using HWSD and SoilGrid databases and processed using GIS spatial interpolation and smoothing methods. The topographic factor (LS) was calculated using the “China 30 m Resolution DEM Dataset” from the Chengdu Institute of Mountain Hazards and Environment, Chinese Academy of Sciences. The cover management factor (C) was computed using AVHRR NDVI data (1981-2016, 1 km resolution). The support practice factor (P) was based on 30 m resolution ESA CCI_LC land cover data, with data prior to 1992 using the 1992 P factor. Data on soil and water conservation measures were collected from the Forestry and Grassland Bureau and Water Affairs Bureau of Qinzhou and Maiji districts in Tianshui City. All factors in the RUSLE model were standardized to a 30 m spatial resolution in ArcGIS 10.2.

2.3 Methodology

2.3.1 Soil erosion calculation

Soil erosion modulus was calculated using the Revised Universal Soil Loss Equation (RUSLE):
A=R×K×L×S×C×P
where A is the annual soil erosion modulus (t km-2 yr-1); R is the rainfall erosivity factor (MJ mm ha-1 h-1 yr-1); K is the soil erodibility factor (t ha-1 h-1 MJ-1 mm-1); L and S are the slope length and steepness factors; C is the cover and management factor; P is the support practice factor, dimensionless.
① Rainfall erosivity factor (R) was calculated based on monthly precipitation:
R=0.3589F1.9462
F=i=112pi2×p1
where F is the precipitation seasonality index; p is the average annual precipitation (mm); pi is the average monthly precipitation (mm).
② Soil erodibility factor (K) was calculated using the modified EPIC model:
$\begin{aligned}K_{E P I C}= & \left\{0.2+0.3 \exp \left[-0.0256 S_{a}\left(1-\frac{S_{i}}{100}\right)\right]\right\}\left(\frac{S_{i}}{C_{l}+S_{i}}\right)^{0.3} \\& \times\left[1-\frac{0.25 C}{C+\exp (3.72-2.95 C)}\right] \\& \times\left[1-\frac{0.7 S_{n}}{S_{n}+\exp \left(-5.51+22.9 S_{n}\right)}\right]\end{aligned}$
Sn=1Sa/100
K=0.01383+0.51575KEPIC
where Sa, Si, and Cl are the percentages of sand, silt, and clay, respectively; C is the percentage of organic carbon.
③ Slope length factor (L) and slope steepness factor (S) were calculated:
L=L0200.24

S=10.8×sinθ+0.0316.8×sinθ0.5020.204×sinθ1.240429.585×sinθ5.6079θ5°5°<θ10°10°<θ25°θ>25°

where θ is the slope angle (°); L0 is the slope length (m), derived from 30 m resolution DEM data.
④ Cover and management factor (C) was calculated using NDVI data:
Cforest/grass=1.2899×e6.343×NDVI
Ccropland=0.143×lnNDVI+0.2525
NDVI=i=112NDVIi×Pi/P
where Cforest/grass is the C factor for forest/grassland; Ccropland is the C factor for cropland; NDVI is the weighted value of precipitation; NDVIi is the NDVI for the i-th month; Pi is the precipitation for the i-th month (mm); P is the annual precipitation (mm).
⑤ Practice factor (P) was based on ESA CCI_LC land cover data. Due to the earliest availability of this data from 1992, land cover data before 1992 used the P factor in 1992.

2.3.2 Mann-Kendall trend test

The Mann-Kendall trend test was applied to analyze trends in precipitation, runoff, and sediment yield over time. This non-parametric test does not require the data to follow a specific distribution and is not affected by a few outliers, making it widely used in hydrological and meteorological time series analysis.
S=i=1n1j=i+1nsgnxjxi
sgnxjxi= 1 if xjxi>0 0 if xjxi=01 if xjxi<0
VarS=nn12n+5i=1mtiti1)(2ti+518
Standardize S to obtain Z:
Z=S1VarS            if S>0 0 if S=0S+1VarS             if S<0
where S is the sum of the differences between the compared values, Var(S) is the variance of S. A positive Z value indicates an increasing trend, while a negative Z value indicates a decreasing trend, and the larger the absolute value of Z, the more significant the trend of change in the time series. The significance level P<0.05 corresponds to a confidence level Z1−α/2 =1.96, which means when -1.96≤Z≤1.96, the trend change is not significant; When 1.96<Z or Z<-1.96, the trend changes significantly.

3 Results

3.1 Ecological management measures in Luoyugou Watershed

The ecological management measures in the Luoyugou Watershed include engineering measures and vegetation restoration measures, engineering measures include terraced fields, silt dams, gully head and Gufang, vegetation restoration measures include grain for green, afforestation on barren hills, enclosing and tending. From 1998 to 2014, a total of 4165.7 ha of grain for green in the Luoyugou were completed, including 1620.8 ha of ecological forests, 2544.9 ha of economic forests. Afforestation on barren hills is about 489 ha, forest enclosing and tending occupied 133.3 ha, terraced fields covered an area of 1741.1 ha. Additionally, 304 Gufang were constructed, 46 gullies head protection projects were implemented, and 6 silt dams were built. The majority of grain for green occurred from 1998 to 2003. The converted area increased annually from 1998 to 2001, then slightly declined from 2002 to 2003. From 2003 to 2010, the annual increment in grain for green was relatively small, and after 2010, there was essentially no additional conversion. Afforestation on barren hills was primarily concentrated from 2000 to 2004, with notably high increments in 2002 and 2004. Slope closure and grass cultivation were mainly concentrated from 1999 to 2001, with small annual increments. The construction of terraced fields was concentrated from 1998 to 2002, with an annual increase of 325.3 ha during this period. Between 2007 and 2010, the annual additions to terraced fields were relatively low. The construction of Gufang was focused from 1998 to 2002, adding 40 structures each year. Gully head protection projects were mainly implemented from 1998 to 2002, with 9 to 10 new locations each year. Additionally, in 1998 and 2010, 1 and 5 silt dams were constructed respectively.
Table 1 The area of restorations technologies completed in Luoyugou Watershed from 1998 to 2014 (Unit: ha)
Year Grain for green Afforestation on barren hills Enclosing and
tending
Terraced fields Gufang Silt dam Gully head
Total Ecological forest Economic forest
1998 571.7 189.4 382.3 0 0 325.3 40 1 10
1999 701.3 219.8 481.5 0 36.6 325.3 40 0 9
2000 819.3 271.7 547.6 13.3 54.9 325.3 40 0 9
2001 964.6 417.1 547.5 33.3 41.8 325.3 40 0 9
2002 601.6 279.3 322.3 126.7 0 325.3 40 0 9
2003 171.5 101.3 70.2 33.3 0 0 0 0 0
2004 26.2 26.2 0 246.7 0 0 0 0 0
2005 32 17.4 14.6 0 0 0 0 9 0
2006 56.1 29.5 26.7 0 0 0 0 0 0
2007 17.1 17.1 0 13.3 0 17.3 0 0 0
2008 32.9 18.6 14.3 9 0 17.3 0 0 0
2009 131.8 16.4 115.4 0 0 51 104 0 0
2010 39.7 17.2 22.6 0 0 28.8 0 5 0
2011 0 0 0 0 0 0 0 0 0
2012 0 0 0 0 0 0 0 0 0
2013 0 0 0 0 0 0 0 0 0
2014 0 0 0 13.3 0 0 0 0 0
Total 4165.7 1620.8 2544.9 489 133.3 1741.1 304 6 46

Note: Data source: The management of soil and water loss in the Luoyugou is project oriented, and the main control projects implemented in the past 30 years are the Grain for Green Project and the “Yellow River Soil and Water Conservation Ecological Project Gansu Tianshui Leveraging the River Demonstration Zone Project”. The above data on soil erosion control measures are collected from the Forestry and Grassland Bureau and Water Affairs Bureau of Tianshui City, including the data on the control measures of the Grain for Green Project and the demonstration area project by the river. The units for Gufang, silt dams and Gully head in the table are the individual numbers.

3.2 Temporal and spatial characteristics of soil erosion

The Luoyugou’s annual average soil erosion modulus over the years is shown in Figure 2a. The basin’s soil erosion modulus exhibited a significant decrease in two time periods, 1990-1995 and 2000-2005. In 1990, the average soil erosion modulus in the basin was 3706.2 t km-2 yr-1, with the most heavily eroded area reaching 71253.1 t km-2 yr-1. By 1995, the average soil erosion modulus had decreased to 2878.4 t km-2 yr-1, a 22.3% drop compared to 1990. There was no significant change between 1995 and 2000. In 2000, the average soil erosion modulus was 2875.2 t km-2 yr-1, decreasing to 2394.5 t km-2 yr-1 by 2005. The most severely eroded area reached 57081.3 t km-2 yr-1 in 2005, reflecting a 16.7% reduction from 2000. After 2005, the average soil erosion modulus remained relatively stable. The change in erosion modulus is mainly caused by fluctuations in the soil conservation measure factor P. The P factor was relatively high before 1995, with average values of 0.68, while from 1995 to 2005, the soil and water conservation measure factor in the basin significantly decreased, in 2000, the average P factor in the basin was 0.56, after from 2005, there was no significant change in the P factor.
Figure 2 The soil erosion modulus (a) and proportion of soil erosion degree (b) in Luoyugou Watershed from 1990 to 2015
Referring to the “Classification and Gradation Standards of Soil Erosion” (SL190-96), the soil erosion intensity in the Luoyugou was categorized into six levels based on the erosion modulus: ≤1000 t km-2 yr-1 as slight erosion, 1000- 2500 t km-2 yr-1 as mild erosion, 2500-5000 t km-2 yr-1 as moderate erosion, 5000-8000 t km-2 yr-1 as severe erosion, 8000-15000 t km-2 yr-1 as extremely severe erosion, and >15000 t km-2 yr-1 as violent erosion. The results indicate that the basin is primarily affected by slight, mild, and moderate soil erosion, with a smaller proportion of severe, extremely severe, and violent erosion, areas at higher altitudes experience more severe soil erosion (Figure 2b, Figure 3). The percentage of slight soil erosion has continuously increased from 12.9% in 1990 to 35.3% in 2015. The percentage of mild soil erosion increased from 39.4% in 1990, peaked at 44.7% in 1995, stabilized around 45% from 1995 to 2005, and gradually declined to 40.3% in 2015. The proportion of moderate soil erosion decreased from 28.4% in 1990 to 20.0% in 1995, remaining relatively stable thereafter. The proportions of severe, extremely severe, and violent erosion decreased from 1990 to 2015, with severe erosion dropping from 9.3% to 5.4%, extremely severe erosion from 7.0% to 2.8%, and violent erosion from 2.5% to 0.8%.
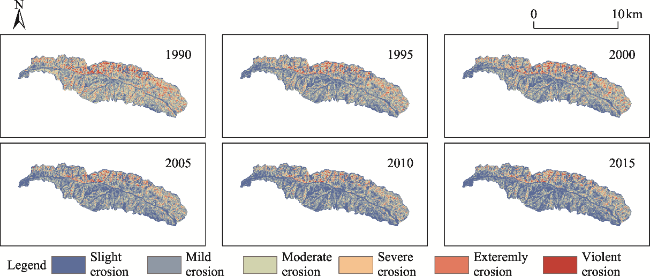
Figure 3 The distribution of soil erosion degree in Luoyugou Watershed

3.3 Changes in runoff and sediment yield

Ranging from 1988 to 2018, the annual average precipitation in the study area was 569 mm, showing significant inter-annual variability (Figure 4a). The Mann-Kendall test revealed an upward trend in precipitation over this period, albeit not significant (Table 2). Over the same period, the annual runoff and sediment yield in the Luoyugou experienced significant inter-annual fluctuations (Figure 4b). Both runoff and sediment yield were highest in 1988, with the runoff decreasing to 17.0 million m3 in 2010, and the sediment yield plummeting to 0.3 million t in the same year. The Mann-Kendall test indicated a significant downward trend in sediment yield from 1988 to 2018. Additionally, the unit runoff sediment yield in the basin depicted a decreasing trend from 1988 to 2018, with the highest being 343.1 kg m-3 in 1995 and the lowest at 20.0 kg m-3 in 2010.
Table 2 The M-K test of annual precipitation, annual runoff, annual sediment yield and suspended sediment concentration from 1988 to 2018 in Luoyugou Watershed
Item M-K test Z-value Trend Significant
Rainfall 0.61 Upward Not significant
Runoff -1.82 Downward Not significant
Sediment yield -2.01 Downward Significant
Sediment concentration -1.53 Downward Not significant
Figure 4 Annual precipitation (a), annual runoff and sediment yield (b), suspended sediment concentration (c) of Luoyugou Watershed from 1988 to 2018
Research has indicated a close relationship between sediment yield and basin soil erosion. Although sediment yield does not directly equate to soil erosion amount, the basin’s sediment yield is a consequence of large-scale erosion, where an increase in soil erosion leads to higher sediment yield. The annual sediment yield in the basin correlates well with the simulated soil erosion results, verifying the reliability of the RUSLE model’s soil erosion simulations (Figure 5).
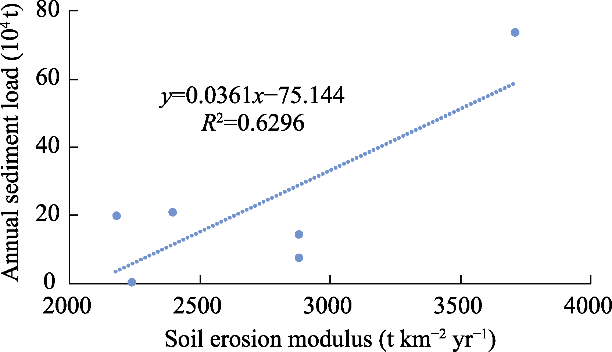
Figure 5 The relationship between soil erosion modulus and annual sediment yield

3.4 Changes in runoff and sediment transport with precipitation

The period from 1988 to 2018 was divided into three intervals: 1988-1998 (early period), 1999-2007 (mid-term period), and 2008-2018 (late period). Analysis reveals that the multi-year average runoff volumes for the early, mid-term, and late periods were 223.0 million m3, 189.4 million m3, and 85.2 million m3 respectively. The multi-year average sediment yields for the same periods were 35.1 million t, 36.0 million t, and 11.4 million t, while the multi-year average unit runoff sediment yields were 182.2 kg m-3, 180.1 kg m-3, and 115.2 kg m-3 respectively. The annual runoff volumes, sediment yields, and unit runoff sediment yields were analyzed in relation to annual precipitation. The results show that runoff exhibited significant correlation with precipitation in the early and mid-term periods, while this relationship was not significant in the late period. With increasing annual precipitation, runoff increased most rapidly in the early period, followed by the mid-term period (Figure 6a). Sediment yield had a significant correlation with precipitation in the early period but not in the mid-term and late periods (Figure 6b). Unit runoff sediment yield did not show a significant correlation with annual precipitation in any of the three periods (Figure 6c).
Figure 6 Correlations between rainfall with runoff, sediment load and suspended sediment concentration in Luoyugou Watershed

4 Discussion

The study results indicate that the soil erosion in the Luoyugou basin improved notably during the periods 1990- 1995 and 2000-2005 (Figure 2). Furthermore, from 1988 to 2018, the annual runoff and sediment yield in the basin exhibited a significant declining trend (Figure 6). Chen et al. (2011) based on a vegetation-erosion dynamic model simulation, found that the soil erosion rate in the Luoyugou decreased by 40% and 70% during the periods 1988-1995 and 2000-2005 respectively, aligning closely with the findings of this study. The reduction in soil erosion, runoff, and sediment production in this study could be attributed to the extensive ecological restoration measures taken in the basin from 1998 to 2004, including substantial eco-rehabilitation initiatives such as ecological reforestation, terraced fields construction, and silt dam building as shown in Table 1. Zuo et al. (2016) studies have revealed that restoration measures including afforestation, terraced fields, and silt dam significantly reduced the runoff and sediment in the Loess Plateau from 1980 to 2005.
Vegetation restoration have a profound impact on the runoff and sediment production processes at the slope and even watershed scales. The main function is to reduce the kinetic energy of precipitation hitting the ground and increase canopy evaporation, then the root system works effectively on consolidating soil, increasing surface roughness and promoting water infiltration, and thus affecting soil resistance to erosion and river runoff which improved (Zouré et al., 2019). Studies have demonstrated that due to transpiration, afforestation lead to soil moisture decrease and groundwater level decline (Sun et al., 2006; Cao et al., 2011; Lu et al., 2018). Therefore, vegetation restoration efforts should consider local soil and climate conditions (Fu et al., 2017; Lu et al., 2020), ensure a reasonable quantity of vegetation planting, balance ecological water consumption with socio-economic water use (Feng et al., 2016; Ge et al., 2020).
Engineering measures such as terraced fields and silt dams have changed the surface slope, blocked the outflow of runoff, reduced soil erosion, decreased sediment content, and also improved soil moisture and physicochemical properties, thus creating conditions for the survival and growth of forest land. Wang et al. (2016) shows that from 1980 to 1999, the construction of terraced fields and silt dams in the Yellow River Basin was the main reason for the decrease in sediment transport during this period, contributing 33% and 21% respectively. Although these engineering measures are effective in reducing sediment, their soil conservation benefits are affected by reserves and service life, and require regular maintenance and reinforcement (Vaezi et al., 2017). Therefore, compared to engineering measures, vegetation restoration measures have a long-term effect on the control of soil erosion and can fundamentally address the problem of soil erosion. Therefore, combining the two control measures will be more effective for soil erosion control.
The analysis of the relationship between precipitation and runoff, sediment yield was based on annual rainfall. However, numerous studies indicate that basin sediment output depends on the characteristics of individual rainfall events (Li et al., 2019; Bai et al., 2020). For instance, Fang et al. (2011) studied nine significant rainfall events in the Wanjiaqiao basin (out of a total of 40 rainfall events in the year) and found that these nine events accounted for 50% of the annual precipitation, contributing to 58% of the annual total runoff and a striking 90% of the annual total sediment yield. Therefore, it is essential for future studies to further analyze the relationship between individual rainfall events and runoff, sediment yield.

5 Conclusions

From 1990 to 2015, there was a significant decrease in soil erosion in the Luoyugou basin, with a notable reduction in the proportion of moderate erosion and an increase in slight soil erosion. The most significant improvements occurred during the periods 1990-1995 and 2000-2005. From 1988 to 2018, both the annual runoff and sediment yield in the Luoyugou exhibited a declining trend. A comparison between 1988-1998 and 2008-2018 shows a decrease of over 60% in annual runoff and sediment yield, along with a reduction of more than 30% in unit runoff sediment yield, indicating the effectiveness of the watershed conservation measures. The annual runoff and sediment yield in the Luoyugou demonstrate a strong correlation with annual precipitation, with the unit runoff sediment yield showing no significant correlation with annual precipitation. The impact of annual precipitation on runoff is more pronounced in the early period, while its influence on sediment yield is greater in the late period.
[1]
Bai L C, Wang N, Jiao J Y, et al. 2020. Soil erosion and sediment interception by check dams in a watershed for an extreme rainstorm on the Loess Plateau, China. International Journal of Sediment Research, 35(4): 408-416.

[2]
Bryan B A, Gao L, Ye Y Q, et al. 2018. China’s response to a national land-system sustainability emergency. Nature, 559: 193-204.

[3]
Cao S X, Chen L, Shankman D, et al. 2011. Excessive reliance on afforestation in China’s arid and semi-arid regions: Lessons in ecological restoration. Earth-Science Reviews, 104(4): 240-245.

[4]
Chen Y H. 2008. Vegetation-erosion dynamic process research in typical watershed in the Loess Plateau. Diss., Beijing, China: Beijing Forestry University. (in Chinese)

[5]
Chen Y H, Wang F X, Liu G Q, et al. 2011. Modified vegetation-erosion dynamics model and its application in typical watersheds in the Loess Plateau. International Journal of Sediment Research, 26(1): 78-86.

[6]
Chen Y P, Wang K B, Lin Y S, et al. 2015. Balancing green and grain trade. Nature Geoscience, 8: 739-741.

[7]
Fang N F, Shi Z H, Li L, et al. 2011. Rainfall, runoff, and suspended sediment delivery relationships in a small agricultural watershed of the Three Gorges area, China. Geomorphology, 135(1-2): 158-166.

[8]
Feng X M, Fu B J, Piao S L, et al. 2016. Revegetation in China’s Loess Plateau is approaching sustainable water resource limits. Nature Climate Change, 6: 1019-1022.

[9]
Fu B J. 2022. Ecological and environmental effects of land-use changes in the Loess Plateau of China. Chinese Science Bulletin, 67: 3768-3779. (in Chinese)

[10]
Fu B J, Wang S, Liu Y, et al. 2017. Hydrogeomorphic ecosystem responses to natural and anthropogenic changes in the Loess Plateau of China. Annual Review of Earth and Planetary Sciences, 45: 223-243.

[11]
Galy V, Peucker-Ehrenbrink B, Eglinton T. 2015. Global carbon export from the terrestrial biosphere controlled by erosion. Nature, 521: 204-207.

[12]
Ge J, Pitman A J, Guo W D, et al. 2020. Impact of revegetation of the Loess Plateau of China on the regional growing season water balance. Hydrology and Earth System Sciences, 24(2): 515-533.

[13]
Guo H L, Zhang B B, Hill R L, et al. 2019. Fish-scale pit effects on erosion and water runoff dynamics when positioned on a soil slope in the Loess Plateau region, China. Land Degradation & Development, 30(15): 1813-1827.

[14]
Li P, Xu G C, Lu K X, et al. 2019. Runoff change and sediment source during rainstorms in an ecologically constructed watershed on the Loess Plateau, China. Science of the Total Environment, 664: 968-974.

[15]
Liu G B, Shangguan Z P, Yao W Y, et al. 2017. Ecological effects of soil conservation in Loess Plateau. Bulletin of Chinese Academy of Sciences, 32(1): 11-19. (in Chinese)

[16]
Lu C X, Zhao T Y, Shi X L, et al. 2018. Ecological restoration by afforestation may increase groundwater depth and create potentially large ecological and water opportunity costs in arid and semiarid China. Journal of Cleaner Production, 176: 1213-1222.

[17]
Lu Q, Lei J Q, Li X S, et al. 2020. China’s combating desertification: National solutions and global paradigm. Bulletin of Chinese Academy of Sciences, 35(6): 656-664. (in Chinese)

[18]
Luo Q, Zhen L, Xiao Y, et al. 2020. The effects of different types of vegetation restoration on wind erosion prevention: A case study in Yanchi. Environmental Research Letters, 15(11): 115001. DOI: 10.1088/1748-9326/abbaff.

[19]
Sun G, Zhou G Y, Zhang Z Q, et al. 2006. Potential water yield reduction due to forestation across China. Journal of Hydrology, 328(3-4): 548-558.

[20]
Vaezi A R, Abbasi M, Keesstra S, et al. 2017. Assessment of soil particle erodibility and sediment trapping using check dams in small semi-arid catchments. CATENA, 157: 227-240.

[21]
Wang S, Fu B J, Piao S L, et al. 2016. Reduced sediment transport in the Yellow River due to anthropogenic changes. Nature Geoscience, 9: 38-41.

[22]
Wen X, Zhen L. 2020. Soil erosion control practices in the Chinese Loess Plateau: A systematic review. Environmental Development, 34: 100493. DOI: 10.1016/j.envdev.2019.100493.

[23]
Wu X T, Wei Y P, Fu B J, et al. 2020. Evolution and effects of the social-ecological system over a millennium in China’s Loess Plateau. Science Advances, 6(41): eabc0276. DOI: 10.1126/sciadv.abc0276.

[24]
Xu G C, Cheng S D, Li P, et al. 2018. Soil total nitrogen sources on dammed farmland under the condition of ecological construction in a small watershed on the Loess Plateau, China. Ecological Engineering, 121: 19-25.

[25]
Yan Q H, Yuan C P, Lei T W, et al. 2013. Effects of precipitation and erosion control practices on the rainfall-runoff-sediment delivery relationships of typical watersheds in the hilly-gully region on the Loess Plateau. Science of Soil and Water Conservation, 11(4): 9-16. (in Chinese)

[26]
Yuan Z, Zhang Z G, Yan J, et al. 2024. Spatiotemporal characteristics of different grades of precipitation in Yellow River Basin from 1960 to 2020. Arid Zone Research, 41(8): 1259-1271. (in Chinese)

DOI

[27]
Zhang X M, Yu X X, Wu S H, et al. 2007. Response of land use/coverage change to hydrological dynamics at watershed scale in the Loess Plateau of China. Acta Ecologica Sinica, 27(2): 414-421. (in Chinese)

[28]
Zhao G J, Kondolf G M, Mu X M, et al. 2017. Sediment yield reduction associated with land use changes and check dams in a catchment of the Loess Plateau, China. CATENA, 148: 126-137.

[29]
Zhen L, Hu Y F, Wei Y J, et al. 2019. Trend of ecological degradation and restoration technology requirement in typical ecological vulnerable regions. Resources Science, 41(1): 63-74. (in Chinese)

DOI

[30]
Zhen L, Ishwaran N, Luo Q, et al. 2020. Role and significance of restoration technologies for vulnerable ecosystems in building an ecological civilization in China. Environmental Development, 34: 100494. DOI: 10.1016/j.envdev.2020.100494.

[31]
Zouré C, Queloz P, Koïta M, et al. 2019. Modelling the water balance on farming practices at plot scale: Case study of Tougou Watershed in Northern Burkina Faso. CATENA, 173: 59-70.

[32]
Zuo D P, Xu Z X, Yao W Y, et al. 2016. Assessing the effects of changes in land use and climate on runoff and sediment yields from a watershed in the Loess Plateau of China. Science of the Total Environment, 544: 238-250.

Outlines

/