
Journal of Resources and Ecology >
Spatiotemporal Correlation between Agglomeration of Homestay and Environmental Field: Insights from Wuyuan, China
|
NIAN Bohan, E-mail: nbh111926@163.com |
Received date: 2024-10-03
Accepted date: 2025-01-18
Online published: 2025-08-05
Supported by
The National Natural Science Foundation of China(42201187)
The Jiangxi Provincial Department of Education Graduate Innovation Fund Project(YJS2023012)
Regional clustering has become a distinctive feature of the homestay industry in terms of spatial distribution in many countries. However, identifying and quantifying the advantageous locations suitable for the agglomeration of the homestay industry at the micro-scale is still in the exploratory stage. Therefore, with the support of multi-source data and the spatial entropy weight superposition method, drawing on concepts from physics such as gravitational and magnetic fields, and based on relevant location theories, the environmental field strength and its quantitative model are proposed to evaluate micro-locations suitable for homestay development. Finally, a case study was conducted in Wuyuan, China. The results show that the homestay industry is mainly distributed along traffic lines and rivers, which is greatly affected by tourism resources and rural settlements, and the degree of agglomeration is gradually increasing; The environmental field strength is closely related to the accessibility of infrastructure and the development of tourism resources, and the overall structure tends to be networked, polycentric and “core-periphery”; there is a positive linear correlation between the distribution of homestay industry and environmental field strength. This study provides a basis for optimising decision-making related to the sustainable planning and site-selection of tourism destinations and the homestay industry.
NIAN Bohan , FENG Xinghua , JIANG Lizhen , XU Liting , LI Jianxin . Spatiotemporal Correlation between Agglomeration of Homestay and Environmental Field: Insights from Wuyuan, China[J]. Journal of Resources and Ecology, 2025 , 16(4) : 1241 -1256 . DOI: 10.5814/j.issn.1674-764x.2025.04.026
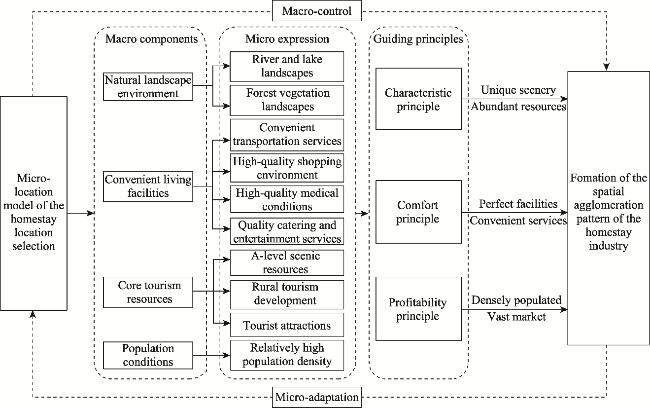
Figure 1 Identification logic of the micro-location model of the homestay industry |
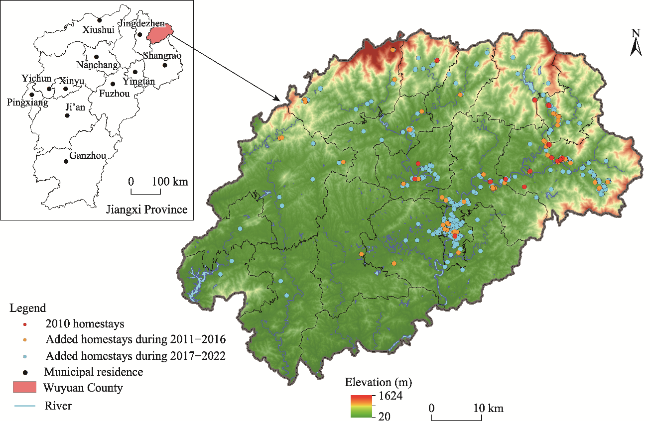
Figure 2 Study area and the homestay distribution in Wuyuan |
Table 1 Homestay environmental factor definitions and measurement methods |
| Locational factors | Environmental factors | Micro-location measurement indicators | Indicator measurement methodology | Description of the indicator measurement methodology |
|---|---|---|---|---|
| Natural landscape environment | Landscape resources | River distribution | Buffer analysis | Assignment of buffers by distance from the locational factor |
| Forest cover | Assignment stacking analysis | The magnitude of the role of the influencing elements of the locational factors was first assigned, and an overlay analysis was carried out using GIS software | ||
| Convenient living facilities | Transport facility environment | Accessibility of bus stations, highway interchanges, high-speed rail stations, and parking lots | Cost-weighted distance algorithm | Calculation of the shortest weighted distance from each grid to a destination grid by applying the shortest path method to the raster data |
| Shopping facility environment | Accessibility of department stores, supermarkets, general markets, and convenience stores | |||
| Medical facility environment | Accessibility of hospitals, clinics, and pharmacies | |||
| Catering and entertainment environment | Accessibility of Chinese restaurants, Western restaurants, coffee shops, bars, and tea houses | |||
| Core tourism resources | Tourist attraction environment | Distribution of A-class scenic spots | Buffer analysis | Assignment of buffers by distance from the locational factor |
| Scenic spot environment | Distribution of scenic spot POI | |||
| Rural tourism Environment | National and provincial key villages for rural tourism and A-class rural tourism spots | |||
| Population conditions | Population environment | Population distribution | Assignment stacking analysis | The magnitude of the role of the influencing elements of the locational factors was first assigned, and an overlay analysis was carried out using GIS software |
Table 2 Spatial distribution types of homestays in Wuyuan |
| Year | Average nearest neighbour distance (m) | Expected nearest neighbour distance (m) | Nearest neighbour index | Z-value | P-value | Distribution type |
|---|---|---|---|---|---|---|
| 2010 | 1418.95 | 3185.92 | 0.445 | -5.09 | <0.001 | Agglomeration |
| 2016 | 695.04 | 2146.85 | 0.324 | -14.58 | <0.001 | Agglomeration |
| 2022 | 176.34 | 973.73 | 0.171 | -48.21 | <0.001 | Agglomeration |
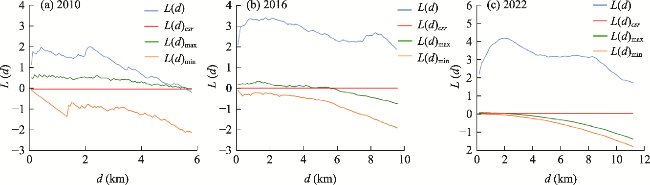
Figure 3 Ripley’s K-function of homestays in Wuyuan in 2010, 2016 and 2022Note: L(d)csr denotes the theoretical value of the L-function under complete spatial randomness. |
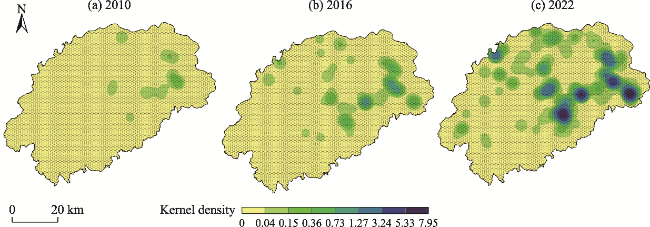
Figure 4 Kernel density map of Wuyuan homestays in 2010, 2016 and 2022 |
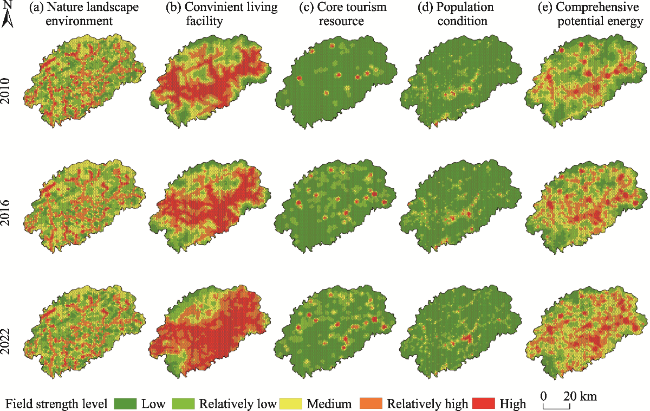
Figure 5 Spatial pattern characteristics of the Wuyuan homestay environmental field strength in 2010, 2016 and 2022 |
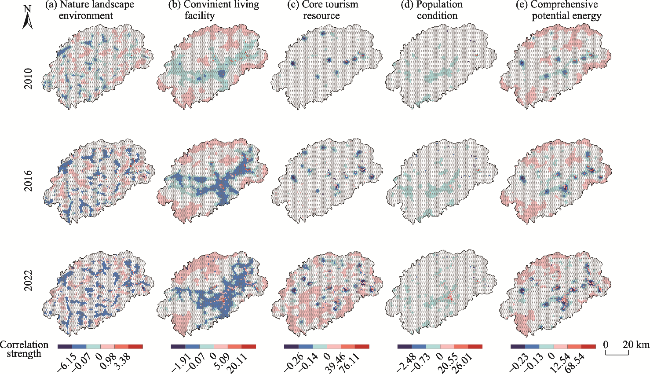
Figure 6 Analysis of the evolution of the spatiotemporal correlation pattern of the homestay industry agglomeration and environmental field |
| [1] |
|
| [2] |
|
| [3] |
|
| [4] |
|
| [5] |
|
| [6] |
|
| [7] |
|
| [8] |
|
| [9] |
|
| [10] |
|
| [11] |
|
| [12] |
|
| [13] |
|
| [14] |
|
| [15] |
|
| [16] |
|
| [17] |
|
| [18] |
|
| [19] |
|
| [20] |
|
| [21] |
|
| [22] |
|
| [23] |
|
| [24] |
|
| [25] |
|
| [26] |
|
| [27] |
|
| [28] |
|
| [29] |
|
| [30] |
|
| [31] |
|
| [32] |
|
| [33] |
|
| [34] |
|
| [35] |
|
| [36] |
|
| [37] |
|
| [38] |
|
| [39] |
|
| [40] |
|
| [41] |
|
| [42] |
|
| [43] |
|
| [44] |
|
| [45] |
|
| [46] |
|
| [47] |
|
| [48] |
|
| [49] |
|
| [50] |
|
| [51] |
|
| [52] |
|
| [53] |
|
| [54] |
|
| [55] |
|
| [56] |
|
| [57] |
|
| [58] |
|
| [59] |
|
| [60] |
|
| [61] |
|
| [62] |
|
| [63] |
|
| [64] |
|
| [65] |
|
| [66] |
|
| [67] |
|
/
| 〈 |
|
〉 |