
Journal of Resources and Ecology >
Does the Environmental Fit of Tourists in Agricultural Heritage Sites Promote Pro-environmental Behavior?—Exploring the Mediating Role of Place Attachment
|
DONG Fengli, E-mail: dongfengli@syau.edu.cn |
Received date: 2024-09-20
Accepted date: 2025-01-10
Online published: 2025-08-05
Supported by
The Liaoning Provincial Department of Education Fund Project(WSNZK201903)
The Key Project of National Social Science Fund of China(17ATY015)
The General Project of the Fund of Education Department of Liaoning Province(JYTMS20231311)
The Key Project of Shenyang Social Sciences Association(SYSK2024-JD-01)
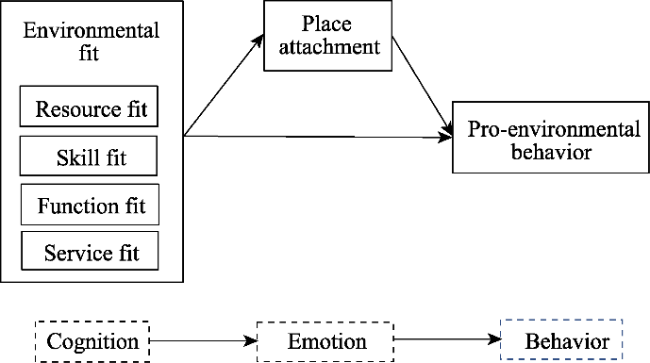
Agricultural heritage tourism resources, represented by ecological vulnerability and cultural sensitivity, require careful stewardship. Tourists’ environmentally responsible actions are vital for preserving both the natural and cultural environment of these destinations, ensuring their sustainability. According to “cognition-emotion-behavior theory” and the hierarchy model of tourism experience, this study constructs a conceptual model between tourists’ environmental fit, place attachment and pro-environmental behavior. Structural equation modeling and the Bootstrap method are employed for empirical testing. Results indicate that: (1) Function fit has a significant positive effect on tourists’ pro-environmental behaviors. (2) Service fit also has a significant positive effect on tourists’ pro-environmental behaviors. (3) Place attachment mediates the relationship between environmental fit and pro-environmental behaviors. Therefore, recommendations are offered for managing agricultural heritage tourism destinations to cultivate tourists’ sense of functional fit and service fit and to strengthen their place attachment.
DONG Fengli , GUO Yanli , CHENG Diexiang , GU Xiaoping . Does the Environmental Fit of Tourists in Agricultural Heritage Sites Promote Pro-environmental Behavior?—Exploring the Mediating Role of Place Attachment[J]. Journal of Resources and Ecology, 2025 , 16(4) : 1196 -1206 . DOI: 10.5814/j.issn.1674-764x.2025.04.022
Figure 1 Research conceptual model |
Table 1 Interviewee basic information |
| Item | Content | Frequency | Percentage (%) |
|---|---|---|---|
| Gender | Male | 166 | 47.98 |
| Female | 180 | 52.02 | |
Age (yr) | 0-20 | 15 | 4.33 |
| 21-35 | 103 | 29.77 | |
| 36-50 | 105 | 30.35 | |
| 51-65 | 80 | 23.12 | |
| 66 and older | 43 | 12.43 | |
| Education level | Primary school and below | 13 | 3.75 |
| Junior high | 66 | 19.08 | |
| High school (including vocational high schools and technical secondary schools) | 76 | 21.97 | |
| College or university degree | 155 | 44.80 | |
| Master’s degree or above | 36 | 10.40 | |
| Average monthly income (yuan) | Less than 2000 | 69 | 19.94 |
| 2001-4000 | 106 | 30.64 | |
| 4001-6000 | 91 | 26.30 | |
| 6001-8000 | 41 | 11.85 | |
| More than 8000 | 39 | 11.27 | |
| Number of visits in one year | 1 time | 145 | 41.91 |
| 2 or more times | 201 | 58.09 |
Table 2 Scale reliability and convergence validity test |
| Variable | Measurement item | Factor loading | Cronbach’s α | CR | AVE |
|---|---|---|---|---|---|
Resource fit (RF) | Pieces of Nanguo Pear flowers are suitable for taking photos and clocking in | 0.671 | 0.812 | 0.813 | 0.522 |
| I can see the original Nanguo Pear ancestral tree | 0.724 | ||||
| Here I can learn the mysterious story of the ancestral tree | 0.714 | ||||
| Here I can learn the rich meaning of Nanguo Pear culture | 0.776 | ||||
| Skill fit (SF) | I know the specialty here is Nanguo Pears | 0.794 | 0.821 | 0.823 | 0.539 |
| I know when the Nanguo Pears bloom | 0.718 | ||||
| I can communicate with others about Nanguo Pear and other related topics | 0.740 | ||||
| I have enough knowledge to interpret the natural and human resources of the scenic spot | 0.679 | ||||
| Function fit (FF) | It can be known from the inscription that Anshan Nanguo Pear cultivation system is an agricultural cultural heritage | 0.736 | 0.849 | 0.851 | 0.535 |
| Knowing the inscription has improved my awareness of protection | 0.773 | ||||
| The ancestral tree lets me know that this is the source of Nanguo Pear | 0.748 | ||||
| The introduction of the ancestral garden can know the characteristics of the ancestral tree | 0.757 | ||||
| Here can see Anshan Nanguo Pear farming process, increase knowledge | 0.635 | ||||
| Service fit (SF1) | Environmental protection broadcasting in scenic spots is in place | 0.712 | 0.849 | 0.849 | 0.531 |
| I agree with the management's protection of Nanguo Pear’s ancestral tree | 0.662 | ||||
| Local special activities can carry on the culture | 0.746 | ||||
| The local service can reflect the cultural characteristics of Nanguo Pear | 0.747 | ||||
| The infrastructure setting incorporates elements of Nanguo Pear culture | 0.770 | ||||
| Place attachment (PA) | I strongly identify with Nanguo Pear culture | 0.743 | 0.888 | 0.889 | 0.533 |
| I strongly identify with the local customs and practices | 0.725 | ||||
| I feel like a part of this place | 0.746 | ||||
| I feel a sense of belonging to the good environment here | 0.715 | ||||
| I like coming here more than any other place | 0.687 | ||||
| If you want to know Nanguo Pear ancestral tree, this is the only place | 0.745 | ||||
| Here’s the best place to learn about Nanguo Pear | 0.747 | ||||
| Pro-environmental behavior (PEB) | I do not arbitrarily pick Nanguo Pear flowers, fruit | 0.725 | 0.893 | 0.893 | 0.510 |
| I care about the development of the natural environment in scenic spots | 0.731 | ||||
| I can persuade or stop others from doing things that destroy the natural environment | 0.675 | ||||
| I will properly dispose of the garbage generated during the travel process | 0.686 | ||||
| I do not interfere with the daily life of local residents | 0.753 | ||||
| I respect local customs | 0.721 | ||||
| I took the initiative to participate in Nanguo Pear farming activities to understand the use of farming tools | 0.745 | ||||
| I tell other people about the story of Nanguo Pear history | 0.672 |
Table 3 Scale discriminative validity test |
| Variable | RF | SF | FF | SF1 | PA | PEB |
|---|---|---|---|---|---|---|
| RF | 0.722 | |||||
| SF | 0.658*** | 0.734 | ||||
| FF | 0.684*** | 0.698*** | 0.731 | |||
| SF1 | 0.653*** | 0.583*** | 0.645*** | 0.729 | ||
| PA | 0.676*** | 0.697*** | 0.699*** | 0.643*** | 0.730 | |
| PEB | 0.580*** | 0.567*** | 0.648*** | 0.666*** | 0.706*** | 0.714 |
Note: ***, **, * are denoted as statistical significance at 0.01, 0.05, 0.1, respectively. The same below. |
Table 4 The model fitting degree of EF and PA on PEB |
| Fit index | x2/df | RMSEA | CFI | IFI | TLI | GFI | PNFI | PCFI |
|---|---|---|---|---|---|---|---|---|
| Acceptable range | < 3 | < 0.08 | >0.80 | >0.80 | >0.80 | >0.80 | >0.50 | >0.50 |
| Fitting results of model | 1.417 | 0.035 | 0.964 | 0.964 | 0.961 | 0.892 | 0.821 | 0.891 |
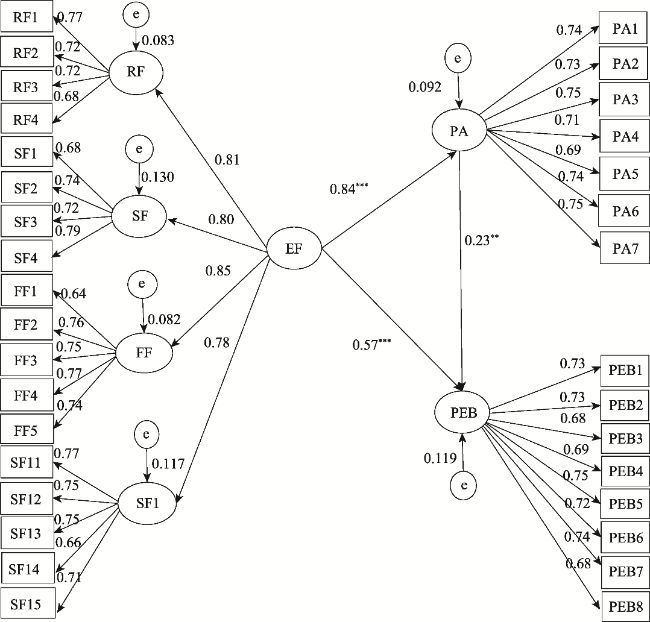
Table 5 The analysis model path coefficient of EF and PA on PEB |
| Main effect model | Standard path coefficient | S.E. | P-value | Result |
|---|---|---|---|---|
| H1: EF→PA | 0.838 | 0.125 | <0.001 | Support |
| H2: PA→PEB | 0.230 | 0.092 | 0.034 | Support |
| H3: EF→PEB | 0.569 | 0.149 | <0.001 | Support |
Figure 2 Path coefficient diagram effect model of EF and PA on PEB |
Table 6 The model fitting degree of EF dimensions and PA on PEB |
| Fit index | x2/df | RMSEA | CFI | IFI | TLI | GFI | PNFI | PCFI |
|---|---|---|---|---|---|---|---|---|
| Acceptable range | <3 | < 0.08 | > 0.80 | > 0.80 | > 0.80 | > 0.80 | > 0.50 | > 0.50 |
| Fitting results of model | 2.395 | 0.064 | 0.880 | 0.881 | 0.870 | 0.818 | 0.747 | 0.810 |
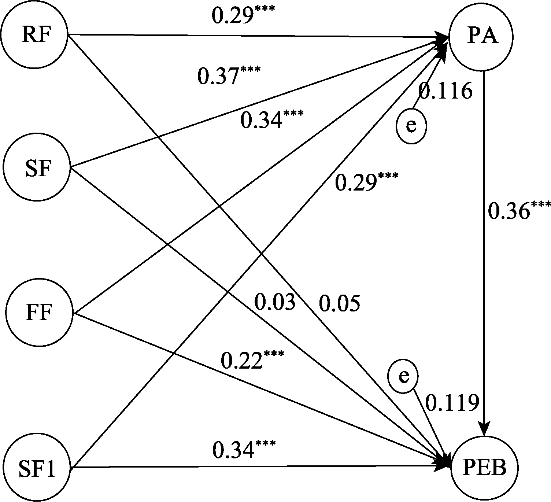
Table 7 The analysis model path coefficient of EF dimensions and PA on PEB |
| Path | Standardized coefficient | S.E. | P-value | Result |
|---|---|---|---|---|
| H1a: RF→PA | 0.285 | 0.057 | <0.001 | Support |
| H1b: SF→PA | 0.374 | 0.045 | <0.001 | Support |
| H1c: FF→PA | 0.339 | 0.052 | <0.001 | Support |
| H1d: SF1→PA | 0.288 | 0.048 | <0.001 | Support |
| H2: PA→PEB | 0.360 | 0.085 | <0.001 | Support |
| H3a: RF→PEB | 0.050 | 0.056 | 0.386 | Not support |
| H3b: SF→PEB | 0.029 | 0.045 | 0.638 | Not support |
| H3c: FF→PEB | 0.216 | 0.054 | <0.001 | Support |
| H3d: SF1→PEB | 0.336 | 0.053 | <0.001 | Support |
Figure 3 Path coefficient diagram of the effect model of EF dimensions and PA on PEB |
Table 8 The results of the mediation effect test |
| Effect path | Direct effect value | Bias-corrected 90% CI direct effect | Indirect effect value | Bias-corrected 90% CI indirect effect | ||
|---|---|---|---|---|---|---|
| LB | UB | LB | UB | |||
| EF→PA→PEB | 0.569*** | 0.365 | 0.776 | 0.192* | 0.016 | 0.367 |
| RF→PA→PEB | 0.050 | ‒0.084 | 0.184 | 0.103*** | 0.048 | 0.178 |
| SF→PA→PEB | 0.029 | ‒0.095 | 0.158 | 0.135*** | 0.076 | 0.219 |
| FF→PA→PEB | 0.216** | 0.081 | 0.352 | 0.122*** | 0.063 | 0.216 |
| SF1→PA→PEB | 0.336*** | 0.213 | 0.470 | 0.104*** | 0.049 | 0.178 |
| [1] |
|
| [2] |
|
| [3] |
|
| [4] |
|
| [5] |
|
| [6] |
|
| [7] |
|
| [8] |
|
| [9] |
|
| [10] |
|
| [11] |
|
| [12] |
|
| [13] |
|
| [14] |
|
| [15] |
|
| [16] |
|
| [17] |
|
| [18] |
|
| [19] |
|
| [20] |
|
| [21] |
|
| [22] |
|
| [23] |
|
| [24] |
|
| [25] |
|
| [26] |
|
| [27] |
|
| [28] |
|
| [29] |
|
| [30] |
|
| [31] |
|
| [32] |
|
| [33] |
|
| [34] |
|
| [35] |
|
| [36] |
|
| [37] |
|
| [38] |
|
/
| 〈 |
|
〉 |