Special Column: Ecotourism and Rural Revitalization

Exploring the Influence of Tourism Network Attention on the Development of Tourism in the Yangtze River Delta: A Spatial Analysis

  • WANG Yuewei , 1 ,
  • DI Jiao , 1, * ,
  • CHEN Hang , 2, * ,
  • AN Lidan 1
Expand
  • 1. Business School, Economics Faculty, Liaoning University, Shenyang 110136, China
  • 2. School of Tourism Management, Shenyang Normal University, Shenyang 110034, China
*DI Jiao, E-mail: ;
CHEN Hang, E-mail:

WANG Yuewei, E-mail:

Received date: 2024-09-02

  Accepted date: 2025-03-10

  Online published: 2025-08-05

Supported by

The National Social Science Foundation of China(21BTY064)

The Basic Scientific Research Project of Colleges and Universities of Liaoning Province Education Department(LJ122410176001)

The Basic Scientific Research Project of Colleges and Universities of Liaoning Province Education Department(LJ132410166036)

Abstract

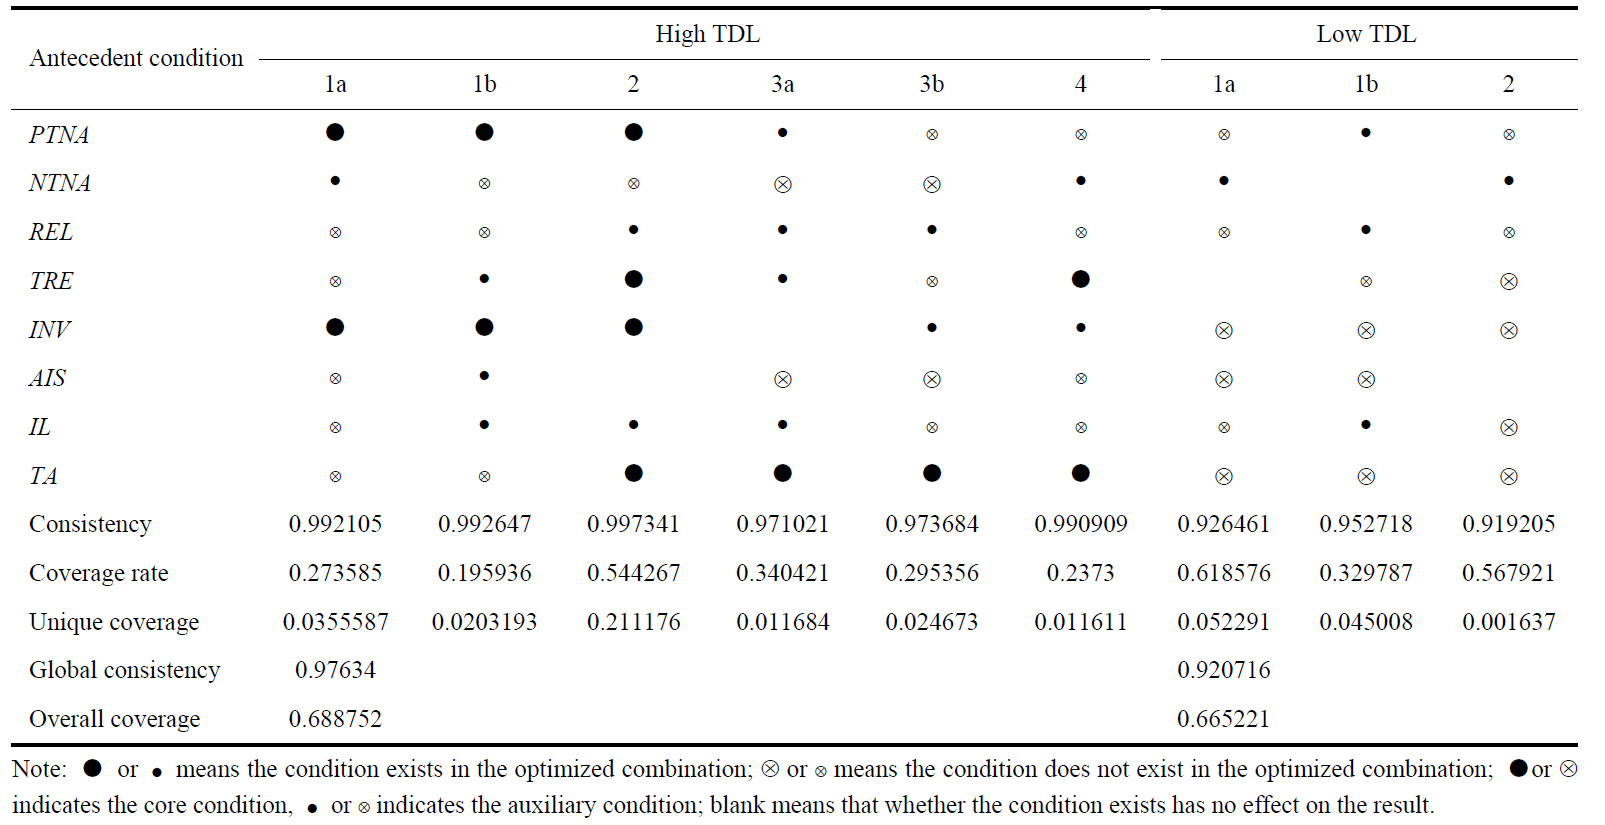
This study incorporates both positive and negative tourism network attention into a comprehensive framework to examine their distinct effects on tourism development in the Yangtze River Delta (YRD). In particular, this study uses a spatial econometric model to accurately examine the relationship between positive and negative tourism network attention and regional tourism development, including the impact of tourism network attention on local and neighboring areas. In addition, the framework also uses fuzzy set qualitative comparative analysis (fsQCA) to explore the path combination of network attention and other factors that affect varied stages of tourism development in each city of the YRD, and expounds its driving mechanism. Research findings reveal: (1) Positive tourism network attention has a “U-shaped” influence on regional tourism development. (2) Positive tourism network attention significantly promotes tourism development of both local and neighboring areas, while negative tourism network attention both hinders local tourism development and adversely affects neighboring areas via spillover effects. (3) Multiple paths for tourism development exist in the region, including four modes: Demand-facility driven, demand-resource-facility-transportation driven, word of mouth-transportation driven, and traffic-resource driven. Using the YRD as a case study, this research offers empirical evidence and theoretical insights into how positive and negative tourism network attention influence tourism development in the region.

Cite this article

WANG Yuewei , DI Jiao , CHEN Hang , AN Lidan . Exploring the Influence of Tourism Network Attention on the Development of Tourism in the Yangtze River Delta: A Spatial Analysis[J]. Journal of Resources and Ecology, 2025 , 16(4) : 1103 -1115 . DOI: 10.5814/j.issn.1674-764x.2025.04.015

1 Introduction

Society has entered the era of an attentional economy. Network attention is a reflection of netizens’ preference for information in cyberspace, and its value can also be an important indicator to measure the influence of a certain theme (Luo et al. 2024). Tourists collect relevant information about tourist destinations through the Internet before making decisions, indicating that network attention, as a potential tourism demand, has a precursor effect on tourist flow (Yang et al., 2015; Sun et al., 2019). Additionally, researchers usually divide online tourism information into positive and negative forms according to the predominant information tone (Casaló et al., 2015). Scholars have found that both positive and negative reviews can improve the popularity of hotels. However, positive reviews can enhance consumer perceptions of hotels (Vermeulen and Seegers, 2009), and negative word-of-mouth can influence decisions made by consumers (Chevalier and Mayzlin, 2006; Papathanassis and Knolle, 2011). Therefore, this study divides network attention into positive and negative tourism network attention. Furthermore, this study incorporates positive and negative tourism network attention into a framework of tourism development determinants and offers a thorough understanding of this essential concept through detailed mathematical and statistical analysis.
The spatial spillover effect of tourism economic activities means that the tourism development level of a region is affected by the tourism activities of neighboring regions. The positive spillover effect shows that the tourism development between regions is mutually supportive or complementary, while the negative spillover effect can reflect the strong competition between destinations (Kim et al., 2022). Neighboring scenic spots within a limited range provide heterogeneous tourism attractions, allowing tourists to pursue the optimization of tourism utility by visiting other scenic spots adjacent to the destination. Tourists trigger such spatial connection through displacement, which is one of the important reasons for the existence of spatial spillover effect (Wu and Zeng, 2024; Pan et al., 2025). Sun et al. (2018) used the number of Baidu news reports to represent the attention paid to media reports, explored its direct and spillover effects on Chinese tourism industry, and found that media reports, as information intermediaries, played a key role in improving the image of tourist destinations and promoting regional tourism development. Based on 31 provinces and cities in China, Zhang and Huang (2021) examined the influence of network attention on tourism growth and proposed that it would have an influence on related regions under the impact of rivalry. Ruan and Zhang (2021) combined the Baidu Index to study the function of disseminating tourism information in local economic ties and its spatial effect and explored the best path to strengthen regional tourism economic relations using a fuzzy set qualitative method.
However, four research gaps remain in the literature. First, scholars have considered the impact of network attention on regional tourism based on a positive perspective, and few scholars have included negative network attention in their research. Second, scholars have focused more on the spatial heterogeneity of network attention itself and lacked in-depth consideration of the non-linear impact of network attention on regional tourism development and its spatial effects. Third, few studies have investigated which factors, in conjunction with network attention, influence regional tourism development, and group path analyses that contrast the two outcomes that produce high versus low tourism development levels. Fourth, previous studies mostly focused on macro perspectives, such as the effect of information flow and network attention on tourism development at the national and provincial levels (Wang et al., 2019; Zhang and Huang, 2021; Chen et al., 2022), while studies based on regional meso perspectives, such as the Yangtze River Delta (YRD), are somewhat insufficient. Therefore, this study focuses on the following questions: 1) Are there non-linear characteristics of the impact of positive tourism network attention on regional tourism development? 2) Are there spatial spillover effects of positive and negative tourism network attention on regional tourism development? If spatial spillover effects are significant, what is the difference? 3) What paths can network attention use to affect regional tourism development? Addressing these three questions significantly enhances the contribution of this study beyond merely quantifying tourism network attention. By incorporating both positive and negative tourism network attention, this study proposes a comprehensive theoretical framework to examine their combined impact on regional tourism development. In-depth research on this topic aims to provide tourism planners and destination managers with evidence-based and practical insights to foster sustainable regional tourism development. The methods and findings of this study hold considerable theoretical and practical significance for policymakers, scholars, and industry practitioners in the realm of travel and hospitality.

2 Methodology

2.1 Study area

YRD urban agglomeration, comprising 26 cities, is a highly developed region in China’s tourism industry. The use of tourists’ search traces, forwarding, comments, likes, and other information related to YRD tourism attention to build the tourism image of the YRD is not only conducive to the sustainable development of regional tourism but also to improving regional development of soft power. Recently, the YRD has experienced close tourism interactions and communication, and regional tourism cooperation has formed a relatively solid foundation. This is a typical example of the impact of network attention on tourism development.

2.2 Empirical analysis methods

2.2.1 Baseline regression

To investigate the effect of network attention on tourism development, this study first adopts a linear regression model for analysis. We formulate the panel regression model as follows:
lnTDLit=a0+a1PTNA+α2NTNA+a3xit+ui+γt+εit
where TDLit represents the tourism development level of city i in year t; PTNA represents positive tourism network attention; NTNA represents negative tourism network attention; a0 refers to a constant; a1 represents the estimated coefficient of positive tourism network attention; α2 is the estimated coefficient of negative tourism network attention; α3 is the coefficient of the control variable; xit represents a series of control variables; ui, γt, and εit represent the regional fixed effect, time fixed effect, and random error terms, respectively.

2.2.2 Threshold model

Threshold model is an econometric model applied to the study of the effect of a sudden change in economic parameters on an explained variable. The model is constructed as follows:

lnTDLit=β0+β1PTNA×IPTNAZ1+β2PTNA×IZ1PTNAZ2++

βmPTNA×IPTNA>Zm+βxit+ui+γt+εit

where I(∙) is represented by an indicative function; βm represents the estimated coefficient of the core explanatory variable under different threshold levels; Zm is the threshold value; βm is the coefficient of the control variable; and PTNA is also treated as a threshold variable while representing the core explanatory variable, and the rest are the same as above.

2.2.3 Spatial metrology model

In this study, after the Moran index and LM tests of the data, the spatial lag model (SLM) is finally selected, and the model structure is as follows:
lnTDLit=a+ρj=1NWijlnTDLjt+β1PTNAit+β2NTNAit+β3xit+ui+γt+εit
where Wij is a normalized n×n dimensional spatial weight matrix of i rows and j columns, and the economic distance matrix is used in this study (Pietrzak, 2010); ρ is the spatial lag coefficient of tourism development level; j=1NWijlnTDLjt is the spatial lag term of tourism development level, representing the spatial interaction between tourism development level of province i and tourism development level of province j in period t; β is the estimated coefficient of explanatory variable.

2.2.4 fsQCA

The variables in this study are continuous, and the fuzzy set (i.e., fsQCA), which is divided into membership degrees with fractional values between 0 and 1, is more suitable for this study’s research (He et al., 2024). Therefore, this method is used to study the optimal path combinations affecting the development of regional tourism. Interpretation parameters are determined based on consistency and coverage.
(1) Consistency
Consistency is used to test whether the combination of factors constitutes a causal relationship with the results and to judge whether the variable is a sufficient condition for the interpretation of the results. The value is typically required to be greater than 0.75 (Zhang and Liu, 2021), and is calculated as follows (Farrugia, 2019):
Consistency(XiYi)=minXi,YiXi
where Xi represents the membership degree of the antecedent condition; Yi represents the membership degree of the result set; and i represents the antecedent condition.
(2) Coverage rate
The coverage rate is used to judge the explanatory power of the causal path formed by different variable combinations; the greater the coverage rate, the more powerful the explanatory capability. It can be expressed by the following formula (Capatina et al., 2018):
CoverageXiYi=minXi,YiYi

2.3 Indicator construction and description

(1) Explained variable. The most straightforward statistical indicators for the level of tourism development are tourism revenue and tourist numbers. Referring to the study of Ma et al. (2023), and using the entropy method, we assess the level of tourism development. It can be expressed by the following formula:
TDLi=j=12wjQij
where i denotes city; j denotes number of tourists or local tourism revenue; TDLi is the tourism development level of city i; wj is the weight of the number of tourists or local tourism revenue in city i; and Qij is the number of tourists or local tourism revenue in city i.
(2) Core explanatory variables. Positive and negative tourism network attention. The positive tourism network attention is represented by the Baidu index of the keyword search volume of “city name + tourism”, while the negative tourism network attention is represented by the Baidu index of the search volume of “city name + tourism complaints”. This study examines the regional network attention of 26 cities in the YRD. The detailed procedure is as follows: for example, if located in Shanghai, search the keyword “Hangzhou tourism”, and get the positive tourism network attention from Shanghai to Hangzhou, and change the cities to obtain the final data. Negative tourism network attention operations are the same.
(3) Control variables. According to scholars’ research results on factors affecting tourism development (Yang et al., 2017; Eleftheriou and Sambracos, 2019; Ruan and Zhang, 2021; Zhang and Huang, 2021; Chen et al., 2023; Wang et al., 2023), the control variables selected in this study are as follows: 1) Regional economic development level (REL). The GDP per capita of a city is chosen as a representative measure. 2) Tourism resource endowment (TRE), choose scenic spots rated 4A and above in the region, of which 4A scenic spots are divided into 4, and 5 A-level scenic spots are divided into 5, with grade weighted scoring. 3) Tourism fixed asset investment (INV): Select the representation of regional fixed asset investment multiplied by tourism proportion (tourism proportion = total tourism income/gross national product). 4) The ratio of tertiary industry added value to secondary industry added value can serve as an indicator of the sophistication of the industrial structure. This study calls it the advanced degree of industrial structure (AIS). 5) Information level (IL), represented by the number of people using the Internet. 6) Transportation accessibility (TA): the index is selected to choose the number of public buses per 10000 people. The variables and their respective indicators are described in Table 1.
Table 1 Description of variables and measurement indicators
Variable type Variable name Measurement index (Unit)
Explained variable Tourism development level (TDL) Composite Index

Core explanatory variable
Positive tourism network attention (PTNA) Baidu Index (104 individuals)
Negative tourism network attention (NTNA) Baidu Index (104 individuals)
Regional economic development level (REL) GDP per capita (ten thousand yuan)
Tourism resources endowment (TRE) 4A and 5A scenic spots weighted scores
Control variable Tourism fixed asset investment (INV) Proportion of tourism×Investment in fixed assets (million yuan)
Advanced degree of industrial structure (AIS) Value added of tertiary industry/Value added of secondary industry
Informatization level (IL) Internet users (ten thousand households)
Traffic accessibility (TA) Number of public buses per 10000 people (vehicles)

2.4 Data sources

Data from the China City Statistical Yearbook from 2012 to 2022 is utilized, the prefecture-level statistical bulletin, and the Baidu Index’s official website (https://index.baidu.com/v2/index.html) to obtain 26 cities with a total of 286 samples from 2011 to 2021. A few missing data were supplemented by linear interpolation. To eliminate heteroscedasticity and dimensional influence, TDL, REL and TA are treated with logarithms.

3 Results

3.1 Results of baseline regression and threshold model

Regarding the reliability of the empirical results, the calculated univariate variance inflation factor values are all less than 10. This shows that there is no multicollinearity problem. Models (1) through (5) in Table 2 present the regression results under the panel threshold model, ordinary least squares regression, time fixed effects, individual fixed effects, and time individual double fixed effects, respectively. The benchmark regression results in Table 2 show that when the control variables are added, the influence coefficients of PTNA on tourism development are all positive, showing strong significance, indicating that positive tourism network attention exerts a considerable promotional influence on tourism development. However, the coefficients of NTNA are all negative and significant at 5% or less, indicating that negative tourism network attention hampers the growth of local tourism. The significance of NTNA remains unchanged after changing the model, indicating that the results are robust to a certain extent. The three control variables of TRE, INV, and AIS show clear significance.
Table 2 Regression results of baseline regression and threshold model
Variable (1) (2) (3) (4) (5)
PTNA 0.1147*** 0.077*** 0.077** 0.003
(0.233) (0.023) (0.035) (0.02)
PTNA≤1.954 ‒0.5936
(0.116)
1.954<PTNA<2.827 ‒0.914*
(0.47)
PTNA≥2.827 0.6739***
(0.182)
NTNA ‒0.5817** ‒1.3214*** ‒0.707*** ‒0.673** ‒0.49***
(0.216) (0.349) (0.158) (0.326) (0.107)
Controls Yes Yes Yes Yes Yes
Constant ‒3.8526*** ‒4.804*** ‒3.855*** ‒4.23*** ‒1.88
(0.265) (0.283) (0.688) (0.343) (1.166)
R2 0.5165 0.709 0.613 0.487 0.681

Note: ***, **, * indicate at 99%, 95%, 90% confidence level, respectively; The numbers in the parentheses are robust standard errors. The same below.

Based on the threshold model proposed by Hansen, this study takes the core explanatory variable, PTNA itself as the threshold variable, and adopts the bootstrap sampling method to set 300 samples for the threshold value test and estimation. The threshold values are shown in Table 3 and Appendix Figure 1. Both the single and double thresholds pass the 10% significance level test. This finding indicates that positive tourism network attention has a threshold effect. Combining the positive and negative coefficients and their significance, PTNA shows a U-shaped influence on tourism development. The second threshold value is the U-shaped inflection point, which plays a major role; the single threshold value is 19540 and the double threshold value is 28270. As shown in Model (1) in Table 2, when the PTNA value is less than 19540, the coefficient of influence on tourism development is -0.5936 and the significance is 0.116. The negative influence is weak and is not significant at the 10% level. When PTNA is between 19540 and 28270, its coefficient is ‒0.914 and is significant at the 10% level. This shows that in the development stage with relatively low levels of tourism support facilities, there is a mismatch between tourism undertaking capacity and tourism reception number. The resulting problems, such as poor tourism experience, environmental pollution (Ahmad and Ma, 2022), and social and cultural conflicts, are further aggravated and the regional tourism reputation deteriorates. Notably, when PTNA exceeds the threshold value of 28270, the coefficient changes from negative to positive with a value of 0.674 and is significant at the 1% level. This shows that positive tourism network attention has a positive impact on the regional tourism development level during this period. During this period, the local tourism sector achieved a new level of advancement. With continuous improvement of tourism support service facilities, the regional economic development level, and rapid development of tertiary industry, the industrial structure has gradually moved to a higher level, and the problem of mismatch between supply and demand has been effectively alleviated. With the increase in capital investment and the implementation of more tourism planning projects, tourism resources have become more fully developed. At this time, positive tourism network attention affects tourism development positively. As shown in Appendix Table 1, most cities crossed the threshold value and are on the right side of a U-shaped line. Yancheng, Yangzhou, Zhenjiang, Taizhou (Jiangsu), Huzhou, Wuhu, Zhoushan, Ma’anshan, Tongling, Anqing, Chuzhou, and Xuancheng crossed the second threshold value in terms of PTNA in 2012, 2013, and 2014. However, the PTNA of Chizhou is always at the left end of the U-shaped line and has not crossed the second threshold value, indicating that there exists a notable disparity in positive tourism network attention among cities. The low positive tourism network attention area is concentrated in most cities in northern Jiangsu and Anhui.
Table 3 Threshold value and significance test
Threshold variable Threshold number Threshold value F-value P-value 10% critical value 5% critical value 1% critical value
PTNA Single 1.954 22.1 0.0767 19.9445 25.9359 44.4209
Double 2.827 18.67 0.0833 0.0833 16.7382 36.5194

3.2 Endogeneity test

For microdata, the sources of endogeneity problems generally include three aspects: First, the existence of bi-directional causality between the explained variables and the explanatory variables; Second, important explanatory variables are omitted from the model; Third, there are measurement errors in the measurement or econometric methods of the variables. To address the above three potential sources of endogeneity, this study reduces the possible endogeneity problem by the following methods.

3.2.1 Mutual causality

Choosing appropriate instrumental variables is a common way to alleviate the problem of mutual causality. Two core explanatory variables, PTNA and NTNA, are included in this study. Therefore, two instrumental variables need to be constructed respectively, and the two-stage least square method (2sls) is used for estimation, and the two constraints of correlation and exogeneity are satisfied. First, the product of the first-order lag term and first-order difference term (iv1) of PTNA is constructed by referring to the research of Cheng et al. (2024) as the instrumental variable of PTNA. The reasons are as follows: On the one hand, the cross- multiplication of the two factors comprehensively considers the historical level and variation amplitude of PTNA, meeting the correlation conditions; On the other hand, the product of the two is mainly determined by the historical PTNA data, and has no direct correlation with the current tourism development level, which satisfies the exogenous conditions of instrumental variables. Second, topographic relief (iv2), an exogenous geographic variable, is selected as the instrumental variable of NTNA. The reasons are as follows: On the one hand, the area with high relief will have the advantage of unique tourism resources, and at the same time, the rough terrain and other factors will affect the tourist experience and lead to negative comments on the Internet, so there is a correlation hypothesis. On the other hand, topographic relief is a natural geographical feature independent of economic activities, which cannot directly affect the development level of regional tourism and meet the exogenous conditions. The test results are shown in Table 4. The Anderson LM of iv1 and iv2 is significant at the 1% level, the statistical value of Cragg-Donald Wald F is greater than the critical value of 10%, and the statistical value of Sargan is less than 0.01, indicating that the selected instrumental variables do not have problems of unidentifiable and weak instrumental variables. At the same time, the regression results of PTNA and NTNA in the second stage are significant, consistent with the positive and negative signs of the baseline regression results. Therefore, the research results are credible when considering the endogeneity problem.
Table 4 Instrumental variable results
Variables iv1 iv2
(1)
First stage
(2)
Second stage
(1)
First stage
(2)
Second stage
iv1 0.0410***
(4.92)
iv2 ‒0.3852***
(‒5.12)
PTNA 0.0717**
(2.04)
NTNA ‒1.6573***
(‒2.79)
Constant 5.0347*** ‒4.5915*** 0.0052 ‒2.1675***
(3.79) (‒14.78) (0.41) (‒16.63)
Controls Yes Yes Yes Yes
Anderson LM 22.776*** 24.610***
Cragg-Donald Wald F 24.195 26.173
Sargan 0.000 0.000
Observations 260 260 286 286

3.2.2 Missing variable

If factors affecting regional tourism development are omitted from the empirical model, these missing variables will be included in the random disturbance term, resulting in endogenous problems. With reference to relevant literatures, this study added regional education level (EDU) (Li et al., 2024), level of openness to the outside world (OPE) (Ma et al., 2023) and urbanization rate (UBR) (Ruan and Zhang 2021) as additional control variables. To reduce the possibility of endogenous problems caused by missing variables. The regression results are shown in Columns (1)-(3) of Table 5. With the addition of new variables, the results and significance of PTNA and NTNA have not changed greatly, and there is no serious problem of missing variables in the model.
Table 5 Missing variables and measurement error regression results
Variables (1) (2) (3) (4)
PTNA 0.026* 0.025* 0.028** 0.020**
(1.859) (1.812) (1.985) (2.088)
NTNA ‒0.577*** ‒0.576*** ‒0.599*** ‒0.384***
(‒4.232) (‒4.218) (‒4.367) (‒3.983)
REL ‒0.169 ‒0.179 ‒0.027 ‒0.163*
(‒1.241) (‒1.293) (‒0.153) (‒1.722)
TRE ‒0.003 ‒0.003 ‒0.003* 0.001
(‒1.577) (‒1.517) (‒1.698) (0.534)
INV 0.0003*** 0.0003*** 0.0003*** 0.0003***
(4.494) (4.498) (4.672) (6.423)
AIS 0.467*** 0.462*** 0.456*** 0.246**
(3.376) (3.319) (3.287) (2.500)
IL ‒0.001* ‒0.001* ‒0.001* ‒0.001***
(‒1.849) (‒1.897) (‒1.785) (‒3.389)
TA ‒0.016 ‒0.017 0.002 ‒0.049
(‒0.203) (‒0.222) (0.024) (‒0.887)
EDU ‒0.018 ‒0.018 ‒0.017
(‒1.472) (‒1.486) (‒1.396)
OPE ‒0.256 ‒0.055
(‒0.439) (‒0.091)
UBR ‒0.953
(‒1.427)
Constant ‒2.630*** ‒2.596*** ‒2.307*** ‒1.662***
(‒8.581) (‒8.200) (‒6.147) (‒9.059)
Year effect Yes Yes Yes Yes
City effect Yes Yes Yes Yes
N 286 286 286 286
R2 0.785 0.785 0.787 0.717
F 46.318 43.865 42.053 33.997

3.2.3 Measurement error

When constructing the explained variable reflecting the level of regional tourism development, this study adopts the entropy weight method to calculate the sum evaluation index of the total tourism income and the total number of tourists. In addition, some scholars believe that the ratio of gross tourism income to gross regional product is an important indicator reflecting the development level of urban tourism (Wu and Liang, 2023). Therefore, this study takes this variable as a substitute variable of the explained variable to conduct a regression again, to alleviate the endogenous problem caused by the measurement error of the variable. The results are shown in Column (4) of Table 5. By changing the measurement method of explained variables, PTNA is significantly positive at 5% level and NTNA is significantly negative at 1% level, indicating that the model has a certain robustness and small measurement error.

3.3 Results of the spatial econometric model

3.3.1 Spatial autocorrelation test and model selection

Before setting the model, it is imperative to conduct spatial autocorrelation tests on the TDL, PTNA, and NTNA in each region. The Moran’s I values are listed in Appendix Table 2. The global spatial autocorrelation index for each year is positive and passes the 1% significance level. This suggests that the variables have strong positive spatial correlations, and a spatial econometric model can be constructed for further estimation. Considering that it is closer to the actual development, this study uses a spatial economic distance matrix for the analysis. Because the spatial and time effects are nested in the spatial metrology model, LM and Robust LM tests are performed to determine whether to select the form of lag or error to avoid the interference of temporal and spatial factors in the regression results. The test results are listed in Appendix Table 3. Neither the LM-spatial error nor the Robust LM-spatial error exhibit significance, whereas both the LM-spatial lag and Robust LM-spatial lag statistics demonstrate significance at the 1% level. Hence, the spatial lag model (SLM) is the most appropriate model.
Models (6) to (9) in Table 6 are random effects, time fixed effects, individual fixed effects, and time-individual double fixed effects models under the spatial lag model, respectively. With reference to the studies of other scholars (Zhou and Guo, 2022; Wang et al., 2024), the goodness-of-fit (R2) and maximum likelihood value of the individual fixed effects in this study are significantly superior to those of other models, and its spatial coefficient is significant at the 1% level. Therefore, we believe that the individual fixed spatial lag model used in this study can better simulate the spatial effects of network attention on regional tourism development. Additionally, if the spatial lag coefficient ρ is significant, indicating the existence of spatial spillover effects, according to LeSage and Pace (2009) and Shao et al. (2016), it is also essential to break down the spillover effects into both direct and indirect impacts. The total effect of a factor on the development of tourism in the region is a direct effect, and it incorporates the spatial feedback effect, i.e., a change in a factor in the region will affect the level of tourism development in the neighbouring regions, and the growth of tourism in neighboring regions will subsequently influence the tourism sector within the region, creating a cyclical process; and the influence of a factor on the development of tourism in the neighbouring regions is an indirect effect. Considering space limitations, the following analysis focuses only on the individual fixed effects regression results.
Table 6 Results of random, time fixed, individual fixed and time individual double fixed under the spatial lag model
Variable (6) (7) (8) (9)
PTNA 0.06*** 0.099*** 0.045*** 0.003
NTNA ‒0.561** ‒1.41*** ‒0.546*** ‒0.491***
Controls Yes Yes Yes Yes
ρ 0.423*** ‒0.01 0.488*** ‒0.004
R2 0.529 0.458 0.532 0.078
Maximum likelihood value ‒166.8 ‒228.6 ‒109.7 ‒68.8
Sample size 286 286 286 286

3.3.2 Spatial effect result analysis

As shown in model (8) in Table 6, the spatial coefficient of the explained variable, at 0.488, demonstrates significance at the 1% level, confirming the findings of the spatial autocorrelation test mentioned earlier; That is, tourism development in the YRD exhibits spatial clustering characteristics, and enhancing the prosperity of tourism in this region facilitates the growth of tourism in adjacent areas. Intercity tourism cooperation has made remarkable progress in recent years. Shanghai, Nanjing, Suzhou, and Hangzhou are typical high-value areas, among which Shanghai has a strong tourism-gathering ability by virtue of famous scenic spots such as the Shanghai Bund, Yu Garden, Nanjing Road Pedestrian Street, and Tianzifang. Adjacent cities such as Wuxi, Yangzhou, Zhenjiang, Jiaxing, Huzhou, and Ningbo have shown medium and high levels of tourism development.
As illustrated in Table 7, the direct-effect coefficient of PTNA is 0.0483, and it is significant at the 1% level. This indicates that an increase in positive tourism network attention significantly enhances the region’s tourism development level. The spillover effect coefficient is 0.041, and it passes the 1% significance test. The direct effect is positive and significant, so is the indirect effect. The total effect reaches 0.09 and it is significant (below the 1% level). The empirical findings indicate that the integration strategy of the YRD has achieved remarkable results. With increasing attention from positive tourism networks, the spatial flow of factors such as human flow, material flow, and associated capital can significantly improve the tourism development level in surrounding areas.
Table 7 Decomposition of spatial hysteresis model effect
Variable Direct effect Indirect effect Total effect
PTNA 0.0483*** 0.041*** 0.09***
NTAT ‒0.59*** ‒0.512** ‒1.101***
Controls Yes Yes Yes
Negative tourism network attention has significantly hindered the development of regional tourism. This can be verified by its direct influence coefficient (‒0.59) and its significance level (below 1%). Psychological research has shown that negative information is often more diagnostic than positive information as bad news spreads far and widely (Skowronski and Carlston, 1989). In addition, the indirect effect coefficient is ‒0.512, and it is significant at the 1% level, indicating that negative tourism network attention has a negative spatial spillover effect on tourism development in adjacent areas. Both the direct and spatial spillover effects are negative, resulting in a total effect of ‒1.101, and it is significant at the 1% level. This suggests that tourism development in cities in the YRD has a strong correlation, showing trends of prosperity and loss.

3.4 fsQCA results analysis

Referring to previous research (Fiss, 2011), this study adopts the direct calibration method with 95% percentiles (full membership), 50% percentiles (cross points), and 5% (no membership at all) as anchor points for calibration. Because fsQCA cannot identify the data of the cross points, all the values of 0.5 after calibration are adjusted to 0.501 (Du and Yang, 2023).

3.4.1 Univariate necessity analysis

Before analyzing the conditional configuration, we first analyze the necessary univariate conditions. And this condition is deemed necessary when the consistency exceeds 0.9 (Shang et al., 2024). The fsQCA software (version 3.0) was used to test the necessary conditions for producing high and low levels of tourism development. Appendix Table 4 shows that no single condition constitutes the necessary condition for high levels of tourism development; therefore, a combination analysis of variables must be conducted. NTNA (0.909>0.9) and non-INV (0.929>0.9) are the necessary conditions for a low tourism development level, indicating that NTNA and non-INV are bottleneck conditions that restrict the development of regional tourism.

3.4.2 Adequacy analysis of conditional configuration

This study presents the fsQCA method to analyze the configuration paths that produce high and low levels of tourism development. Referring to Jia et al. (2024), the case frequency threshold, original consistency threshold, and parameter robustness index (PRI) consistency threshold were set to 1, 0.8, and 0.75, respectively, and nine paths were obtained. The consistency of the overall solutions for high and low tourism development levels is 0.97634 and 0.920716, respectively, both of which are above 0.75. This shows that the configuration results are reliable. The coverages of the overall solution are 0.688752 and 0.665221, respectively; that is, the two results of the configuration path covered 68.88% and 66.52% of cases, respectively, and the interpretation strength is good. The configuration path results for high and low tourism development levels are shown in Table 8.
Table 8 Conditional configuration results of high and low tourism development levels

3.4.2.1 Configuration analysis of high tourism development level

(1) Demand-facility driven (paths 1a and 1b). This model considers PTNA and INV as the core conditions, indicating that for some regions, the combination of these two conditions is the key factor driving the high-level development of regional tourism. The typical cities identified by route 1a and 1b are Jiaxing and Jinhua respectively. Among them, Jiaxing is famous for its ancient town resources (Wuzhen, Xitang and other well-known ancient towns) and red resources (Jiaxing South Lake is the birthplace of the Communist Party of China), and Wuzhen is the permanent venue for the World Internet Conference. In recent years, Jiaxing has fully combined the digital economy with the charm of the ancient town, holding cultural activities such as the Wuzhen Theater Festival and Xitang Hanfu Culture Week, which have attracted a large number of tourists and media attention. In addition, Jiaxing is located in the core area of the YRD, adjacent to Shanghai, Hangzhou and Suzhou, and has a good capacity to undertake industries, which provides a good basic condition for the investment and construction of tourism infrastructure. Jinhua is famous for its film and television resources (Hengdian World Studios is one of the world’s largest film and television filming bases) and trade and cultural resources (Yiwu Commodity Market enjoys the reputation of “world supermarket”), which attracts a lot of film and television lovers and tourists to punch the shopping card.
(2) Demand-resource-facility-traffic driven (path 2). This model considers PTNA, TRE, INV, and TA as the core conditions, supplemented by the REL and IL, non-NTNA, and other auxiliary conditions to achieve high-level development of regional tourism. This route is a typical model for high-level tourism development and represents cities such as Hangzhou, Nanjing, Suzhou, Ningbo, Shanghai, Wuxi, and Hefei. The representative cities of this route have the following characteristics: First, there are many high-level scenic spots and profound historical and cultural deposits. It is represented by West Lake in Hangzhou, Purple Mountain in Nanjing, Ming Xiaoling Mausoleum and other famous scenic spots. In addition, Suzhou has a long history of garden architecture and intangible cultural heritage such as Kunqu opera and Suzhou embroidery, and Shanghai's Shanghai style culture is extremely charming. Second, the consumption potential and strength of tourism leads the country. In 2023, the gross regional product (GDP) of Shanghai, Suzhou, Hangzhou, Nanjing, Ningbo, Wuxi and Hefei will rank among the top 10 in the YRD. Third, all are regional transportation hubs, highways, railway networks, airports and other transportation facilities are perfect, convenient transportation for the tourism development of these cities provides superior conditions. The representative cities in this mode have superior tourism resource endowments, complete tourism support facilities, convenient transportation, an advanced economic development, and a high degree of informatization. In addition to receiving highly positive tourism network attention and a good reputation, they can foster the prosperity and growth of tourism.
(3) Word of mouth-traffic driven (paths 3a and 3b). Configuration 3a indicates that a high level of tourism development can be achieved with non-NTNA, non-AIS and TA as the core conditions, and PTNA, REL, TRE, and IL as auxiliary conditions. Typical cities in this configuration are Ningbo and Shaoxing. Configuration 3b indicates that non-NTNA, non-AIS, and TA are the core conditions, while non-PTNA, REL, non-TRE, and non-IL are the auxiliary conditions for achieving high tourism development levels. This path represents Zhenjiang City. Ningbo, Shaoxing and Zhenjiang, for example, are inferior to Shanghai, Nanjing and Hangzhou in terms of economic development level and tourism resource endowment in the YRD. However, reasonable tourist carrying capacity and relatively high-quality tourist landscape can enable such cities to enjoy a certain amount of tourist flow while reducing negative online comments. This model shows that when a city lacks negative tourism network attention (i.e., it has a good tourism reputation) and high traffic accessibility, it can give full play to auxiliary advantages, such as positive tourism network attention, regional economic development level, and resource endowment; even if the regional industrial structure is relatively low, it can still drive high-level tourism development.
(4) Resource-traffic driven (path 4). Path 4 takes TRE and TA as core conditions, non-PTNA, NTNA, non-REL, INV, non-AIS, and non-IL as auxiliary conditions to achieve high-level development of regional tourism, and its representative city is Huzhou. The typical city identified by this path is Huzhou. From the perspective of tourism resources, Huzhou is located in the south bank of Taihu Lake with beautiful natural landscape. Moganshan Mountain is known as one of the four major summer resorts in China. The cultural landscape is rich. Nanxun ancient Town, as one of the six ancient towns in Jiangnan, has rivers and canals, well-preserved buildings of Ming and Qing dynasties, and a unique style of Jiangnan water town. Huzhou has always been known as “the home of silk, the capital of lake brush, and the hometown of painting and calligraphy”. From the perspective of traffic location conditions, Huzhou is located in the center of the YRD and is the common hinterland of Shanghai, Hangzhou and Ningbo. With the increasing improvement of transportation facilities, such as the Shanghai-Suzhou-Huzhou high-speed Railway and the Shangqiu- Hefei-Hangzhou high-speed Railway, the same-city effect between Huzhou and Shanghai, Hangzhou, Nanjing, and other big cities has become increasingly obvious. This model is different from the above other paths, just as “wine is not afraid of a deep alley”, that is, when a region has high-quality tourism resources and good traffic conditions, even if the temporary lack of flow effect, it will be driven by the integration of the YRD and the diversified needs of tourists, to achieve a high level of regional tourism development.

3.4.2.2 Configuration analysis of low tourism development level

The fsQCA method is based on the hypothesis of causal asymmetry; that is, the reasons for high and low results are different (Du and Jia, 2017). Therefore, the configuration of low tourism development levels must be analyzed, and three paths are obtained. Configurations 1a and 1b represent the absence of core conditions in terms of INV, AIS, and TA, indicating that these three conditions are the main reasons for the low level of regional tourism development. Path 1a includes NTNA, non-PTNA, non-REL, non-IL, and other auxiliary conditions, resulting in a low level of regional tourism development. Path 1b shows that the auxiliary condition causing a low level of regional tourism development is low tourism resource endowment. In this case, even if there is positive tourism network attention, a good regional economic development level, and an informatization level, the regional tourism development level remains low. The representative cities in Configurations 1a and 1b are mainly prefecture-level cities in Anhui and Jiangsu, including Xuancheng, Chuzhou, Ma’anshan, Taizhou (Jiangsu), Anqing, and Nantong. Configuration 2 considers TRE, INV, IL, and TA as the core conditions, while auxiliary conditions, such as PTNA and REL, are missing. Simultaneously, negative tourism network attention results in a low level of regional tourism development. The corresponding cities of Configuration 2 are Chuzhou, Ma’anshan, Taizhou (Jiangsu), and Tongling. In the analysis of low tourism development levels, tourism fixed asset investment and transportation accessibility are the core conditions that are commonly missing, which shows that the basic conditions of regional tourism development cannot be missing. The comparison between this conclusion and the above analysis results of high tourism development levels also verifies the causal asymmetry of the logic of fsQCA.

3.4.3 Robustness test

According to Du et al. (2022), when the actual interpretation results of the study do not change after a slight change in operation, they are regarded as robust. A robustness test can be performed by increasing the case frequency, adjusting the PRI consistency value, and replacing the calibration anchor points (Du et al., 2022). First, the original consistency threshold is increased from 0.8 to 0.85 and decreased to 0.75 respectively, and the reduced solution and the intermediate solution do not change. Second, the PRI consistency threshold is raised from 0.75 to 0.80 and lowered to 0.7, and the solution results are basically unchanged, including all the existing configurations. These tests demonstrate that the findings of this study are relatively robust.

4 Discussion and conclusions

4.1 Findings

The spatial econometric model confirms that positive tourism network attention has a significant positive impact on tourism development in the region, and it is consistent with the research conclusion of Ruan and Zhang (2021). This is because as positive tourism network attention in the region improves, the efficiency of transforming potential tourism demand into actual tourism behavior improves. Tourist spending at a destination can enhance the local tourism economy’s development level, thereby driving the growth of the entire tourism industry.
Negative tourism network attention damages the image of the tourist destination, improves the risk perception of tourists, and affects the willingness and loyalty of tourists to travel. This is consistent with the research conclusion of Zhang and Huang (2021). This is confirmed by its direct influence coefficient (‒0.59), and its significance level (significant at the 1% level). The indirect effect coefficient is ‒0.512, and it is significant at the 1% level. This fully shows that negative tourism network attention has inhibited the growth of tourism in adjacent areas, which differs from the conclusion of Zhang and Huang (2021). In Zhang and Huang (2021)’s study, negative information significantly boosts neighboring areas, which is mainly affected by competition within the region; when the tourism image of a place is damaged, tourists will turn to its neighboring areas. We believe that the reasons for the research differences are as follows: First, there are variations in the degree of regional integration. Zhang and Huang (2021)’s research area comprises 31 provinces and cities that exhibit negative information flow from a macro perspective. At the macro scale, the spatial correlation between a local area and its neighboring areas is not large, which may cause negative information to significantly promote tourism development in neighboring areas. However, this study covers 26 cities in the YRD, which belong to the meso perspective. The spatial correlation between cities and their neighboring areas is strong, and negative information spreads more under the effect of regional integration. Second, the degree of resource diversity differs. The tourism resource endowment of 31 provinces and cities in China differs greatly from the development of the regional tourism economy. Alternative competition among destinations is more intense, and the negative effect of image masking is obvious. Therefore, when there is negative public opinion in one place, tourists will choose their neighboring areas under the constraints of transportation, time, money, and other conditions, which boosts neighboring areas under the influence of competition.

4.2 Theoretical insights

The first and most important theoretical contribution is to integrate positive and negative tourism network attention into a framework to explore their impact on the development of tourism in the YRD. It deepens the content of information supply in Gunn’s (1972) tourism system theory, highlighting network attention as part of information supply.
The second theoretical contribution is to put forward the nonlinear influence of tourism network attention on regional tourism development. Although some scholars have studied regional tourism development by focusing on positive tourism network attention, such as individual search footprint of urban tourism information (Ruan and Zhang, 2021; Chen et al., 2022), it is still unknown whether its influence on regional tourism development has nonlinear characteristics. This study finds that the impact of positive tourism network attention on regional tourism development presents a “U-shaped” feature. With the increase of attention, the positive tourism network attention focuses on the impact of tourism development in most cities from negative to positive. This finding reveals the complex nonlinear relationship between network attention and tourism development, and enriches the existing theoretical research on network attention and tourism development.
The third theoretical contribution is to reveal the spillover effect of tourism network attention. The results show that the positive tourism network attention not only significantly promotes the local tourism development, but also has a positive impact on the neighboring region. However, negative tourism network attention also has obvious negative effects on regional tourism development, which not only inhibits the development of local tourism, but also has adverse effects on neighboring areas through spillover effects. This result emphasizes the dual impact of information flow on tourism flow and provides a new perspective for understanding the overall impact of information flow on tourism development in a region.
The fourth theoretical contribution is to provide a multi- path tourism development model for the YRD. Through the fsQCA method, this study identifies four models, including demand-facility driven, demand-resource-facility-traffic- driven, word-of-mouth traffic-driven and traffic-resource- driven. These models reveal how information influences tourism development through multiple paths and enrich path dependence analysis in tourism system theory.

4.3 Sustainability recommendations

First, research shows that positive tourism network attention has a threshold effect on tourism development. This also has the following implications for the development of regional tourism: First, for the cities with low network traffic that have not crossed the second threshold (Chizhou, Tongling, Ma’anshan, etc.), the priority for the growth of regional tourism is to fully tap the advantages of regional tourism resources, improve the tourism infrastructure construction and public service level that match the network traffic, and reduce the environmental pollution and social contradictions caused by the mismatch between supply and demand. For cities in high-value network traffic areas that have crossed the second threshold value (Shanghai, Nanjing, Suzhou, etc.), attention should be given to the influential role of core cities, improving the overall tourism reception capacity and comprehensive management efficiency of the region, and scientifically evaluating the carrying capacity of tourism attractions and facilities to avoid the regression of the regional tourism development level caused by the mismatch between supply and demand.
Second, grounded on the conclusion that positive tourism network attention affects local and neighboring tourism development, the government should strengthen the positive externality of the YRD integration policy on tourism development, tighten the cooperation bond of YRD cities, and take notice to the spillover effect of tourism development. Furthermore, they should help core cities radiate to southern Anhui and northern Jiangsu and other less developed tourism cities (Yancheng, Taizhou (Jiangsu), Chuzhou, Ma’anshan, Wuhu, Tongling, and Xuancheng), strengthen cross-regional tourism cooperation, improve their ability to connect with peripheral cities, encourage the flow of information, resources, culture and other factors between cities, and promote the interconnection of transportation facilities. Finally, they should aim to build a “tourism community” with neighboring cities to jointly enhance tourism competitiveness.
Third, the study confirms that negative tourism network attention will not only impede the region’s tourism development but also restrain the tourism growth in adjacent areas, considering the regional integration context. Therefore, the government should pay attention to network public opinion and actively establish a positive image of tourism destinations while simultaneously accelerating the construction of an information-sharing platform, monitoring the sharing and dissemination of negative information in real time, properly handling tourism complaints, timely intervention in crisis public relations, prevention of the spread of negative information, and striving to maintain the image of urban tourism.
Fourth, by examining the path of tourism development, we found that network attention (positive and non-negative tourism network attention) exists as the core condition of the four modes of high tourism development level. Negative attention to tourism network and non-tourism fixed asset investment are the necessary conditions for the low level of tourism development. Therefore, we believe that high positive tourism network attention, good market reputation, and perfect public support facilities and services are important driving forces in fostering the sustainable growth of tourism. In the Internet “+” era, the development of intelligent technology tourism products must be encouraged to provide accurate and intelligent tourism services, play the multiplier role of network traffic for the growth of regional tourism, and establish a good market reputation. In the Internet “+” era, the government and enterprises must encourage the development of intelligent technology tourism products, and provide accurate and intelligent tourism services for tourists. Only the multiplier function of network traffic can promote the sustainable development of regional tourism. Simultaneously, the government should clearly establish the strategic goal of tourism as a pillar industry. The government should not only pay attention to the investment in tourism supporting infrastructure and promote the flow of factors to the tertiary industry, but also make overall planning and guide the exchanges and cooperation between cities.

4.4 Research limitations

First, there are various methods to collect research data on tourism network attention. This study uses the Baidu Index as the source for analysis, and there are many sources such as the Weibo index, TikTok, and Xiaohongshu text that can further enrich research. Second, this study focuses on the impact of network attention on tourism development in the YRD city cluster, which can be further compared with other city clusters such as Beijing-Tianjin-Hebei and the Pearl River Delta to explore whether there are similar path combinations among city clusters and provide new ideas for promoting regional tourism development cooperation models. Third, missing variables are inevitable in the regression model. In the future, we can conduct deeper research that fully considers the influence of all factors for further refinement of the research methodology.

4.5 Conclusions

Taking the cities in the YRD as the research area, this study divides tourism network attention into positive and negative tourism network attention and further discusses the spatial effect and configuration path of network attention on regional tourism development. The main conclusions of this study are as follows: 1) Baseline regression confirms that positive tourism network attention has a positive impact on the development level of regional tourism, whereas negative tourism network attention significantly inhibits regional tourism development. The panel threshold test shows that positive tourism network attention has a U-shaped impact on regional tourism development. At present, most cities have crossed the threshold value and are at the right end of the U-shaped line. With improvements in positive tourism network attention, they can effectively fostering the sustainable growth of tourism. 2) The tourism network attention towards the YRD urban agglomeration has a spatial spillover effect on tourism development. Overall, tourism development in this region has a positive spillover effect on neighboring regions. From the analysis of positive and negative attributes of information, positive tourism network attention in the region has a substantial positive impact on both local and adjacent areas, while negative tourism network attention has a significant inhibiting effect on local and adjacent areas. It is inferred that the cooperative effect of tourism development is dominant. 3) The qualitative method of fuzzy sets explored a combination of paths that produce the two outcomes of high and low tourism development levels. High tourism development levels include four types: demand-facility driven, demand-resource-facility-transport driven, word of mouth-transport driven, and resource-transport driven. Among these, positive tourism network attention, tourism fixed asset investment, tourism resource endowment, and transportation accessibility are the key driving factors for achieving high tourism development levels. In the analysis of low tourism development levels, tourism fixed asset investment and traffic accessibility are the core conditions of common deficiency. Traffic accessibility and informatization levels are also important reasons for low development of regional tourism.
[1]
Ahmad N, Ma X J. 2022. How does tourism development affect environmental pollution? Tourism Economics, 28(6): 1453-1479.

[2]
Capatina A, Micu A, Micu A E, et al. 2018. Country-based comparison of accommodation brands in social media: An fsQCA approach. Journal of Business Research, 89: 235-242.

[3]
Casaló L V, Flavián C, Guinalíu M, et al. 2015. Avoiding the dark side of positive online consumer reviews: Enhancing reviews’ usefulness for high risk-averse travelers. Journal of Business Research, 68(9): 1829-1835.

[4]
Chen X H, Li Y Y, Wang Y J, et al. 2022. Internet celebrity city, flow effect and tourism development. Journal of Management Sciences in China, 25(1): 1-22. (in Chinese)

[5]
Chen X J, Huang Y, Chen Y S. 2023. Spatial pattern evolution and influencing factors of tourism flow in the Chengdu-Chongqing Economic Circle in China. ISPRS International Journal of Geo-Information, 12(3): 121. DOI: 10.3390/IJGI12030121.

[6]
Cheng Z S, Zhao X Q, Liu L P. 2024. Can digital inclusive finance promote the construction of a strong trading nation? Finance and Trade Research, 35(11): 43-55. (in Chinese)

[7]
Chevalier J A, Mayzlin D. 2006. The effect of word of mouth on sales: Online book reviews. Journal of Marketing Research, 43(3): 345-354.

[8]
Du B G, Yang B X. 2023. The impact of S&T resource allocation on economic growth new impetus: Qualitative comparative analysis of longitudinal fuzzy sets of 31 provinces. Soft Science, 37(10): 16-24. (in Chinese)

[9]
Du Y Z, Jia L D. 2017. Configuration perspective and qualitative comparative analysis (QCA): A new path in management research. Journal of Management World, 33(6): 155-167. (in Chinese)

[10]
Du Y Z, Liu Q C, Chen K W, et al. 2022. Ecosystem of doing business, total factor productivity and multiple patterns of high-quality development of Chinese cities: A configuration analysis based on complex systems view. Journal of Management World, 38(9): 127-145. (in Chinese)

[11]
Eleftheriou K, Sambracos E. 2019. Tourism-growth nexus and spatial spillovers: Evidence from Greece. Tourism Economics, 25(2): 297-302.

DOI

[12]
Farrugia B. 2019. WASP (write a scientific paper): An introduction to set-theoretic methods and qualitative comparative analysis. Early Human Development, 133: 43-47.

DOI PMID

[13]
Fiss P C. 2011. Building better causal theories: A fuzzy set approach to typologies in organization research. Academy of Management Journal. 54(2): 393-420.

[14]
Gunn C. 1972. Vacationscape: Designing tourist regions. Austin, USA: University of Texas.

[15]
He H H, Zhang Z H, Ding R J, et al. 2024. Multi-driving paths for the coupling coordinated development of agricultural carbon emission reduction and sequestration and food security: A configurational analysis based on dynamic fsQCA. Ecological Indicators, 160: 111875. DOI: 10.1016/j.ecolind.2024.111875.

[16]
Jia J B, Xu Y S, Li W L. 2024. A study on the strategic momentum of SMEs’ digital transformation: Evidence from China. Technological Forecasting and Social Change, 200: 123038. DOI: 10.1016/j.techfore.2023.123038.

[17]
Kim Y R, Liu A Y, Jason Stienmetz, et al. 2022. Visitor flow spillover effects on attraction demand: A spatial econometric model with multisource data. Tourism Management, 88: 104432. DOI: 10.1016/j.tour man.2021.104432.

[18]
LeSage J, Pace R K. 2009. Introduction to spatial econometrics. Carabas, USA: CRC Press.

[19]
Li D H, Xie Z Z, Fang Y L. 2024. Research on the influencing factors of network attention of scenic spots based on HLM Model: Taking 1020 scenic spots of 51 cities in China as an example. Tourism Science, online first. DOI: 10.16323/j.cnki.lykx.20240513.001. (in Chinese)

[20]
Luo W L, Bian H Y, Wang J, et al. 2024. Spatial difference and influencing factors of network attention of red scenic spots in China from the perspective of short videos. Geographical Research, 43(12): 3327-3349. (in Chinese)

[21]
Ma X B, Zhang J H, Zhou L Y, et al. 2023. Spatial and temporal identification and mechanism analysis of the allometric relationship between regional economy and tourism scale in Yangtze River Delta. Geographical Research, 42(11): 2984-3002. (in Chinese)

[22]
Pan M Q, Liao Z X, Wang Z Y, et al. 2025. Tourism forecasting: A dynamic spatiotemporal model. Annals of Tourism Research, 110: 103871. DOI: 10.1016/j.annals.2024.103871.

[23]
Papathanassis A, Knolle F. 2011. Exploring the adoption and processing of online holiday reviews: A grounded theory approach. Tourism Management, 32(2): 215-224.

[24]
Pietrzak M B. 2010. Two-stage procedure of building a spatial weight matrix with the consideration of economic distance. Oeconomia Copernicana, 1(1): 65-78.

[25]
Ruan W Q, Zhang S N. 2021. Can tourism information flow enhance regional tourism economic linkages? Journal of Hospitality and Tourism Management, 49: 614-623.

[26]
Shang M, Jia C J, Zhong L L, et al. 2024. What determines the performance of digital transformation in manufacturing enterprises? A study on the linkage effects based on fsQCA method. Journal of Cleaner Production, 450: 141856. DOI: 10.1016/J.JCLEPRO.2024.141856.

[27]
Shao S, Li X, Cao J H, et al. 2016. China’s economic policy choices for governing smog pollution based on spatial spillover effects. Economic Research Journal, 51(9): 73-88. (in Chinese)

[28]
Skowronski J J, Carlston D E. 1989. Negativity and extremity biases in impression formation: A review of explanations. Psychological Bulletin, 105(1): 131-142.

[29]
Sun S, Wei Y, Tsui K L, et al. 2019. Forecasting tourist arrivals with machine learning and internet search index. Tourism Management, 70: 1-10.

[30]
Sun X L, Lin B S, Gao J, et al. 2018. Media coverage, tourism growth, and spatial spillover: Evidence from China. Tourism Analysis, 23(4): 503-515.

[31]
Vermeulen I E, Seegers D. 2009. Tried and tested: The impact of online hotel reviews on consumer consideration. Tourism Management, 30(1): 123-127.

[32]
Wang J W, Wang Q X, Feng L. 2024. Direct and spillover effects of tourism development on common prosperity. Acta Geographica Sinica, 79(4): 1045-1067. (in Chinese)

DOI

[33]
Wang K, Tan J X, Gan C. 2023. Degree of synergy of regional tourism development and urban-rural integration and influencing factors in the Western Hunan region. Progress in Geography, 42(8): 1468-1485. (in Chinese)

DOI

[34]
Wang L J, Zeng G J, Bi D D. 2019. Spatial spillover effects of ICT on tourism industry growth. Acta Geographica Sinica, 74(2): 366-378. (in Chinese)

DOI

[35]
Wu X D, Zeng C. 2024. Media practice and theoretical logic of creating differentiated space tourism brands—An example of Harbin of Heilongjiang Province. Journal of Shenyang Normal University (Social Science Edition), 48(5): 83-88. (in Chinese)

[36]
Wu X Y, Liang X C. 2023. Tourism development level and tourism eco-efficiency: Exploring the role of environmental regulations in sustainable development. Sustainable Development, 31(4): 2863-2873.

[37]
Yang X, Pan B, Evans J A, et al. 2015. Forecasting Chinese tourist volume with search engine data. Tourism Management, 46: 386-397.

[38]
Yang Y, Fik T J, Zhang H L, et al. 2017. Designing a tourism spillover index based on multidestination travel. Journal of Travel Research, 56(3): 317-333.

[39]
Zhang M, Huang L Y. 2021. Tourism development and public attention to negative online information: Based on the spatial correlations of tourism demand. Tourism Tribune, 36(7): 81-91. (in Chinese)

[40]
Zhang Y G, Liu L. 2021. Research on the influencing factors of national identity of red tourism resource destination from the perspective of configuration and multiple paths: Based on the fuzzy-set qualitative comparative analysis. Journal of Natural Resources, 36(7): 1658-1672. (in Chinese)

[41]
Zhou W, Guo J H. 2022. Comparison of participation and status of international division of labor in China’s manufacturing industry based on global value chain adjustment. Statistic & Decision, 38(3): 113-118. (in Chinese)

Outlines

/