
Journal of Resources and Ecology >
The Coupling Coordinated Relationship between High-quality Tourism Development and Common Prosperity in the Yellow River Basin
|
WANG Ziyan, E-mail: wzyyyyyy0906@163.com |
Received date: 2024-09-02
Accepted date: 2025-01-10
Online published: 2025-08-05
Supported by
The Shanxi Province Philosophy and Social Science Planning Project(2023YJ082)
The Teaching Reform Project of Graduate Education in Shanxi Province(2024JG117)
The Special Project for Science and Technology Strategy Research of Shanxi Province(202404030401151)
The Fujian Social Science Fund Project(FJ2025C170)
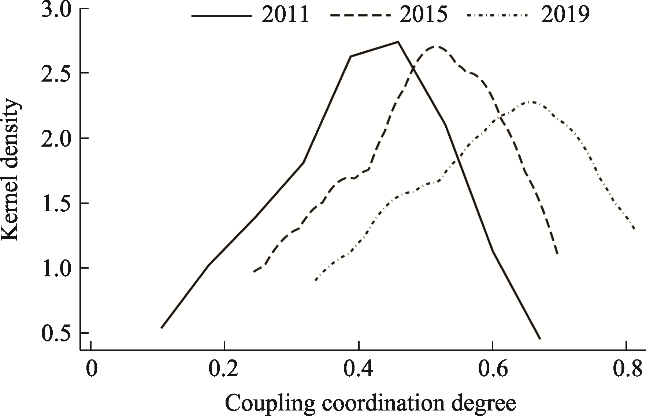
This study explores the coordination mechanism between high-quality development and common prosperity in the tourism sector. Using methods such as the entropy weight TOPSIS method, coupling coordination model, kernel density, Dagum Gini coefficient, and decomposition analysis, the study empirically examines the spatio-temporal evolution of the coupled and coordinated relationship between high-quality tourism development and common prosperity in the Yellow River Basin from 2011 to 2019. The results show that both the levels of high-quality development and common prosperity in tourism increased during the research period, with common prosperity generally outpacing high-quality tourism development. Both indicators exhibit notable spatial heterogeneity. The coupling and coordination between high-quality tourism development and common prosperity has steadily improved, with a lagging pattern in high-quality tourism development as the predominant type. Furthermore, kernel density analysis reveals that the coupling and coordination level between the two systems has increased, while regional disparities have diminished. The overall Gini coefficient of the coupling coordination degree between high-quality tourism development and common prosperity fluctuates downward, with regional differences identified as the primary source of variation
WANG Ziyan , NIU Liqin , CHENG Zhanhong . The Coupling Coordinated Relationship between High-quality Tourism Development and Common Prosperity in the Yellow River Basin[J]. Journal of Resources and Ecology, 2025 , 16(4) : 1089 -1102 . DOI: 10.5814/j.issn.1674-764x.2025.04.014
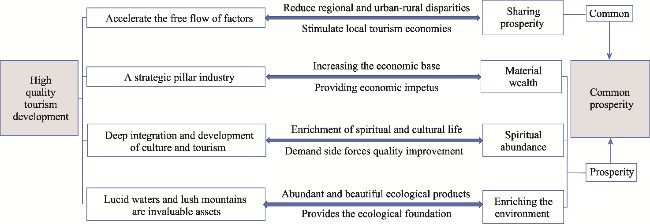
Figure 1 Mechanism of coupling and coordination between high-quality tourism development and common prosperity |
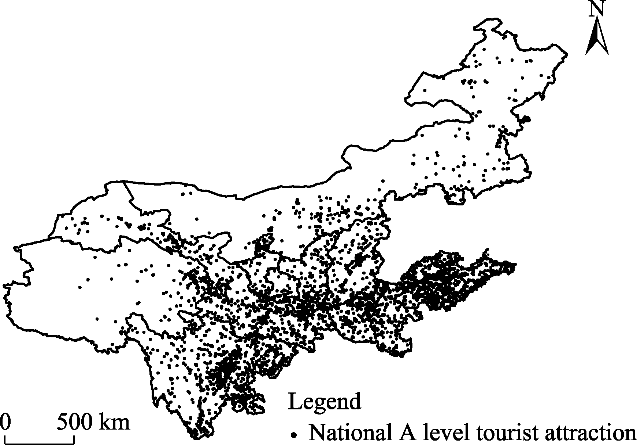
Figure 2 Schematic representation of the study area |
Table 1 Indicator system for evaluating the development level of high-quality tourism development and common prosperity |
| Subsystem | Target layer | Criterion layer | Specific indicators |
|---|---|---|---|
| High-quality development of tourism | Bigger level | The scale of the tourism industry | Domestic tourism revenue, domestic tourist arrivals, passenger turnover |
| Essential reception capacity | Number of star-rated hotels, business income, the number of travel agencies | ||
| Richness of tourism resources | Number of museums, the number of scenic spots above grade A | ||
| Better level | Innovation | Number of tourism colleges | |
| Coordinate | Coordinated development level of the tourism industry (proportion of the tourism industry in the tertiary industry) | ||
| Green | Level of environmental pollution control in the tourism industry (total tourism income/GDP×investment in environmental pollution) | ||
| Open | Regional reception for immigration overnight tourists, international tourism foreign exchange income | ||
| Share | Number of tourism employees, per capita tourism income by regions | ||
| Common prosperity | Common level | The sharing of prosperity | Level of Basic public service-medical and health care (health care pointed out as a proportion of GDP, number of medical and health institutions, number of beds in medical and health institutions per 1000 people, number of health technicians per 1000 people); The employment situation (number of people in employment, rate of registered unemployment in cities and towns); Elderly care (child and adolescent dependency ratio, elderly dependency ratio, total dependency ratio); Social security (social security expenditures as a share of GDP, local fiscal expenditures on housing security); Infrastructure construction (urban water supply penetration rate, number of public vehicles per 10000 people, Internet broadband access ports, Internet broadband access subscribers) |
| Differences in prosperity | Thiel index of urban-rural consumption gap, Thiel index of urban-rural income gap, urbanization rate | ||
| Prosperity level | Material prosperity | Income and consumption level (per capita disposable income of residents, per capita GDP, private car ownership, total retail sales of consumer goods) | |
| Spiritual prosperity | Level of education (number of students in higher education); cultural construction (financial investment in education per 100000 per capita, proportion of financial expenditure on culture and sports, number of museums) | ||
| Ecological prosperity | Ecological environment management (green coverage rate of built-up areas, per capita park green space area, proportion of energy conservation and environmental protection expenditure, forest coverage rate, harmless treatment rate of domestic garbage, number of public toilets per 10000 people) |
Table 2 Criteria for classifying stages of coupled development |
| Coupling degree rating | Coupling degree value (C) | Coupling development stage | Coupling degree rating | Coupling degree value (C) | Coupling development stage |
|---|---|---|---|---|---|
| 1 | C=0 | Disorderly development stage | 4 | 0.5<C≤0.8 | Running-in stage |
| 2 | 0<C≤0.3 | Low-level coupling stage | 5 | 0.8<C≤1 | High-level coupling stage |
| 3 | 0.3<C≤0.5 | Antagonistic stage |
Table 3 Classification criteria for the coupling coordination degree |
| Coupling coordination grade | Coupling coordination values (D) | Coupling coordination type | Coupling coordination grade | Coupling coordination value (D) | Coupling coordination type |
|---|---|---|---|---|---|
| 1 | [0, 0.100] | Extreme disorder | 6 | (0.500, 0.600] | Minimum coordination |
| 2 | (0.100, 0.200] | Severe disorder | 7 | (0.600, 0.700] | Primary coordination |
| 3 | (0.200, 0.300] | Moderate disorder | 8 | (0.700, 0.800] | Intermediate coordination |
| 4 | (0.300, 0.400] | Mild disorder | 9 | (0.800, 0.900] | Good coordination |
| 5 | (0.400, 0.500] | On the verge of disorder | 10 | (0.900, 1.000] | Quality coordination |
Table 4 Classification criteria for relative development |
| Coupling coordination value (D) | Maior type | Relative development index | Subtypes |
|---|---|---|---|
| [0, 0.500] | Disorder zone (M) | U(t)-U(c)>0.1 | Common prosperity development lag-type disorder (M1) |
| |U(t)-U(c)|≤0.1 | High-quality development of tourism and common prosperity development of co-loss type disorder (M2) | ||
| U(t)-U(c)<-0.1 | High-quality development of tourism lag-type disorder (M3) | ||
| (0.500, 0.800] | Transition zone (T) | U(t)-U(c)>0.1 | Common prosperity development lag-type transition (T1) |
| |U(t)-U(c)|≤0.1 | High-quality development of tourism and common prosperity co-development type transition (T2) | ||
| U(t)-U(c)<-0.1 | High-quality development of tourism lag-type transition (T3) | ||
| (0.800, 1.000] | Coordination zone (C) | U(t)-U(c)>0.1 | Common prosperity development lag-type coordination (C1) |
| |U(t)-U(c)|≤0.1 | High-quality development of tourism and common prosperity co-prosperity type coordination (C2) | ||
| U(t)-U(c)<-0.1 | High-quality development of tourism lag-type coordination (C3) |
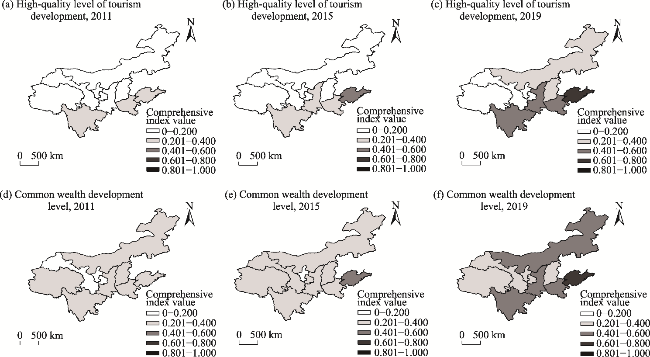
Figure 3 Spatio-temporal evolution of the comprehensive index of high-quality tourism development and common wealth development level in the Yellow River Basin |
Table 5 Coupling degree of high-quality development of tourism and common prosperity |
| Year | Shanxi | Shaanxi | Henan | Shandong | Qinghai | Sichuan | Gansu | Ningxia | Inner Mongolia |
|---|---|---|---|---|---|---|---|---|---|
| 2011 | 0.972 | 0.984 | 0.998 | 0.999 | 0.428 | 0.988 | 0.888 | 0.296 | 0.938 |
| 2012 | 0.979 | 0.988 | 0.998 | 1.000 | 0.450 | 0.992 | 0.893 | 0.348 | 0.938 |
| 2013 | 0.961 | 0.979 | 0.988 | 0.998 | 0.509 | 0.986 | 0.873 | 0.375 | 0.930 |
| 2014 | 0.959 | 0.986 | 0.985 | 0.999 | 0.571 | 0.991 | 0.886 | 0.392 | 0.935 |
| 2015 | 0.958 | 0.991 | 0.982 | 1.000 | 0.611 | 0.995 | 0.893 | 0.419 | 0.959 |
| 2016 | 0.979 | 1.000 | 0.986 | 1.000 | 0.635 | 0.995 | 0.889 | 0.460 | 0.967 |
| 2017 | 0.985 | 0.998 | 0.985 | 0.998 | 0.705 | 0.998 | 0.917 | 0.557 | 0.955 |
| 2018 | 0.989 | 0.999 | 0.979 | 0.999 | 0.704 | 0.991 | 0.930 | 0.539 | 0.964 |
| 2019 | 0.994 | 1.000 | 0.982 | 0.997 | 0.745 | 0.996 | 0.936 | 0.599 | 0.971 |
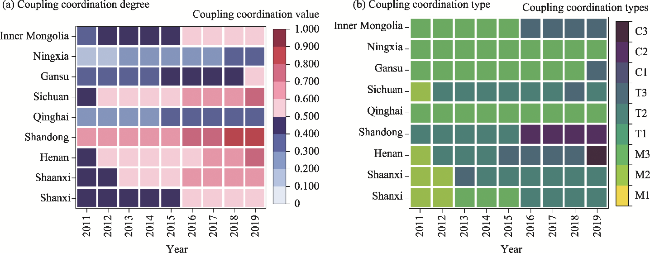
Figure 4 Coupling coordination index and sub-ypes of high-quality tourism development and common prosperity |
Figure 5 Kernel density analysis of coupling coordination degree between high-quality tourism development and common prosperity |
Table 6 Gini coefficient decomposition of the coupling and coordination level of high-quality development of tourism and common prosperity |
| Year | Overall Gini coefficient | Regional differences | Inter-regional differences | Contribution rate (%) | |||||||
|---|---|---|---|---|---|---|---|---|---|---|---|
| Upstream region | Downstream region | Midstream | Up- Down | Up- Middle | Middle- Down | Intra-regional difference | Inter-regional differences | Hyper-viscous density | |||
| 2011 | 0.178 | 0.192 | 0.052 | 0.032 | 0.256 | 0.173 | 0.118 | 30.157 | 65.941 | 3.902 | |
| 2012 | 0.175 | 0.192 | 0.054 | 0.035 | 0.251 | 0.174 | 0.109 | 30.683 | 65.117 | 4.200 | |
| 2013 | 0.163 | 0.180 | 0.052 | 0.037 | 0.230 | 0.163 | 0.095 | 31.703 | 63.129 | 5.168 | |
| 2014 | 0.162 | 0.176 | 0.052 | 0.046 | 0.227 | 0.158 | 0.103 | 31.869 | 61.892 | 6.240 | |
| 2015 | 0.156 | 0.170 | 0.052 | 0.051 | 0.215 | 0.152 | 0.103 | 32.520 | 60.501 | 6.979 | |
| 2016 | 0.157 | 0.171 | 0.047 | 0.048 | 0.220 | 0.160 | 0.091 | 31.770 | 63.043 | 5.186 | |
| 2017 | 0.151 | 0.155 | 0.056 | 0.046 | 0.216 | 0.141 | 0.115 | 31.079 | 61.353 | 7.568 | |
| 2018 | 0.155 | 0.161 | 0.051 | 0.033 | 0.224 | 0.144 | 0.116 | 30.503 | 63.510 | 5.986 | |
| 2019 | 0.142 | 0.154 | 0.037 | 0.029 | 0.201 | 0.143 | 0.090 | 31.395 | 61.427 | 7.178 | |
| Mean | 0.160 | 0.172 | 0.050 | 0.040 | 0.227 | 0.156 | 0.104 | 31.298 | 62.879 | 5.823 | |
| [1] |
|
| [2] |
|
| [3] |
|
| [4] |
|
| [5] |
|
| [6] |
|
| [7] |
|
| [8] |
|
| [9] |
|
| [10] |
|
| [11] |
|
| [12] |
|
| [13] |
|
| [14] |
|
| [15] |
|
| [16] |
|
| [17] |
|
| [18] |
|
| [19] |
|
| [20] |
|
| [21] |
|
| [22] |
|
| [23] |
|
| [24] |
|
| [25] |
|
| [26] |
|
| [27] |
|
| [28] |
|
| [29] |
|
| [30] |
|
| [31] |
|
| [32] |
|
| [33] |
|
| [34] |
|
| [35] |
|
| [36] |
|
| [37] |
|
| [38] |
|
| [39] |
|
| [40] |
|
| [41] |
|
| [42] |
|
| [43] |
|
| [44] |
|
| [45] |
|
| [46] |
|
| [47] |
|
| [48] |
|
| [49] |
|
| [50] |
|
| [51] |
|
| [52] |
|
| [53] |
|
| [54] |
|
| [55] |
|
| [56] |
|
| [57] |
|
| [58] |
|
| [59] |
|
| [60] |
|
| [61] |
|
| [62] |
|
| [63] |
|
| [64] |
|
/
| 〈 |
|
〉 |