Resource Environment and Green Development

Evaluation of Water Environment Carrying Capacity in the Shaanxi Section of the Wei River Based on a Comprehensive Index System

  • GAO Xukuo ,
  • DONG Zihan , *
Expand
  • College of Management, Xi’an University of Architecture and Technology, Xi’an 710055, China
*DONG Zihan, E-mail:

GAO Xukuo, E-mail:

Received date: 2024-07-02

  Accepted date: 2024-12-20

  Online published: 2025-08-05

Abstract

The Shaanxi section of the Weihe River Basin has undergone significant environmental changes in recent years, marked by pronounced spatiotemporal variations that pose substantial challenges for sustainable water resource management. Traditional evaluation methods often fall short in capturing the dynamic evolution and structural complexity of such systems. To address these limitations, this study adopts the Driving force-Pressure- State-Impact-Response-Management (DPSIRM) model, integrated with the coefficient of variation method, to comprehensively assess the Water Environmental Carrying Capacity (WECC) and its key influencing factors. Drawing on data from 41 districts and counties and employing Xi’an as a representative case study, the research reveals clear regional disparities and temporal trends in WECC. The results indicate an overall upward trend in carrying capacity, with upstream areas improving from Level III to Level I, middle reaches from Level IV to Level II, and downstream areas from Level V to Level III. The pressure and state subsystems were identified as having the most significant impact on WECC evolution. Meanwhile, indices associated with driving force, pressure, and management showed a rising trajectory, whereas state and response subsystems exhibited fluctuations. This study confirms the practicality and effectiveness of the DPSIRM framework in dynamically evaluating WECC, offering a robust scientific foundation for refined, region-specific water environment governance.

Cite this article

GAO Xukuo , DONG Zihan . Evaluation of Water Environment Carrying Capacity in the Shaanxi Section of the Wei River Based on a Comprehensive Index System[J]. Journal of Resources and Ecology, 2025 , 16(4) : 1027 -1038 . DOI: 10.5814/j.issn.1674-764x.2025.04.009

1 Introduction

Water resources are an indispensable and strategic asset, integral to the sustainable socioeconomic development and the preservation of ecological equilibrium. However, as the population grows rapidly, the ecological equilibrium also accelerates. However, with the rapid growth of population and accelerating socioeconomic advancement (Fan, 2023; Pan et al., 2023; Li et al., 2024), the challenges of water resources and the deteriorating ecological conditions adversely impact human society, limiting our capacity to thrive and develop. If humanity continues to exceed these critical thresholds, it will lead to a further decline in resources and environmental conditions, severely impeding the sustainable development of regional economies and societies. To tackle these growing issues, creating governance skills that focus on managing water resources based on the water environment carrying capacity (WECC) has become a crucial approach to dealing with the current water resource problems. WECC provides a scientific framework for evaluating the interplay between human socioeconomic endeavour and the aquatic ecosystem (Cui et al., 2019). The approach of comprehensive control, centred around WECC, emphasizes understanding the current state of water environmental carrying capacity and implements strategic management measures to enhance the sustainability of the water environment.
Overseas research into the water environment’s carrying capacity began much earlier, with a well-established history of theoretical exploration and methodological development. This research is often framed within the broader context of sustainable development theory (Hardin, 1986), and has evolved to include various approaches for understanding how water systems can sustainably support human activities. The concept of ecological carrying capacity was first introduced by Park in 1921 and it was further refined in the 1980s by UNESCO, who formalized the broader concept of resource-carrying capacity, WECC, as a specialized concept within the water resources domain, emerged as a direct application of these ideas (Peng et al., 2023). Subsequent studies have integrated WECC theories with water security issues, often incorporating the concept that “water determines population”. These studies have applied various methodologies, such as indicator system construction and system dynamics modelling (Ait-Aoudia and Berezowska-Azzag, 2016), to evaluate and forecast the water carrying capacity of different regions. In China, research into WECC evaluation began more recently, and its focus has been on developing evaluation systems and models based on indicator combinations, often drawing upon methods from diverse disciplines to explore new evaluation approaches. The evaluation methods for WECC can generally be categorized into two types. The first category quantifies WECC by referencing thresholds such as regional population figures, GDP, or the maximum allowable limit of a specific pollutant. For instance, Yang et al. utilized a system dynamics model to simulate population and GDP, employing the pressure-support interaction relationship to evaluate the water environment’s carrying capacity in Tieling City, Northeast China (Yang et al., 2015). Similarly, Dou et al. developed a simulation model that integrates water volume, COD, and socioeconomic input-output relationships to assess the water resource carrying capacity of Henan Province (Dou et al., 
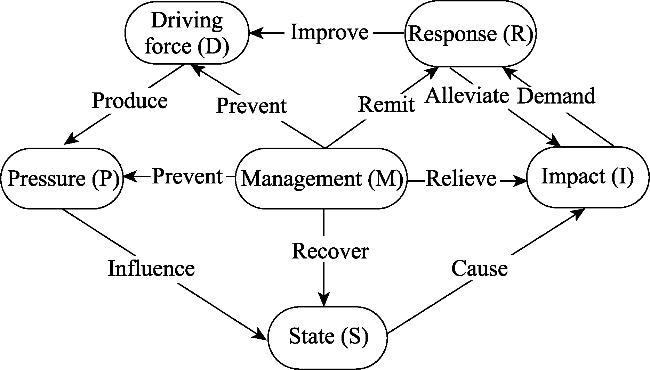
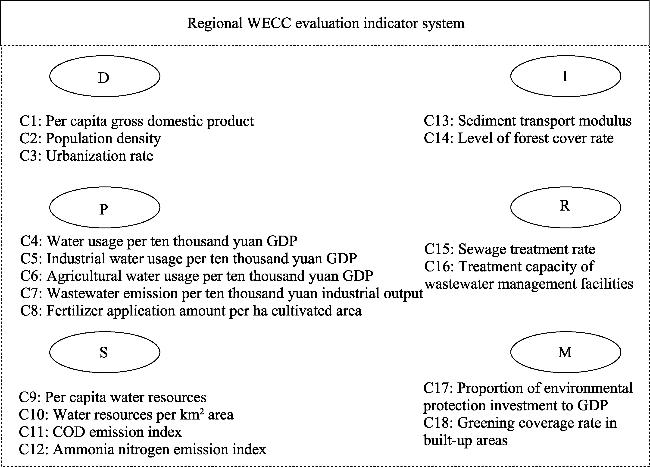
2015). The second type of method is the comprehensive indicator system, which constructs a structured set of evaluation indicators based on key influencing factors. This approach involves assigning quantitative weights to each indicator and aggregating them to assess the water environment’s carrying capacity. Common evaluation techniques within this framework include the system dynamics model, DPSIR model, TOPSIS entropy weighting method (Wen et al., 2023), multi-objective comprehensive analysis method, ecological footprint method, etc. These methods have been widely applied in various regional contexts. For example, researchers have employed them to conduct thorough evaluations of WECC in Gansu Province (Zong, 2021), the Xilin Gol League region of Inner Mongolia (Li et al., 2022), and Jilin Province (Wu et al., 2022b). In addition, Zhao et al. (2025) combined tools such as ArcGIS and VEST model with field surveys to assess the water environmental quality status of the middle reaches of the Jinsha River tributaries using a comprehensive evaluation method. Chen et al. (2019) applied principal component analysis (PCA) to investigate the relationships between evaluation indicators and water environmental quality, based on habitat assessments in the Three Gorges Reservoir area. Similarly, Lei et al. (2019)) employed correlation analysis to examine the associations between water quality, surrounding land use patterns, and aquatic biodiversity in their evaluation of the Yuan River Basin; Collectively, these studies highlight the progressive evolution of WECC research methods, offering valuable insights for improving regional water management and ecological sustainability (Wu et al., 2022a; Huang et al., 2023; Zhu et al., 2024).
The Weihe River Basin (Shaanxi section) is a multifunctional region that integrates industrial, agricultural, and residential functions, serving as a vital engine for the socioeconomic development of both Shaanxi Province and the broader Northwest China region. Strategically, it plays a pivotal role in sustaining regional ecological equilibrium (Song et al., 2015). However, the basin has long been afflicted by a suite of environmental challenges, most notably, water pollution, degraded embankment integrity, and a decline in riparian vegetation diversity, as a consequence of accelerated economic expansion and intensified anthropogenic activities. These issues have significantly constrained the sustainable development of the riverine ecosystem (Li et al., 2016). Against this backdrop, a comprehensive evaluation of the WECC and its underlying drivers in the Shaanxi section of the Weihe River Basin is both pressing and imperative. This study draws on panel data from 41 counties distributed along the mainstream of the basin's Shaanxi section and constructs a regional WECC evaluation indicator system based on the Driving force-Pressure-State-Impact- Response-Managment (DPSIRM) framework. By integrating a Management subsystem into the conventional DPSIR model, the DPSIRM framework enhances the capacity to capture the influence of governance and intervention strategies on environmental carrying capacity. This modification enables a more holistic and dynamic representation of the evolving characteristics of the regional water environment. To analyze spatiotemporal patterns, the coefficient of variation method is employed to assess changes in WECC across the 2010-2019 period. The study systematically evaluates discrepancies among the six subsystems— Driving Force, Pressure, State, Impact, Response, and Management—across both spatial and temporal dimensions. In doing so, it illuminates the underlying mechanisms by which different drivers and pressures manifest and interact in distinct local contexts. Furthermore, through the identification and analysis of key sensitive indicators, the research delivers targeted, evidence-based recommendations to inform and enhance regional water environment management and policy-making.

2 Methods and data

2.1 The evaluation indicator system based on the DPSIRM model

WECC emerges from the intricate interplay between natural water systems and human socioeconomic activities. To more effectively articulate the complex interplay between human activities and the water environment, this study introduces the DPSIRM model, an enhancement of the traditional Driving- force-Pressure-State-Impact-Response (DPSIR) model through the explicit integration of management factors. The refinement advances the analytical capacity of the model by facilitating a shift from reactive, post-event policy responses to proactive and preventive management strategies. It aligns with contemporary imperatives in water environmental governance that emphasize early intervention and long-term sustainability. By strengthening the systemic interlinkages and establishing a causal feedback loop, the DPSIRM model impacts of human activities on the water environment (Figure 1).
Figure 1 DPSIRM framework diagram
The internal logic of the DPSIRM model’s subsystems is as follows: The driving force subsystem reflects the fundamental influence of human activities on water resource systems. Economic growth and urbanization lead to increased water consumption, thereby placing mounting pressure on regional water environment carrying capacity. As a long-term driving force, the natural population growth rate reveals prospective trends in water demand and serves as a critical variablein forecasting future changes in capacity changes. The pressure indicators represent the direct burdens imposed by human activities on the water environment, including water consumption and pollutant emissions. Through the quantitative depiction of impacts generated by various industries and water-use activities, these indicators reveal the relationship between industrial structure and water resource pressure. This provides a basis for identifying primary pollution sources and management priorities. The state subsystem describes the current condition of the regional water environment, measuring water environment health and supply capacity. Within the DPSIRM framework, the indicators of this subsystem provide immediate insights into environmental conditions, emphasizing the resilience of aquatic ecosystems in assimilating pollutants and meeting water requirements. These metrics assist in pinpointing current water quality challenges and determining areas requiring enhancements. The impact subsystem assesses the ecological and economic consequences arising from changes in environmental state. Indicators such as sediment transport modulus and forest coverage reflect the implications of water environment alterations on regional ecological health and sustainable development. These measures emphasize the feedback relationship between human activities and ecosystems, illustrating the environmental risks induced by degradation of water resources. The response subsystem represents the reactive measures undertaken to address environmental pressures. Indicators such as wastewater treatment rate and capacity assess the region’s ability to mitigate pollution. These metrics guide timely interventions by governments and enterprises, and reflect the extent to which the water environment possesses self-recovery potential. As a forward-looking and preventive component, the management subsystem evaluates regional investments in environmental protection and ecological construction through indicators such as environmental protection investment and green coverage rate. These indicators demonstrate proactive human interventions in water environment management, supporting the long-term health of the water environment.
Based on this framework, this study conducts a systematic review of existing domestic and international WECC evaluation indicator systems. In accordance with the principle of independence, indicators exhibiting overlap, conflict, or redundancy were consolidated or eliminated to achieve an initial selection. Subsequently, in line with the principle of accessibility, indicators for which no reliable data could be obtained-based on extensive consultation of statistical yearbooks and other resources—were also eliminated. Ultimately, the evaluation indicators were classified into six categories—Driving Force (D), Pressure (P), State (S), Impact (I), Response (R), and Management (M)—according to the DPSIRM model’s factor descriptions. A three-layer top- down evaluation indicator system, as shown in Figure 2, was established.
Figure 2 The regional WECC evaluation indicator system
Reliability analysis represents a crucial procedure for evaluating the robustness and internal consistency of the constructed indicator system. To this end, Cronbach’s α coefficient—a widely recognized statistical method, is adopted to evaluate the reliability of the system. The formula for Cronbach’s α is as follows:
$\alpha=\frac{K}{K-1}\left(1-\frac{\sum_{i=1}^{n} S_{i}^{2}}{S_{x}^{2}}\right)$
In the formula,αrepresents the reliability coefficient;K denotes the total number of indicators in the system; Si2 represents the variance of the i-th indicator;Sx2 refers to the total variance of all indicators combined.

2.2 Grading standard

Scientifically and rationally classifying the levels of various indicators is crucial in accurately assessing the regional water environment safety conditions, significantly impacting the precision of the evaluation and mitigation assessments. This paper initially categorizes indicators that have existing national and local standards into preliminary levels. Subsequently, it supplements the grading standards for other indi-cators by synthesizing relevant literature. For indicators that lack current standards and relevant literature references, thresholds of 5% and 95% are used as upper and lower bounds, and linear interpolation is employed to complete the grading of these indicators. Integrating these principles, this paper divides the carrying capacity evaluation standards into five levels: Severely overloaded (I), overloaded (II), critical (III), weakly sustainable (IV), and sustainable (V). The specific grading standards are shown in Table 1.
Table 1 Regional WECC evaluation index grading standards
Evaluation index Units Regional WECC evaluation index grading standards
I II III IV V
C1 yuan person-1 <19064.6 [19064.6, 34622.9] (34622.9, 50181.3] (50181.3, 65739.7] >65739.7
C2 person km-2 >925 [619, 925] [314, 619) [80, 314) <80
C3 % >48% [37%, 48%] [26%, 37%) [15%, 26%) <15%
C4 m3 (104 yuan)-1 >161.83 [115.54, 161.83] [69.24, 115.54) [22.95, 69.24) <22.95
C5 m3 (104 yuan)-1 >27.03 [21.04, 27.03] [15.05, 21.04) [9.05, 15.05) <9.05
C6 m3 (104 yuan)-1 >136.44 [104.52, 136.44] [72.61, 104.52) [40.69, 72.61) <40.69
C7 m3 (104 yuan)-1 >9.79 [7.52, 9.79] [5.26, 7.52) [3.00, 5.26) <3.00
C8 kg ha-1 >24.14 [20.55, 24.14] [16.96, 20.55) [13.37, 16.96) <13.37
C9 m3 person-1 <193.87 [193.87, 462.55] (462.55, 731.23] (731.23, 999.92] <999.92
C10 m3 km-2 <11.27 [11.27, 19.22] (19.22, 27.17] (27.17, 35.12] <35.12
C11 mg L-1 >38.0 [31.6, 38.0] [25.2, 31.6) [18.8, 25.2) <18.8
C12 mg L-1 >4.91 [3.78, 4.91] [2.65, 3.78) [1.51, 2.65) <1.51
C13 % >5000 [3500, 5000] [2000, 3500) [500, 2000) <500
C14 % <5 [5, 10] (10, 20] (20, 30] >30
C15 % <65 [65, 75] (75, 85] (85, 95] >95
C16 t day-1 <10.03 [10.03, 19.97] (19.97, 29.91] (29.91, 39.86] >39.86
C17 % <3 [3, 5] (5, 15] (15, 45] >45
C18 % <0.5 [0.5, 1.0] (1, 1.5] (1.5, 2.0] >2.0

2.3 Evaluation of WECC based on coefficient of variation method

2.3.1 Single evaluation index calculation

Due to the variety and differing units of the indicators, standardization is a prerequisite to ensure comparability and eliminate the impact of dimensions prior to weight assignment. The purpose of this standardization process is to transform all indicator values into a unified, dimensionless range, typically within the interval [0,1]. Given that individual indicators may exert either positive or negative influence, the range standardization method is employed to normalize the indicators.
Positive index:
$I_{i}=\left\{\begin{array}{cc}0 & x_{i}<x_{i m} \\\frac{x_{i}-x_{i m}}{x_{i M}-x_{i m}} & x_{i m} \leqslant x_{i} \leqslant x_{i M} \\1 & x_{i}>x_{i M}\end{array}\right.$
Negative index:
$I_{i}=\left\{\begin{array}{cl}1 & x_{i}<x_{i m} \\1-\frac{x_{i}-x_{i m}}{x_{i M}-x_{i m}} & x_{i m} \leqslant x_{i} \leqslant x_{i M} \\0 & x_{i}>x_{i M}\end{array}\right.$
where xi is represents the actual value of the i-th indicator; while xim and xiM respectively denote the minimum and maximum values for indicator i.

2.3.2 Index weight determination

In this study, the coefficient of variation method is employed to determine the weights assigned to various indicators. Within a multi-indicator comprehensive evaluation, an indicator that exhibits pronounced variability across all assessment units possesses superior discriminative power and therefore deserves a proportionally greater weight. Conversely, an indicator characterized by minimal dispersion contributes little to distinguishing performance levels and is accordingly allotted a lower weight. By quantifying the information content of each metric through objective statistical measures, the method furnishes a rigorously data-driven weighting scheme that avoids the distortions of subjective factors or technical experience. The exact calculation method is as follows:
Vi=σi/x¯i
Wi=Vi/i=1nVi
where σi, x¯i, Vi are respectively the standard deviation, mean value and coefficient of variation of indicator i.
The formula for calculating the WECC evaluation index (F) for each zone could be expressed as follows:
F=i=1nWi×Ii
where Iiand Wi are represent the standardized value of the i-th indicator and the weight of the i-th indicator.

2.4 Study area and data sources

The Weihe River plays a critical role in meeting the irrigation demands of the downstream Guanzhong Plain and supports the socioeconomic development of Northwest China. Its significance extends beyond regional importance, impacting national-level water management and agricultural productivity. The Shaanxi section of the Weihe River Basin, which accounts for 46.29% of the total basin area, is particularly rich in water resources, which are crucial for sustaining local economies, agriculture, and urban growth.
This study specifically targets five cities—Xi’an, Baoji, Xianyang, Tongchuan, and Weinan—and their 41 counties, aiming to evaluate their WECC. The analysis is based on comprehensive data sourced from the Shaanxi Statistical Yearbooks (2010-2019), along with the statistical yearbooks and water resource bulletins of these cities over the same period. This multi-source data collection ensures the accuracy and reliability of the analysis, providing a solid foundation for assessing the region’s water management challenges and capacity.

3 Results and analysis

3.1 Reliability of the indicator system

After standardizing the indicator system, data analysis was conducted using SPSS 27 software. The calculated average Cronbach’s alpha reliability coefficient was 0.848, indicating a high level of internal consistency within the indicator system and confirming its reliability.

3.2 Weight calculation results and grading standards

Based on the calculated evaluation values, the respective weights of each indicator and the corresponding subsystem contributions during the Weihe River Basin study period have been determined, as illustrated in the figure below.
Figure 3 presents a hierarchical ranking of the influence exerted by various evaluation indicators on water environmental carrying capacity. These indicators, listed in descending order of impact, include sediment delivery ratio, ammonia nitrogen index, water usage per ten thousand yuan of agricultural output value, wastewater discharge per ten thousand yuan of industrial output value, water usage per ten thousand yuan of GDP, per capita water resource quantity, and population density. Notably, four of these indicators— comprising over half—are associated with, underscoring its dominant role in exerting influence over the water environmental carrying capacity. Figure 4 further illustrates the relative contributions of different subsystems to the overall evaluation. The analysis clearly indicates that the pressure subsystem exerts the most substantial influence on the carrying capacity of the water environment, followed by the state subsystem. In contrast, the response and management subsystems contribute minimally. These findings highlight the critical importance of prioritizing the pressure subsystem when assessing water environmental carrying capacity.
Figure 4 Subsystem weight

Note: The specific meanings of D/P/S/I/R/M are illustrated in Figure 1.

By substituting the data from the grading standards of re-gional water environmental carrying capacity evaluation indicators (see Table 1) into formulas (1) to (5), and integrating the indicator weights determined in Figure 3, the grading standards for each evaluation level of water environmental carrying capacity are calculated as follows:
• Level V (Sustainable): (0.7688, 0.9673];
• Level IV (Weakly sustainable): (0.5624, 0.7688];
• Level III (Critical): (0.3373, 0.5624];
• Level II (Overloaded): (0.1158, 0.3373];
• Level I (Severely overloaded): [0,0.1158].

3.3 WECC comprehensive evaluation of Weihe River Basin

The Shaanxi segment of the Wei River basin spans the eastern, central, and western geographical regions of Shaanxi Province, encompassing numerous districts and counties. Given the variations diversity, variations in development levels, and resources availability within the area, this study divides the basin into seven sections, based on the main river control sections and administrative boundaries. These sections are further segmented into upper, middle, and lower spatial patterns to better assess regional differences. The evaluation of environmental carrying capacity across these spatial patterns highlights the spatial heterogeneity of the water environment and its impact on economic development. The specific divisions are shown in Table 2, where Zones 1-3 encompass the upstream area, including Baoji and 11 districts and counties of Xianyang; Zones 4-5 cover the midstream, including Xi’an and 16 districts and counties of Xianyang; and Zones 6-7 include the downstream areas of Xi’an, Tongchuan, and 13 districts and counties of Weinan. The analysis employs various indicators, which are visually represented in Figure 2. These indicators cover a range of socioeconomic and environmental metrics, including those relevant to water resource management, industrial activity, and agricultural practices, sourced from national and provincial-level statistical yearbooks for the period 2010-2019. Given the critical role of data integrity in the WECC assessment process, this study applies interpolation methods to handle missing or incomplete data. Specifically, linear interpolation principles are used to estimate missing values for certain years, ensuring a more reliable and continuous dataset for analysis.
Table 2 Division of the Shaanxi section of the Weihe River Basin
Name Control section name Administrative region
Partition 1 Linjia Village, Wolong Temple Baoji City (Weibin District, Jintai District, Chencang District, Longxian County, Qianyang County)
Partition 2 Guozhen Bridge, Weijiabao Baoji City (Fengxiang County, Qishan County, Mei County, Taibai County)
Partition 3 Yangling, Xingping Baoji City (Linyou County, Fufeng County); Xianyang City (Xingping City)
Partition 4 Nanying, Xianyang Xi’an (Hu County); Xianyang City (Qindu District, Weicheng District, Qian County, Yongshou County, Wugong County); Yangling District
Partition 5 Tianjiangrendu, Geng Town,
Xinfeng
Xi’an (Xincheng District, Beilin District, Lianhu District, Weiyang District, Baqiao District, Lintong District, Yanta District, Chang’an District); Xianyang (Jingyang County)
Partition 6 Tianshigangou, Shawangdu Xi’an (Yanliang District, Gaoling District); Tongchuan City (Wangyi District, Yaozhou District); Xianyang City (Sanyuan County, Chunhua County); Weinan City (Fuping County)
Partition 7 Shuyuan, Shi Village,
Tongguandiaoqiao
Weinan City (Linwei District, Pucheng County, Huazhou District, Tongguan County, Dali County, Huayin City)
To execute the process described, the first step involves averaging the socioeconomic and environmental indicator data across various divisions and the upper, middle, and lower regions of the Shaanxi section of the Wei River Basin from 2010 to 2019. This data is then input into formulas (2) to (6). Using the weights provided in Figure 3, the water environmental carrying capacity evaluation levels for each region are calculated. The results are presented in Figure 5.
Figure 5 Temporal variation of WECC in the Shaanxi section and upper, middle, and lower reaches of the Weihe River Basin (2010-2019)
According to Figure 5, the WECC of the Shaanxi section of the Weihe River Basin shows a general upward trend from 2010 to 2019. The details are as follows: Upstream Region (Subregions 1-3): WECC improved from weakly bearable in 2010 to bearable in 2019, reflecting a stable trend of improvement. Subregion 1 (Weibin District, Jintai District, etc.): This industrial region benefited from policies such as the Baoji City Water Pollution Prevention and Control Action Plan, which improved industrial wastewater treatment facilities and reduced emissions. Increased environmental protection investments within the management subsystem further bolstered WECC. Subregion 2 (Fengxiang County, Qishan County, etc.): Predominantly agricultural, this area experienced significant pressure from high rural water use and excessive fertilizer application. Policies such as the Baoji Municipal Bureau of Agriculture and Rural Affairs Annual Report and the Shaanxi Provincial Water-Saving Society Construction Implementation Plan promoted water-saving irrigation technologies, reducing agricultural water demand and improving WECC. Subregion 3 (Linyou County, Fufeng County, etc., including the Yangling section): With environmentally sustainable farming practices and balanced industrial - service sectors in Xingping City, this region advanced WECC by implementing high-efficiency water use technologies and strict water-saving measures under the Shaanxi Province Water Environment Protection Regulations. Midstream Region (Subregions 4-5): WECC improved from critical to weakly bearable, indicating a gradual mitigation of environmental pressure though challenges persist.Subregion 4 (counties in Xianyang): Rapid economic growth between 2010 and 2019 led to increased pressure from domestic sewage and industrial wastewater. However, the Xianyang City Water Pollution Prevention and Control Action Plan and the Shaanxi Province 13th Five-Year Plan for Water Resource Management Guidelines facilitated the construction of additional wastewater treatment facilities, improving treatment capacity and WECC.Subregion 5 (Xi’an): With a dynamic economy and rapidly expanding commercial and service sectors, this area faced significant water environment pressure from domestic sewage. Policies like the Xi’an Pollution Prevention and Control Battle Three-Year Action Plan mandated improved sewage treatment and enhanced green coverage, fostering improvements in WECC despite limited progress. Downstream Region (Subregions 6-7): WECC showed improvement, rising from overloaded to weakly bearable, but overall levels remain low. Subregion 6 (Yanchang District, Tongchuan City): The high industrialization led to significant water use and wastewater discharge. While the Tongchuan City Industrial Pollution Control Action Plan improved wastewater treatment capacity, limited economic deve lopment hindered policy implementation resulting in slow WECC improvement. Subregion 7 (Dali County, Huayin City, etc.): Predominantly agricultural, this region suffers from severe non-point source pollution impacting water quality. Policies such as the Weinan City Ecological Environmental Protection Plan and specialized agricultural non-point source pollution control measures improved WECC by enhancing water environment management. The overall improvement in WECC across different subregions of the Weihe River Basin (Shaanxi section) from 2010 to 2019 reflects the combined effects of economic activities, industrial and agricultural practices, and targeted water management and pollution control policies.
Each subregion’s WECC is influenced by a combination of development levels, industrial structures, and environmental policies. Variations in WECC across regions can be attributed to distinct characteristics within the DPSIRM model subsystems, as outlined below.
(1) Upper reaches
Economic development: Relatively high, with abundant water resources and minimal soil erosion. This results in a lower impact on the water environment and a high WECC.
Industrial structure: Dominated by agriculture and light industry, with low levels of industrialization and minimal industrial pollution.
Environmental policies: Strong focus on water environment management with strict policy enforcement, significant investment in environmental protection, and the adoption of advanced agricultural technologies, which help mitigate water use and pollution pressures.
(2) Middle reaches
Economic development: Rapid economic growth and a high urbanization rate generate substantial driving forces, increasing water demand.
Industrial structure: A diversified industrial base, dominated by industry and services, creates dual pressures from industrial and domestic wastewater, with high pollutant concentrations.
Environmental policies: Substantial investment in wastewater treatment infrastructure, though high urbanization and industrial growth lead to elevated management costs and a need for further improvements in wastewater treatment rates.
(3) Lower reaches
Economic development: Primarily agricultural with low economic development and limited industrial upgrades, leading to insufficient driving forces for economic growth.
Industrial structure: High eutrophication levels during the rainy season, with pollutants challenging to degrade naturally, resulting in poor water quality.
Environmental policies: Limited industrialization and inadequate domestic wastewater treatment facilities, coupled with weak policy support for water environment protection, exacerbate the lack of pollution control measures.
Policy recommendations: Upper reaches: Focus on promoting environmental protection industries and green industrial transformation. Middle reaches: Enhance wastewater treatment infrastructure to meet the growing demands from urbanization and industrial development. Lower reaches: Control agricultural non-point source pollution and adopt advanced agricultural management practices to reduce eutrophication and improve water quality.

3.4 Evaluation and analysis of each subsystem

In summary, the WECC of each subregion across the upper, middle, and lower reaches of the Weihe River Basin is influenced by a multifaceted interplay of economic development levels, industrial structures, and policy management strategies. Particularly in the middle reaches, represented by Xi’an, rapid urbanization has posed significant challenges to WECC, driven by the complexities of socioeconomic activities and environmental governance pressures. As the capital of Shaanxi Province, Xi’an is characterized by high population density, vibrant economic activity, and a diverse industrial structure encompassing industry, services, and agriculture. These factors contribute to distinct characteristics within each subsystem, differentiating Xi’an from other regions. To gain a more nuanced understanding of the role of the DPSIRM model’s subsystems in WECC evaluation, this study will use Xi’an as a case study to analyze the interactions and dynamics within the driving forces, pressures, state, impact, response, and management subsystems. This analysis seeks to explore how various factors contribute to changes in regional WECC, uncovering the root causes of water environmental issues in Xi’an while offering valuable management insights that can be applied to other regions.
Using the regional WECC calculation method, the evaluation indices for each subsystem can be derived. As a case in point, Figure 6 illustrates the WECC evaluation indices for each subsystem in the middle region of the Wei River Basin from 2010 to 2019.
Figure 6 Evaluation index of each subsystem
Based on the data in Figure 6 and analysis of 18 indicators for Subregion 5 (Xi’an) from 2010 to 2019, alongside the interactions among subsystems in the DPSIRM model, several key findings emerge: The driving force indicators (e.g., population and GDP) exhibited consistent upward trends from 2010 to 2019, reflecting the increasing demands driven by economic and social development. However, thse trends were accompanied by mounting environmental pres-sures, manifested through rising pollutant emissions and escalating water demand. Indicators such as chemical oxygen demand (COD) and ammonia nitrogen remained at elevated levels during the early phase (2010-2015), signaling significant pollution pressure from industrial production and urban domestic wastewater discharge. The introduction of the Water Pollution Prevention and Control Action Plan in 2015, along with a series of local implementation schemes, catalyzed efforts to remediate major pollution sources in the region. In response, measures such as construction and upgrading of wastewater treatment facilities were progressively rolled out to improve water environment quality. Data indicate a steady decline in water quality indicators, particularly COD and ammonia nitrogen, from 2015 onward. This trend is strongly correlated with the environmental policies and governance initiatives implemented during the mid-phase (around 2015). Post-2015, multiple wastewater treatment plants were constructed or expanded across the counties within Subregion 5, accompanied by more stringent regulations on industrial discharges. These measures significantly reduced the pollution load from industrial and domestic wastewater, resulting in noticeable water quality improvements. In 2016, Xi’an implemented a comprehensive River Chief System, establishing a hierarchical framework for supervision and management. The government employed data monitoring systems to track water quality changes in real time, dynamically adjusting strategies for key areas and enterprises. This management mechanism was systematically implemented across all counties, with clear divisions of responsibility to ensure the effective implementation of governance policies. The introduction of the management subsystem (M) further strengthened the systematic nature of water environment governance. Unlike the traditional DPSIR model, the M subsystem places a greater emphasis on the proactive role of governmental in institutional arrangements, resource allocation, and data monitoring. This has led to more effective and coordinated management efforts.
In the DPSIRM model, the interdependent relationships among the subsystems determine the evolution of WECC in Subregion 5. The driving force subsystem, characterized by economic growth and population increases, intensifies environmental pressures. Conversely, the state and impact subsystems reflect the positive ecological and social feedback resulting from improvements in water quality. Meanwhile, the organic integration of the response and management subsystems provides effective policy support and management mechanisms for water environment governance. This successful coupling is predominantly driven by policy initiatives, particularly those targeting water pollution prevention and resource conservation. Specifically, from 2010 to 2019, key changes in Subregion 5 were guided by landmark policies such as the Weihe River Protection Regulations, the Xi’an Water Pollution Prevention and Control Action Plan, and the Xi’an 13th Five-Year Ecological Environmental Protection Plan. These policies directed significant environmental protection investments toward critical areas of pollution control areas and water quality improvement. Higher industrial discharge standards were achieved through strict regulation of COD and ammonia nitrogen levels. Simultaneously, urban wastewater treatment facilities were expanded and upgraded. Additionally, the promotion of the River Chief System clarified management responsibilities, significantly enhancing the efficiency of water environment governance.
In summary, the changes in Subregion 5’s WECC are the result of the synergistic influence of multiple factors. Within the DPSIRM model framework, Xi’an has achieved a steady improvement in WECC by fostering greater coordination across the driving force, pressure, state, and impact subsystems, while also leveraging policy support through the response and management subsystems. Notably, policy and governance have played a pivotal role, as the dual strategies of environmental remediation and institutional innovation have ensured the relative stability and sustainability of water environment quality amid rapid development. This governance experience offers an insightful model for other regions, demonstrating a practical pathway to optimizing WECC through the coupling and integration of subsystems.
By analyzing the trends and interrelationships among subsystems, a more profound understanding of the underlying driving forces behind WECC changes and their intricate mechanisms can be attained. The fluctuations in Subregion 5’s Water Environment Carrying Capacity (WECC) from 2010 to 2019 cannot be solely attributed to industrial, agricultural, and socioeconomic activities. Rather, they represent a comprehensive reflection of the interplay between policy implementation, management measures, and the dynamic interactions among various subsystems. To more thoroughly elucidate the specific impacts of each subsystem on WECC and to identify the key driving factors and sensitive indicators, it is imperative to conduct an in-depth study of the critical indicators within each subsystem in Subregion 5 and examine their temporal trends.
Through a detailed examination of the trends in the indicators within subsystems (as shown in Figure 7), a nuanced analysis of the WECC changes in Subregion 5 reveals distinct phases from 2010 to 2019: 1) 2010-2013: Declining WECC phase: During this period, the rising per capita GDP and urbanization rates signified robust economic development and rapid urban expansion. While this economic growth laid a stronger foundation for water environment governance, it simultaneously led to a marked increase in industrial wastewater discharge and domestic sewage.
Figure 7 Evaluation indices for each subsystem
Moreover, the insufficient improvement in key response indicators, such as wastewater treatment rates, failed to adequately address the mounting pressures from both economic and population expansion. As a result, the WECC experienced a decline. Although the Xi’an Urban Drainage and Waterlogging Prevention Plan was launched in 2012, its immediate impact on pollution control was limited, which explains the observed reduction in the carrying capacity index. 2) 2014-2017: Fluctuating WECC phase: This period was characterized by continued growth in industrial water consumption and wastewater discharges, accompanied by rising levels of pollutants, such as chemical oxygen demand (COD) and nitrogen oxides. These growing pressures further strained the water environment. The persistence of these challenges was partially attributable to Xi’an’s industrial support policies, which had been implemented during the earlier phase of rapid economic growth. Meanwhile, the delayed construction of wastewater treatment facilities exacerbated environmental pressures. However, the government’s 2013 Water Pollution Prevention and Control Action Plan began to yield initial results during this period. Major projects like the Weihe River Comprehensive Management Initiative and the Eight Rivers of Chang’an Restoration Project implemented a series of measures, including pollution source control, ecological restoration, and the interception of pollutants, which contributed to a reduction in pollution levels. While these measures alleviated some water quality pressures, the stabilization of their effects remained incomplete, leading to fluctuations in WECC from 2014 to 2017. 3) 2018-2019: Gradually rising WECC phase: From 2018 onward, Xi’an intensified its water management efforts, launching the Three-Year Action Plan for All-Area Water Management and the Blue-Sky City Building. This plan emphasized integrated strategies such as “pollution source control” and “efficient water use”. In 2019, the government ramped up its monitoring and management of key river sections and tributaries flowing into the Weihe River, which led to marked improvements in water quality. Throughout this phase, the systems for ecological protection and water resource management matured, and the WECC exhibited a steady upward trajectory, buoyed by the support of these policies. Key indicators and observations: Key driving indicators: Per capita GDP, urbanization rate, and industrial water consumption reflect the economic and social forces shaping changes in WECC Sensitive indicators: COD, wastewater treatment rate, and environmental protection investment as a percentage of GDP highlight critical factors influencing water environment quality and governance.
Recommendations for future WECC improvement: Driving force subsystem: Promote the development of a green economy; optimize urban planning; establish a resource-constrained economic system. Pressure subsystem: Improve industrial water use efficiency; enforce strict industrial wastewater regulation; optimize agricultural water use. State subsystem: Strengthen water pollution control; restore river and lake ecosystems; ensure ecological water use. Impact subsystem: Implement extensive vegetation restoration projects; enhance soil and water conservation; promote watershed environmental compensation. Response subsystem: Increase investment in pollution treatment facilities; promote wastewater reuse; expand rural wastewater treatment facilities. Management subsystem: Improve watershed management systems; increase fiscal investment; strengthen technological support.
Additionally, all subsystems should be more closely coordination. The management subsystem should drive the effective implementation of policies within the response subsystem, while feedback from the state subsystem on water quality should inform economic activities within the driving force and pressure subsystems. In this regard, data-driven decision- making is paramount. To this end, a comprehensive water environment monitoring platform should be established, creating a closed-loop management system that integrates indicator monitoring, issue identification, and policy implementation.

4 Conclusions

Based on an analysis of the water environment carrying capacity (WECC) of the Shaanxi section of the Weihe River Basin from 2010 to 2019 using the DPSIRM model, alongside an investigation into subsystem coupling relationships, the following conclusions are drawn:
(1) Scientific validity and applicability of the DPSIRM Model
The incorporation of the management subsystem enriches the traditional DPSIR model, accentuating the proactive role of human management in water environment governance. The DPSIRM model strengthens the interactions and feedback mechanisms between the six subsystems: driving force, pressure, state, impact, response, and management, providing a comprehensive analytical approach to WECC. This model not only offers a scientific evaluation tool for assessing fluctuations in water environment carrying capacity in the Shaanxi section of the Weihe River Basin, but also proves particularly advantageous in complex watershed management assessments. It can serve as a valuable reference for WECC evaluation in other basins.
(2) Weight and key indicator analysis
Weight analysis indicates that the pressure subsystem exerts the most substantial influence on water environment carrying capacity, followed closely by the state subsystem. This underscores the direct pressure exerted by economic activities on water resources and the environment. Sensitive indicators, such as water consumption per unit of GDP and wastewater discharge per unit of industrial output, play pivotal roles in driving changes in WECC. This suggests that, alongside fostering economic development, it is imperative to optimize resource use efficiency and rigorously control pollution emissions.
(3) Trends in evaluation indices and their driving mechanisms
Indices for the driving force, pressure, and management subsystems display an upward trend, reflecting heightened demand resulting from economic development, population growth, and the gradual improvement of management policies. Specifically, the continual expansion of wastewater treatment facilities and the increasing proportion of environmental protection investment relative to GDP have positively influenced WECC. Fluctuations in the state and impact subsystems indicate that factors such as alterations in pollutant emissions and the intensity of ecological protection measures substantially affect water quality and ecosystem restoration. The variability observed in the response subsystem index reveals that, despite strengthened pollution control measures, the capacity of treatment facilities has not entirely kept pace with mounting pressures. This indicates the necessity for further enhancement of wastewater treatment facility coverage and efficiency.
(4) Regional disparities and policy implications
Subregional analysis suggests that the upstream region should prioritize mitigating agricultural non-point source pollution and strengthening ecological protection; the midstream region should focus on optimizing industrial structures and expediting the construction of wastewater treatment facilities; the downstream region should emphasize water-saving irrigation and non-point source pollution management. The regional disparities call for the formulation of more nuanced and region-specific policies to ensure the coordinated development of WECC across the entire basin.
The application of the DPSIRM model has deepened our understanding of the dynamic changes in water environment carrying capacity in the Shaanxi section of the Weihe River Basin and the driving mechanisms underlying these shifts. The model elucidates the complex balance between economic development and environmental protection, providing a scientific basis for formulating watershed management policies. Moving forward, further strengthening the monitoring and optimization of key sensitive indicators, coupled with enhanced regional collaborative governance, will be essential for fostering the sustainable improvement of water quality throughout the basin.
[1]
Ait-Aoudia M N, Berezowska-Azzag E. 2016. Water resources carrying capacity assessment: The case of Algeria’s capital city. Habitat International, 58: 51-58.

[2]
Chen M, Su X L, Huang H, et al. 2019. Assessment of river habitat quality in the Three Gorges Reservoir Region. Acta Ecologica Sinica, 39(1): 192-201. (in Chinese)

[3]
Cui D, Li R, Chen Y, et al. 2019. An evaluation of the water environmental carrying capacity using structural equation modeling: A case study of the upstream areas of Xiaoxia Bridge Section in Huangshui River Basin. Acta Scientiae Circumstantiae, 39(2): 624-632. (in Chinese)

[4]
Dou M, Ma J, Li G, et al. 2015. Measurement and assessment of water resources carrying capacity in Henan Province, China. Water Science and Engineering, 8(2): 102-113.

[5]
Fan Y Y. 2023. Study on the Allocation and regulation mechanism of pollutant discharge permit based on water environment carrying capacity. Diss., Nanchang, China: Nanchang University. (in Chinese)

[6]
Hardin G. 1986. Cultural carrying capacity: A biological approach to human problems. Bio Science, 36(9): 599-604.

[7]
Huang Y, Fan Y, Ren Y, et al. 2023. DPSRE model framework for dynamic evaluation of the water environmental carrying capacity in a river network area of Taihu Lake, East China. Desalination and Water Treatment, 281: 78-90.

[8]
Lei C, Huang Q, Ni C Y, et al. 2023. Evaluation of river habitat quality and analysis of influencing factors in Yuan River Basin. Journal of Jiangxi Normal University (Natural Science), 43(4): 425-432.

[9]
Li X Y, Qin X, Lu Z H, et al. 2022. Comparative analysis of ecological carrying capacity at different scales in Xilingol League, Inner Mongolia. Ecological Indicators, 141: 109127. DOI: 10.1016/j.ecolind.2022.109127.

[10]
Li Y, Geng H C, Wu L H, et al. 2024. Ecosystem service functions of a typical karst urban basin based on land use change. Journal of Resources and Ecology, 15(1): 1-14.

DOI

[11]
Li Y Y, Chang J X, Wang Y M, et al. 2016. Spatiotemporal impacts of climate, land cover change and direct human activities on runoff cariations in the Wei River Basin, China. Water, 8(6): 220. DOI: 10.3390/w8060220.

[12]
Pan D, Chen H, Zhang N, et al. 2023. Do livestock environmental regulations reduce water pollution in China? Ecological Economics, 204: 107637. DOI: 10.1016/j.ecolecon.2022.107637.

[13]
Peng J Y, Tong H J, Liu X C, et al. 2023. Comprehensive evaluation of water resources and environmental carrying capacity based on dualistic water cycle analysis and its application in the Tuo River Basin, China. Ecological Indicators, 146: 109897. DOI: 10.1016/j.ecolind.2023.109897.

[14]
Song J X, Cheng D D, Li Q, et al. 2015. An evaluation of river health for the Weihe River in Shaanxi Province, China. Advances in Meteorology, (1): 1-13.

[15]
Wen R, Shi X X, Qian H. 2023. Spatio-temporal variation of water resources carrying capacity in Anhui Province based on DPSIR-TOPSIS model and coupling coordination. Journal of Water Resources and Water Engineering, 34(6): 88-97. (in Chinese)

[16]
Wu Q, Cao Y, Fang X, et al. 2022a. A systematic coupling analysis framework and multi-stage interaction mechanism between urban land use efficiency and ecological carrying capacity. Science of the Total Environment, 853: 158444. DOI: 10.1016/j.scitotenv.2022.158444.

[17]
Wu S G, Tian C H, Li B L, et al. 2022b. Ecological environment health assessment of lake water ecosystem system based on simulated annealing-projection pursuit: A case study of plateau lake. Sustainable Cities and Society, 86: 104131. DOI: 10.1016/j.scs.2022.104131.

[18]
Yang J, Lei K, Khu S, et al. 2015. Assessment of water environmental carrying capacity for sustainable development using a coupled system dynamics approach applied to the Tieling of the Liao River Basin, China. Environmental Earth Sciences, 73(9): 5173-5183.

[19]
Zhao Y Y, Li C, Liang Y, et al. 2025. Construction and application of river habitat evaluation system in the middle reaches tributaries of the Jinsha River. Journal of Hydroecology, 46(2): 103-113. (in Chinese)

[20]
Zhu M Q, Jin X Y, Che F Q, et al. 2024. Study on the type of failure of the effect of pipeline insulation measures in the permafrost regionsof China and Russia based on the Driving force-State-Response theory integrated cloud theory. Journal of Glaciology and Geocryology, 46(2): 625-636. (in Chinese)

[21]
Zong X. 2021. Forecast of water resources carrying capacity and structural water demand in Gansu Province based on SD Model. China Rural Water and Hydropower, (12): 83-90, 98. (in Chinese)

Outlines

/