Ecotourism

Assessing the Resource Endowment for Ice-Snow Tourism Destinations and the Internet Attention Spatial Mismatch in South China

  • ZHANG Fan , 1, 2 ,
  • KANGIN Helena Cationa 1, 2 ,
  • GUO Quanen , 1, 2, *
Expand
  • 1. Academy of Tourism, Nanchang University, Nanchang 330031, China
  • 2. School of Tourism, Nanchang University, Nanchang 330031, China
* GUO Quanen, E-mail:

ZHANG Fan, E-mail:

Received date: 2024-12-21

  Accepted date: 2025-03-15

  Online published: 2025-05-28

Supported by

Jiangxi Provincial Social Science Planning Project “Research on the Optimization of Development Paths for Ice and Snow Tourism in Jiangxi Province in the Digital Economy Era”(23GL25)

Abstract

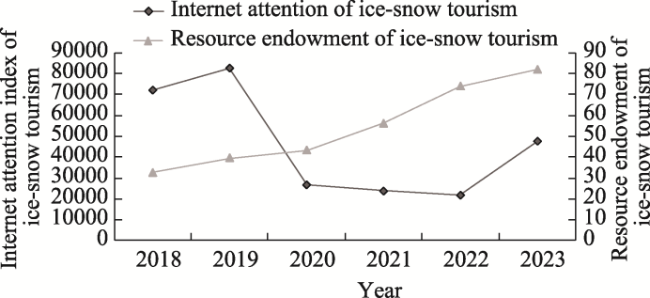
Ice-snow tourism is emerging as a vital sector for economic growth. As the climate crisis affects traditional ice-snow tourism destinations, southern China has built a significant ice-snow tourism sector. This expansion is fueled by significant tourist demand, a robust economy, and a high population density, which together lead to different development opportunities for ice-snow tourism in mid- and low-latitude areas. This study examines cities in southern provinces and assesses the resource endowment of ice-snow tourism resources from 2018 to 2023 in five categories: ice-snow events, ice-snow festivals, ice-snow venues, ice-snow parks, and ice-snow attractions. By utilizing Baidu Index data, the research looks at the gap between resource endowment and internet attention in winter tourism using a spatial mismatch model. The findings indicate that: (1) Ice-snow tourism endowment in South China is currently limited but experiencing rapid growth. (2) Internet attention in winter tourism within these cities varies, following an “up-down-up” trend. (3) There is a mismatch between resource endowment and internet attention. Over time, the development paths of ice-snow tourism in southern cities can be classified into three types: priority development, active development, and inertial development, influenced by factors such as policy changes, urban economic conditions, overall tourism development, and natural geography.

Cite this article

ZHANG Fan , KANGIN Helena Cationa , GUO Quanen . Assessing the Resource Endowment for Ice-Snow Tourism Destinations and the Internet Attention Spatial Mismatch in South China[J]. Journal of Resources and Ecology, 2025 , 16(3) : 886 -897 . DOI: 10.5814/j.issn.1674-764x.2025.03.024

1 Introduction

China’s national and local governments have prioritized the ice and snow economy as a key growth driver through national policies, amplified by the 2022 Beijing Winter Olympics’ catalytic effect (Zhu et al., 2023), there has been a notable increase in interest among southern tourists for ice and snow tourism,who are particularly attention to these activities for their entertainment value, excitement, and safety (Zhang and Sun, 2023). Currently, established ice and snow tourism destinations are primarily located in northern regions with natural advantages of high latitudes. Driven by both policy initiatives and consumer demand, the southern regions have undertaken various projects to enhance ice and snow tourism in recent years. This has led to the emergence of the ‘North Ice South Development’ trend in the distribution of ice and snow tourism across China. The southern region, characterized by its low-latitude position, necessitates distinct strategies and conceptual frameworks for ice and snow tourism, diverging significantly from those employed in high-latitude areas.
The establishment of ice-snow tourism destinations in the southern region is both feasible and essential. Existing research are predominantly emphasized in high-latitude regions, where ice and snow tourism served as a central resource for urban and regional development. These regions generally experience extended snow seasons and significant snowfall, fostering a robust interdependence between ice and snow tourism and the broader tourism sector, with the former often prioritized for growth. The overall quality of products in this sector is relatively low, with insufficient branding efforts that do not align with tourist expectations. Furthermore, there is a noticeable similarity among the various tourism offerings available.
There are notable differences in the development approaches to ice-snow tourism between southern and northern China (Liu and Guo, 2023). The southern region serves as an important provider of tourists for ice and snow tourism in China, featuring a wide range of untapped tourism opportunities (Son et al., 2023). Additionally, studies reveal a long- term interdependent relationship between regional economic growth and the establishment of ice-snow tourism attractions. The advantages of population density and per capita income in the southern region provide a robust economic foundation for the endowment of ice-snow tourism. The introduction of high-speed rail has enhanced the accessibility of ice-snow tourism sites, significantly benefiting the northeastern region; however, the overall accessibility in the southern region surpasses that of the north (Jin et al., 2020). As a crucial element of the ice and snow economy, ice-snow tourism has endowed a closely linked synergistic relationship with sectors such as finance, real estate, and services industry (Cai et al., 2023). The southern region has cultivated an industrial cluster of ice-snow tourism enterprises, particularly around the Yangtze River Delta and the Pearl River Delta, as well as the Chengdu-Chongqing area. Therefore, the resource endowment of ice-snow tourism in the southern region has its unique potential and advantages. Many cities in this area already possess well-established tourism resources. The emergence of ice-snow tourism has garnered interest from both governmental side and private enterprises, as it serves to enhance the relatively limited winter tourism offerings in the south.
The endowment of ice-snow tourism in the southern region carries substantial theoretical and practical significance for addressing the challenges posed by climate change to traditional ice-snow tourism sites. Climate change is recognized as a multifaceted phenomenon encompassing biophysical, economic, political phenomenon, also poses challenge to human society (Allison, 2015). Skiing, regarded as one of the sports that is most vulnerable to climate change, is also the most important sports in ice-snow tourism. Numerous researchers have carried out research on the influence and countermeasure of ice-snow sports and tourism in climate change (Scott et al., 2006) like snow-deficient winters, climate warming and so on. The ongoing decline in glacier size due to climate warming (Fischer et al., 2011) and alterations in outdoor viewing landscapes have significantly affected ice-snow tourism, as well as the associated economic activities. In Finland, for instance, climate change has made access to ice-snow landscapes more challenging (Wang and Zhou, 2019), resulting to a situation where tourists are reluctant to bear the additional costs incurred (Landauer et al., 2012). Currently, those tourism operators whose running within the ice-snow tourism sector maintain a relatively positive outlook regarding the implications of climate change (Trawöger, 2014). While artificial snowmaking is viewed as a potential mitigation strategy, rising temperatures may render such practices unfeasible (Scott et al., 2006), and the associated high carbon emissions present further challenges that require attention (Steiger and Scott, 2020). Research in China has also highlighted an ecological deficit in northern ice and snow tourism destinations (Li et al., 2023).
It is essential to adjust and rebuild the evaluation and prediction models for ice-snow suitability (Yu et al., 2022). The investigation of ice-snow tourism resources endowment in lower latitude regions may serve as a viable strategy to ensure the sustainable growth of the ice-snow economy (Yang et al., 2023). Recently scholars have categorized these resources into two distinct types: natural tourism resources and cultural tourism resources. In assessing the northern regions, which have extensive development experience in this field, these categories have been further refined to create a comprehensive indicator system. This system not only encompasses the primary resource categories but also extends to include infrastructure, transportation, accommodation, and various services, thereby enhancing the robustness of the evaluation framework. For instance, when assessing the value of ice-snow tourism resources in northern areas, it is suggested that this value is influenced by the spatial and temporal dimensions conducive to sightseeing. Consequently, elements of ice-snow cultural representation, such as landscape design, traditional attire, and architectural styles, are integrated into the resource evaluation criteria (Wu et al., 2010). Since the resource endowment of ice-snow tourism in the southern region is not prioritized, the advantages of southern region influence on the endowment of this sector remains minimal, causing them unsuitable for measuring ice-snow tourism development in the region. Drawing on existing research, this paper combines natural and economic resources into various categories; sightseeing (including ice, snow, and rime); sports and leisure activities (such as skating, ice sledding, curling, skiing, snow ballet, and climbing snow mountain); festivals, and events (both professional and recreational). Following the identification of characteristics of ice-snow tourism projects identified through data collection, the indicators were further refined. Sightseeing was categorized under ice-snow attractions, while festivals and activities were consolidated into ice-snow festivals. Sports and leisure, entertainment options, and performing arts were classified into ice-snow events, venues, and amusement parks, taking into account aspects such as location, professionalism, and duration.
The utilization of online data represents a strategic approach to enhance current winter tourism resources and evaluate visitor demands. The significance of the Internet has become increasingly evident in both the practical and academic fields of tourism studies (Buhalis and Law, 2008). On one side, the implementation of advanced information collection systems for gathering tourism-related data and making informed decisions has emerged as a crucial step for travelers when selecting destinations prior to their journeys (Hamid et al., 2021). Interpersonal influence and word-of- mouth (WOM) are acknowledged as primary sources of information that guide consumer decision-making through the Internet (Litvin et al., 2008; Pourfakhimi et al., 2020). Beyond the tourism sector, search engine data possesses substantial implications and has been shown to impact various aspects of social life, including presidential elections and youth suicide rates (Son et al., 2023). These insights highlight the necessity of maintaining a competitive edge in the digital age. Additionally, online engagement serves as a valuable instrument for forecasting tourists' travel preferences and their spatial distribution. By analyzing spatiotemporal trends to assess urban tourism network engagement, researchers can investigate the determinants influencing the tourism source market and develop models of urban tourism information flow (Zhao et al., 2023). This approach enables a scientific link of the relationship between tourist movement and online engagement, facilitating an understanding of the evolving patterns of spatial hotspots.
A multitude researchers have incorporated the concepts of tourism network attention, tourism resources, and the tourism economy into their comprehensive studies. They have highlighted the significance of understanding the spatial aspects of tourism and its influence on the accessibility and practicality of resource acquisition (Zhang et al., 2024). Furthermore, they have identified how factors such as transportation, accommodation facilities, consumer capacity, and the political environment contribute to the formation of spatiotemporal patterns within the tourism sector (Xue and Bai, 2023). In the medical field, the predictive capabilities of network search and network attention have also been acknowledged (Stanton and Katz, 2021).
These studies have illustrated how internet attention and tourism are connected. In recent years, a robust research framework has been developed to examine the internet attention focused on tourism in Chinese cities and provinces, utilizing the Baidu Index as a primary data source. However, the majority of these studies predominantly employ internet attention to develop spatial pattern models. In light of the current challenges related to the spatial mismatch between supply and demand in the context of ice-snow tourism development in China, along with the forthcoming issues concerning the sustainable growth of outdoor ice-snow tourism in high-latitude regions, this paper focuses on prefecture-level cities along the ‘Qinling-Huaihe’ line and all southern provinces. Assessing their resource endowment as ice-snow tourism destinations and analyzes changes from 2018 to 2023 across five dimensions: ice-snow events; ice-snow festivals, ice-snow venues, ice-snow amusement parks, and ice-snow attractions. By leveraging the Baidu Index for internet attention data, this study investigates the temporal evolution of the spatial dislocation between the endowment levels of southern ice-snow tourism destinations and their corresponding internet attention, ultimately evaluating the progress of ice-snow tourism in low-latitude areas as well as offering development recommendations.

2 Method and data collection

2.1 Selection and overview of research areas

The ‘Qinling-Huaihe’ Line serves as a significant north-south demarcation in China, particularly regarding climate, demographics, and economic activity. The region situated to the south of this line is typically classified as China’s southern region. As of 2020, this southern area represented 59.06% of the national population and contributed 64.36% to the country’s GDP, establishing itself as the economic nucleus of China, characterized by a notable advantage in per capita GDP. In contrast to the northern region, the majority of this region is in the subtropical monsoon climate zone with similar latitudes. The average temperature in January is generally exceeds 0 ℃, resulting to short snow season with limited snowfall and difficulties in maintaining snow cover. As a result, the availability of ice-snow resources in this region is limited. Furthermore, the economic activities in this area exist alongside a relatively underdeveloped ice and snow industry. The ‘Qinling-Huaihe’ Line and the southern regions generally exhibit advanced economic development yet contribute minimally to ice and snow tourism revenue, highlighting disconnect between the high-consumption market and the primary supply framework. Recent years have seen policy initiatives and market growth that have fostered on going endowment of ice and snow tourism in this area, enhancing the availability of resources. The development trajectory and current status exhibit regional consistency. Accordingly, the research area is delineated along the ‘Qinling-Huaihe’ Line.
This study adopts a global perspective in selecting research cities and involves extensive data collection from all cities within the province under examination. It includes nationality significant regions, such as the Yangtze River Economic Belt and the Guangdong-Hongkong-Macao Greater Bay Area, as well as unique geographical features such as alpine ice-snow belts located above 3000 m and terrace junctions. Emerging sectors, such as artificial ice-snow in low-latitude urban clusters, reveal varied patterns of ice- snow resource endowment. Importantly, specially managed forested areas and autonomous region are treated as independent observation points due to their distinctive terrain and abundant ice-snow resources, which present considerable research potential.

2.2 Data sources

2.2.1 The resource endowment of ice-snow tourism in the southern region

Ice-snow tourism typically includes three primary categories: ice-snow sightseeing; ice-snow entertainment; and ice-snow sports. This research aims to categorize and summarize the various manifestations of ice-snow tourism, along with the corresponding resource types, in accordance with the ‘Classification, Investigation and Evaluation of Tourism Resources’ (GB/T 18972-2017) established by the government of China in 2017. The southern region’s ice-snow tourism sector is characterized by a brief developmental history and a limited range of project types. Through comprehensive research and organization of ice-snow tourism resources across several southern provinces and cities, five key components—ice-snow events, ice-snow festivals, ice-snow amusement parks, ice-snow venues, and ice-snow attractions—are identified as metrics for assessing the resource endowment of ice-snow tourism in this region, reflecting a degree of regional representativeness. Data regarding the quantity of these five ice and snow resources in various southern provinces and cities have been gathered from platforms such as Ctrip, Qunar, Meituan, Baidu Maps, Amap, and through online searches.

2.2.2 Internet attention index

Baidu is acknowledged as the most extensively used search engine in China. Its Internet search trend tool, referred to as Baidu Index, serves various purposes, including market research and analysis of user behavior, and is particularly valuable in the field of tourism research. It is crucial to understand that the data generated by Baidu Index does not represent actual search volumes; instead, it offers a relative value derived from weighted data. Consistent with prior research, this study utilized the keyword ‘city name + tourism’ to measure the internet attention directed towards city tourism. The analysis focused on data collected from January 1 to February 28 for each year from 2018 to 2023, including February 29 for the year 2020. The data sources encompassed both PC and mobile platforms, with a nationwide scope. The average values derived from consecutive searches were utilized to evaluate the internet attention towards winter tourism in the selected cities.

2.3 Research methodology

2.3.1 The hierarchical entropy model

The hierarchical entropy model utilizes information derived from the decision matrix alongside entropy techniques in the context of multi-objective decision-making to refine the weights established through expert scoring methods (Tang et al., 2023). This approach aims to establish the weight associated with the resource endowment of southern ice-snow tourism resources while minimizing the subjectivity involved in weight determination. The process consists of four main stages: constructing the judgment matrix, calculating the weight vector, adjusting the judgment matrix, and applying entropy technology for correction, ultimately yielding reliable weights. The procedure is outlined as follows:
① Normalize the weight matrix A.
② Determine the maximum eigenvalue and consistency index to perform a consistency test.
③ Following the consistency test, calculate the output entropy B=(bij)m×m for the j-th indicator xj of the standard matrix. Its formula is as follows:
$\left.E_{j}=-K \sum_{i=1}^{m} b_{i j} \ln b_{i j} \quad i=1,2, \cdots, m\right)$
where K=(ln m)-1, and 0≤Ej≤1, Ej denotes the output entropy of grade j (j=1, 2,..., m).
④ Calculate the information weight μj for indicator xj. Its formula is as follows:
$\mu_{j}=\frac{1-E_{j}}{\sum_{j=1}^{m}\left(1-E_{j}\right)}$
where μj denotes the information weight of grade j(j=1, 2,..., m).
⑤ Adjust the weight accordingly to derive:
$\gamma_{j}=\frac{\mu_{j} w_{j}}{\sum_{j=1}^{m} \mu_{j} w_{j}}$
where wj denotes modify the index weight vector determined by the Analytic Hierarchy Process (AHP) according to the information weight.
Through these steps, the modified weight vector γ=(γ1, γ2,..., γm)T of grade j (j=1, 2,..., m) is established.

2.3.2 The Spatial Mismatch Index (SMI)

The Spatial Mismatch Index (SMI) serves as a metric for assessing how evenly spatial data is distributed. It evaluates the extent of clustering or spread within spatial data to determine the disparity between the resource endowment and the attention given to network connectivity in southern ice and snow tourism locations. This study builds on earlier research and employs the spatial mismatch index in the following manner:
SMIn,i=(1/Pn)×[(en,i/EnPnpn,i]×100
In the equation (4), en,i represents the resource endowment of ice-snow tourism resources in city i in n years. En denotes the overall value of ice-snow tourism resource endowment in the southern region in the n year; meanwhile pn,i indicates the level of attention given to winter tourism in city i in the n years; and Pn reflects the total value of tourism attention on the internet across the southern region in the n years.

3 Result and analysis

3.1 Evaluation index system for ice-snow tourism endowment in southern region

A comprehensive set of evaluation indicators have been developed to evaluate ice-snow tourism resources in the northern regions. The ice-snow tourism sectors in the northeast and northwest boast a long history, characterized by robust basic robust basic service facilities and comprehensive official data. In contrast, the southern regions ice-snow tourism is still in the eraly stages of developing their ice-snow tourism sector. Given that ice-snow tourism in the southern region is still developing, by integrating these standards with the actual resource endowment of ice-snow tourism in the southern region, a database has been created that encompasses five primary categories of tourism resources: ice-snow events, ice-snow festivals, ice-snow parks, ice-snow venues, and ice-snow attractions.
The importance of various tourism resources play a crucial role in the growth of ice-snow tourism. By considering both subjective and objective weight indicators, the hierarchical entropy model has been employed to optimize these weights multiple times. A judgment matrix A was constructed using the AHP, resulting in a maximum characteristic root λ=5.179, consistency index (CI)=0.045, a random index (RI)=1.12, and a consistency ratio (CR) of 0.04, which successfully passed the consistency test. However, it is important to note that the AHP weight matrix is derived from experts’ evaluations, which may be introduce subjectivity. To mitiage this subjectivity, the hierarchical entropy model was used for further adjustments. After these corrections, the resulting formula for calculating the endowment level of ice and snow tourism resources in the southern region is as follows:
I S T n , i = 0.205 I S E n , i + 0.422 I S F n , i + 0.120 I S P n , i + 0.141 I S V n , i + 0.112 I S A n , i
In the equation (5), ISTn,i represents the level of ice-snow tourism resource endowment in city i during year n. The variables include ISEn,i (Ice-Snow Events) which pertains to events related to ice and snow in city i during year n; ISFn,i (Ice-Snow Festivals) referring to festivals centered around ice and snow in city i during year n; ISPn,i (Ice and Snow Parks) which denotes amusement parks designed for ice-snow activities in city i during year n; ISVn,i (Ice and Snow Venues) indicating venues that host ice-snow related activities in city i during year n; and ISAn,i (Ice and Snow Attractions) which encompasses attractions that feature ice-snow themes in city i during year n.
The calculation of the annual level of ice-snow tourism endowment incorporates a time series effect, building upon the evaluation metrics established by previous studies. Among the five indicators, ice-snow amusement parks, ice-snow venues, and ice-snow attractions are classified as ongoing projects, whereas ice-snow festivals and ice-snow events are categorized as temporary initiatives. Consequently, when evaluating the impact of festivals and events, they are not aggregated; rather, they solely influence the overall development level of ice-snow tourism in the city. Following a comprehensive data collection on ice-snow tourism resource endowment in southern cities, those cities lacking relevant data for the past six years were excluded from the analysis, resulting in a total of 150 cities being evaluated.

3.2 Spatial mismatch analysis

Regarding spatial distribution, the southern region’s ice- snow tourism endowment levels have generally shown a pattern where the north is more developed than the south, and the northwest surpasses the southeast. Over time, there has been a steady rise in the overall resource endowment level, with the coverage gradually expanding from the northwest towards the southeast. Between the period from 2018 to 2019, the regions with high resource endowment were predominantly found in Sichuan and Chongqing, while the southeast exhibit a comparatively limited endowment coverage. Although there was numerical growth, the rate was slower, and there were many undeveloped areas in the eastern and southern regions. From 2020 to 2023, there was a significant increase in the number of regions with a high degree of resource endowment, and the coverage area noticeably expanded. Despite the southeast still lagging behind the northwest in terms of endowment level, it had a wider endowment coverage area. The primary resource endowment areas were focused on the high-altitude regions of the northwest, the transitional zones of the central steps, and the economically advanced coastal areas of the southeast (Figure 1).
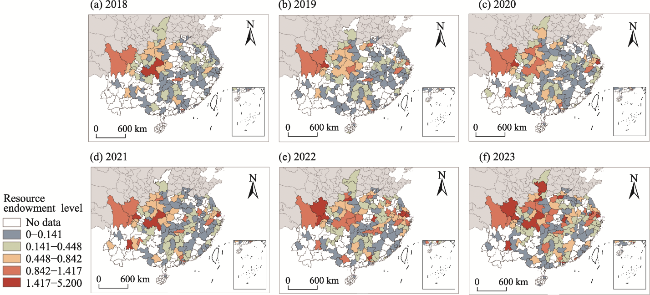
Figure 1 Resource endowment levels of southern China ice-snow tourism in 2018-2023
An examination of the disparity between the resource endowment of ice-snow tourism resources in the southern region and the corresponding internet attention reveals several trends. The resource endowment of ice-snow tourism sites in the south has generally been increasing, albeit with a deceleration observed in 2020, followed by a significant surge from 2021 to 2022, and another slowdown in 2023. Conversely, the level of internet attention has demonstrated a pattern of initial decline followed by recovery phase, with a significant rise from 2018 to 2019, reaching a peaking at 82766 in 2019, before experiencing a sharp decline from 2019 to 2020, leading to a continued decrease until reaching a low of 21769 in 2022, followed by a marked resurgence from 2022 to 2023. There exists a correlation between the endowment of ice-snow tourism destinations and internet attention during the periods of 2018-2019 and 2022-2023; however, no such correlation is evident during the interval from 2019 to 2022, indicating a significant misalignment (Figure 2).
Figure 2 Mismatch between resource endowment and internet attention of ice-snow tourism in southern region of China
The spatial mismatch index assessing the differences between the endowment level of ice-snow tourism resources and the internet attention received from the internet across 150 cities in southern China from 2018-2023 was computed using the formula (1). Building on prior research, this study categorizes the spatial mismatch into seven distinct types, positive high mismatch (SMI>4), positive moderate mismatch (2<SMI≤4), positive low mismatch (0<SMI≤2), negative low mismatch (-2<SMI<0), negative moderate mismatch (-4<SMI≤-2), negative high mismatch (SMI≤-4), equilibrium state (SMI=0). Positive mismatch indicates that the endowment of ice-snow tourism resources in a region surpasses the attention from the internet, suggesting that while regional tourism resources are being endowed, their appeal remains inadequate. Conversely, negative mismatch signifies that the abundance of regional tourism resources is insufficient compared to the attention from the internet, indicating that although these resources possess some attraction, there is a pressing need to enhance the supply of tourism resources. Table 1 detailed the cities with significant misalignment.
Table 1 Mismatch of ice-snow tourism in southern region of China
Year Item Positive mismatch Negative mismatch
Low Moderate High Low Moderate High
2018 Quantity 77 2 0 66 3 2
Specific city(s) Aba (3.29),
Ganzi (3.89)
0 Xiamen (-2.39), Guilin (-2.27), Zhangjiajie (-2.09) Shanghai (-5.68), Sanya (-4.15)
2019 Quantity 77 2 1 64 3 3
Specific city(s) Aba (2.69),
Ganzi (2.11)
Chengdu (4.76) Lijiang (-3.01), Xi’an (-2.67), Guilin (-2.26) Sanya (-5.43), Xiamen (-4.19), Zhangjiajie (-4.18)
2020 Quantity 62 3 0 83 2 0
Specific city(s) Aba (2.52), Shanghai (3.3), Chengdu (3.6) Xiamen (-3.67), Sanya (-2.26)
2021 Quantity 52 1 2 93 1 1
Specific city(s) Chengdu (3.14) Shanghai (4.65), Kunming (4.69) Xiamen (-2.98) Sanya (-4.52)
2022 Quantity 57 3 1 87 2 0
Specific city(s) Chengdu (2.16), Ya’an (2.44), Shanghai (3.24) Wuhan (4.19) Sanya (-3.01), Guilin (-2.07)
2023 Quantity 69 2 1 74 2 2
Specific city(s) Aba (2.23), Chengdu (2.83) Shanghai (4.70) Xi’an (-2.56), Huangshan (-2.01) Sanya (-11.6), Chongqing (-7.47)

Note: Due to the excessive number of mild cities, it is not specifically listed in order to improve the readability of the icon. The numbers in brackets indicate the spatial dislocation index of the city in that year.

The analysis of the data presented in the table indicates that during the years 2018-2019, the southern region experienced a higher number of cities exhibiting positive mismatch compared to those with negative mismatch. Furthermore, the levels of positive and negative mismatch remained relatively consistent across these two years. However, a significant shift occurred in 2020, resulting in a greater number of cities reporting negative mismatch than those with positive mismatch. This trend peaked in 2021, with negative mismatch reaching 63.3%, before gradually declining to 52% over the subsequent three years, suggesting a movement towards equilibrium. The dynamics of positive and negative mismatch in relation to the endowment of ice-snow tourism resources in the southern region, as well as their online visibility, are influenced by several factors. These include the existing winter tourism products in the region, the downturn in the tourism industry due to the COVID-19 pandemic, the impact of the 2022 Beijing Winter Olympics, and delays in tourism policy implementation and development. Despite the transition from a predominance of positive mismatch to a majority of negative mismatch, the difference between the two remains minimal, indicating a general state of balance.
There are seven cities exhibiting moderate or higher levels of positive mismatch: Aba Tibetan and Qiang Autonomous Prefecture (hereafter referred to as Aba), Ganzi Tibetan Autonomous Prefecture (hereafter referred to as Ganzi), Chengdu, Shanghai, Kunming, Wuhan, and Ya’an. Notably, Aba and Ganzi are mentioned frequently, as both are situated in the western Sichuan Plateau of Sichuan Province. In contrast to the southeastern coastal regions, these regions benefit from natural advantages such as high altitudes and diverse topography. The primary resources for ice-snow tourism include outdoor ski resorts and various ice-snow attractions. The endowment of these tourism resources began early, with the southern region possessing favorable climatic and topographical conditions.
However, despite leveraging these natural advantages, the region faces challenges such as a fragile economic basic, inadequate supporting infrastructure, and limited transportation access. The results in a reduced attractiveness of winter ice-snow tourism products and a lag in online visibility compared to the endowment of ice-snow tourism resources. Consequently, instances of moderate positive mismatch have been frequently observed. An analysis of temporal changes indicates a significant decline in the mismatch levels of both regions. Specifically, the dislocation index for Ganzi has decreased from 3.89 to a low of 0.83, approaching an average state, while Aba’s dislocation index has fallen from 3.29 to a minimum of 1.85, also indicating a significant reduction. The surge in ice and snow tourism following the 2022 Beijing Winter Olympics, along with the overall recovery of the tourism industry as the pandemic eases, has significantly heightened interest in winter tourism within the two regions. Furthermore, the growing popularity of the ‘West Sichuan Loop’ tourist route has contributed to this trend. Improvements in local infrastructure and enhancements in tourism products are key factors that have reduced negative impacts and boost the appeal of ice-snow tourism resources.
In 2021 and 2022, Kunming and Wuhan, respectively, experienced significant positive mismatch, which occurred only once every six years. Chengdu faced severe positive mismatch in 2019, followed by moderate positive mismatch from 2020 to 2023. Shanghai, on the other hand, encountered severe negative mismatch in 2018, moderate positive mismatch in 2020 and 2022, and severe positive mismatch in both 2021 and 2023. An analysis of the time series data for these four cities reveals that their spatial mismatch indexes were negative in 2018 and shifted to positive by 2023. Throughout the study period, the mismatch patterns of these cities exhibited considerable unstable, transitioning from negative to positive. Kunming, Wuhan, Chengdu, and Shanghai possess strong advantages related to their economic foundations, urban scales, locational characteristics, and the development of construction of supporting facilities, which help mitigate their disadvantages in natural conditions and the late timing of their resource endowment initiation. Prior to 2018, these cities primarily focused on conventional winter tourism projects, overlooking the potential of ice-snow tourism. As a result, the endowment of ice-snow tourism resources fell short of the inherent online interest typical of large urban centers, leading to a negative mismatch for all four cities. However, since 2019, these major cities have swiftly adapted to national policies and the increasing demand from southern tourists in winter ice-snow tourism.
The government has proactively organized events and festivals while also simultaneously endow with indoor ice-snow facilities, thereby swiftly harnessing on the potential of the ice-snow tourism sector. This initiative has culminated to the establishment of several high-quality indoor ice-snow tourism projects, resulting in a rapid development in the resource endowment of ice-snow tourism. Following the conclusion of the pandemic and the Winter Olympics, cities can be categorized into two distinct groups based on the progression of their tourism offerings. The first group includes cities such as Shanghai and Chengdu, which still experience moderate to severe positive mismatches or a gradual increase in positive changes. In contrast, the second group consist cities like Kunming and Wuhan, where the degree of positive mismatch is either stabilizing or experiencing a decline. The differences in the subsequent mismatch between these two groups can be attributed to various factors, including differences in policy guidance, delays in the endowment of tourism project, and the varying winter appeal of the cities’ tourism resources, is it to say that detailed analysis of individual cities is necessary.
There are ten cities exhibiting moderate to severe negative mismatch, specifically Xiamen, Guilin, Zhangjiajie, Shanghai, Sanya, Lijiang, Xi’an, Huangshan, and Chongqing. With the exception of Shanghai, which has been addressed in a prior discussion, the remaining cities have experienced prolonged periods of negative mismatch. This phenomenon indicates that the interest level of urban winter tourism surpasses the extent of resource endowment in ice-snow tourism. Most of these cities are well-known tourist destinations with established tourism resources. They already offer appealing winter tourism products, so ice-snow tourism is not essential for urban tourism growth. Thus, the winter tourism internet attention in these cities is primarily influenced by their existing tourism products rather than the degree of development of ice-snow tourism resources. For instance, Sanya has centered its tourism products around the concept of winter ‘cold escape tours’ maintaining its status as a favored winter tourism destination. The limited ice-snow tourism options do not diminish tourists’ interest in Sanya’s winter escape experiences.
Likewise, Lijiang has developed winter sightseeing routes that showcase the scenic beauty of Lijiang Ancient Town and Yulong Snow Mountain. While the quality of these core attractions in winter is commendable, their quantity remains limited. While Yulong Snow Mountain is listed among ice-snow attractions, it has been a year-round tourist site developed by Lijiang for many years, and no additional ice-snow tourism products have been created around it. Thus, the attention directed towards Lijiang’s winter tourism framework is only marginally affected by the endowment of ice-snow tourism resources. It is evident that a majority of these cities possess robust winter tourism offerings or exhibit a high degree of overall tourism development. Nevertheless, they have pursued the enhancement of ice-snow tourism resources for various reasons, including compliance with policy mandates and the influence of natural conditions. Interestingly, the focus of the city’s winter tourism network remains unaffected by the progress made in ice-snow tourism.
In a six-year analysis of 150 cities, 39 cities demonstrated moderate to severe mismatch, with Sanya recording the most significant mismatch value in 2023 at -11.6. This indicates that while most cities experience frequent changes in overall mismatch, however these changes are not significant. This phenomenon can be attributed to the relatively late onset of ice-snow tourism resource endowment in southern region. With the exception of those cities endowed with favorable natural climates and terrains, the resource endowment of ice-snow tourism has largely been concentrated around the period surrounding the Beijing Winter Olympics. The projects initiated during this time tend to be limited in variety, lacking in quality, and possess restricted appeal. Consequently, conducting comprehensive research on the types, characteristics, impacts, and interrelations of ice-snow tourism resource endowment in southern China, alongside with online engagement, could offer valuable insights for the future development of this sector in this area.

3.3 The discrepancy between ice-snow tourism endowment and urban tourism internet attention focus

Building upon the calculations and analyses presented in the preceding article, this study suggests categorizing cities in the southern region based on the temporal variations in the discrepancy between the resource endowment of ice-snow tourism and the corresponding internet attention focus from the urban tourism. This approach entails a comprehensive evaluation of the shifts in endowment levels, alterations in internet attention focus, and the resulting mismatch between these two factors. Ultimately, a total of 150 cities are classified into three distinct categories: priority endowment, active endowment, and inert endowment. Table 2 shows how this study classify cities according mismatch.
Table 2 Classify cities according mismatch
Category Cities ( prefectures/region) Total
Priority endowment Nanjing, Nantong, Taizhou, Yichang, Xiangyang, Huanggang, Enshi Tujia Autonomous Prefecture, Shennongjia Forest area, Pingxiang, Yibin, Ya’an, Meishan, Ganzi Tibetan Autonomous Prefecture, Aba Tibetan and Qiang Autonomous Prefecture, Guangyuan, Dazhou, Baoji, Yulin, Ankang, Hanzhong, Weinan, Xianyang, Baoshan, Qujing, Hefei, Chizhou, Xuancheng, Suzhou, Hangzhou, Huzhou, Changsha, Zhuzhou, Hengyang, Shaoyang, Qingyuan, Zhengzhou, Jiaozuo, Puyang, Luoyang, Xuchang, Xinxiang, Zhumaidan, Liupanshui, Anshun 44
Active endowment Wuxi, Xuzhou, Suzhou, Wuhan, Ezhou, Nanchang, Jiujiang, Ganzhou, Yichun, Xinyu, Chengdu, Luzhou, Tongchuan, Yan’an, Kunming, Wuhu, Fuyang, Huaibei, Bozhou, Bengbu, Jiaxing, Ningbo, Wenzhou, Xiangtan, Yiyang, Guangzhou, Shenzhen, Pingdingshan, Nanyang, Nanning, Wuzhou, Hezhou, Shanghai 33
Inert endowment Changzhou, Yangzhou, Lianyungang, Yancheng, Suqian, Huangshi, Shiyan, Xiaogan, Xianning, Shangrao, Fuzhou, Ziyang, Neijiang, Nanchong, Mianyang, Bazhong, Suining, Leshan, Guang’an, Xi’an, Shangluo, Lijiang, Zhaotong, Anqing, Lu’an, Ma’anshan, Huangshan, Tongling, Shaoxing, Jinhua, Lishui, Quzhou, Taizhou, Zhangjiajie, Yongzhou, Huaihua, Loudi, Xiangxi Autonomous Prefecture, Yueyang, Changde, Chenzhou, Zhuhai, Shantou, Foshan, Huizhou, Dongguan, Zhongshan, Shaoguan, Heyuan, Yangjiang, Maoming, Fuzhou, Xiamen, Quanzhou, Zhangzhou, Putian, Nanping, Haikou, Sanya, Chongqing, Anyang, Xinyang, Kaifeng, Shangqiu, Guiyang, Zunyi, Guilin, Guigang, Yulin, Liuzhou, Beihai, Baise, Chongzuo 73
Priority endowment type refers to the long-term changes in the spatial mismatch index that remain positive during urban tourism growth. This type of city started the resource endowment of ice-snow tourism earlier than other southern cities and continued to explore local resources throughout the study period. However, due to various issues like a lack of scientific guidance in its endowment planning and dispersion tourism projects, the tourism products developed less appealing, resulting in the resource endowment level of ice-snow tourism resources being higher than the city’s winter tourism interest. After 2021, many of these cities saw a decline in positive mismatch, with some even experiencing temporary negative values. This trend is linked to the recent shift towards more scientific, large-scale, and high-quality endowment in ice-snow tourism. The improved tourism products have led to a rise in the city’s winter tourism interest, reflecting a more successful outcome of ice-snow tourism endowment.
Active endowment type means that cities initially did not focus on ice-snow tourism but gradually started to introduce ice-snow tourism products over the years. As they endowed these resources, the interest in ice and snow tourism grew, leading to a shift in the spatial mismatch index from negative to positive. These cities typically have strong economies and favorable conditions like high population density, good transportation, and responsive policies. Once they recognized policy guidance and tourist demands, they quickly created various ice-snow tourism products, which were well-received, increasing the internet attention to the winter tourism in the city(s) improving the mismatch index.
Following the end of the 2022 Beijing Winter Olympics, this type of cities had followed two different paths. One path involves responding to policies around the Olympics by hosting various ice-snow festivals and events, which garner internet attention but fail to produce sustainable, high-quality ice-snow tourism products. As a result, the spatial mismatch index has declined, occasionally even turning negative again. The other path focuses on developing long-term ice-snow tourism projects, like ice-snow amusement parks and ice-snow venues, alongside events and festivals. This approach promotes the ongoing growth of high-quality ice and snow tourism, keeping the spatial dislocation index in a positive range.
The inert endowment type refers to the city that does not prioritize or attaches importance to the endowment of ice-snow tourism resources. Although these cities possess certain ice-snow tourism resources, the overall quantity of resources remains unchanged or experiences only minor fluctuations over extended periods. The level of ice-snow tourism resource endowment lags significantly behind the level of internet attention, or even does not affect the internet attention. In terms of the spatial mismatch index, such cities tend to fluctuate in the negative mismatch area for a long time or turn from positive to negative status. Generally, a transition from a positive to a negative spatial mismatch index indicates that the endowment in the quality of tourism resources result in a notable rise in internet attention received for the city.
However, a thorough examination of resource data reveals that the endowment of these tourism resources has not undergone significant optimization or development. The level of ice-snow tourism resource endowment mostly remains static or only increases slightly during the research period. It can be seen that the endowment and quality improvement of ice-snow tourism resources are not the fundamental reason for the increase in their internet attention. Such cities usually have rich winter tourism products or stable sources of tourists. In the planning of urban tourism resource development, they abandon the resource endowment of ice-snow tourism as the core competitive point and choose a tourism development path that is more suitable for themselves.

4 Discussion and conclusions

4.1 Discussion

This research paper systematically organizes and develop a database of ice-snow tourism resources in the south, thereby enriching the winter tourism products in the south through the endowment of ice-snow tourism. Furthermore, it classifies southern cities with ice-snow tourism into three types: priority endowment, active endowment, and inert endowment cities.
The three categories illustrate different ways the city can develop tourism. The urban tourism path is not something that can be fully copied. Each city cultivates its unique tourism identity based on its geographical location, natural resources, climate, economic landscape, and local traditions. Nevertheless, tourism resources may exhibit similarities within the same area. If a city’s resources do not offer unique advantages to attract visitors, some may choose to focus on ice-snow tourism to stand out. Cities that already have a strong position in their region or share similar tourism resources often decide to pursue ice-snow tourism based on their natural features and economic support. This approach aligns with tourism marketing strategies, aiming to create unique selling points. In southern regions, promoting ice-snow tourism as ‘off-season tourism’ or using unconventional travel ideas can rapidly gain attention and create a competitive edge. Enhancing the innovation in research and resource endowment, as well as the branding of ice-snow equipment, is essential for the continuous improvement of product quality and the added value within the industry. There is also a pressing need to nurture a group of leading enterprises alongside with specialized small and medium-sized enterprises in the ice-snow sector. Additionally, there is a need to bolster the infrastructure of ice-snow venues and facilities, elevate the standard of supporting services, diversify consumer products related to ice-snow, optimizing the consumption environment, refining the ice-now standard system, and driving the ice-snow economy to become a new area of growth.
The resource endowment of ice-snow tourism in the southern region remains in its early stage, with research indicating that its current influence on the urban economy is minimal. Therefore, the emphasis on endowing high-quality ice-snow tourism will be crucial for the establishment of future destinations. Traditional projects in this sector have historically depended on natural climatic conditions and geographical features. The establishment of outdoor ice-snow tourism necessitates significant investment, and suitable locations are limited in the low-latitude southern region. In recent years, leveraging advantages such as population density, economic status, and transportation accessibility, has lead southern region to develop indoor venues of varying sizes. This approach emphasizes low entry barriers, affordability, and less-time consuming in terms of building the venue, thereby providing foundational services that allow southern residents to engage with and appreciate ice-snow tourism, fulfilling tourists’ interests in ice-snow culture and sports. It is important to recognize that the southern region is extensive, and the role of internal factors in shaping its ice- snow tourism endowment cannot be overlooked. The southeastern area, characterized by low elevation and flat land, faces challenges regarding natural resources. However, it has a more advanced economy and focuses on building indoor ice-snow facilities and parks to attract nearby non-professional tourists. In contrast, the central and western regions, located at higher altitudes, have endowed several notable outdoor ski resorts aimed at attracting more experienced short-distance tourists from the south. These elements contribute significantly to the emergence of three distinct resource endowment models in the southern region.
The growth of ice-snow tourism in the southern region must consider psychological factors. Tourists from low- latitude areas are eager for ice-snow experiences, creating a demand in southern China. However, these tourists face psychological barriers that prevent them from fully engaging in ice-snow activities (Li and Liu, 2021). This results in a gap between online interest and actual participation. While southern tourists enjoy ice-snow sightseeing and cultural experiences, they hesitate to try sports like outdoor skiing, with safety concerns being a major issue (Zhang and Sun, 2023). When planning ice-snow tourism routes in the south, it is essential to focus on reducing entry barriers. Unlike traditional ice-snow destinations, the southern region should prioritize lower costs, shorter travel distances, and enhanced safety measures to boost its competitiveness in ice-snow tourism.
This study acknowledges several limitations. During the selection of internet attention keywords, the overall interest in ice-snow tourism within the southern region remains relatively low, which restricts the capacity to gather data using the ‘city+ice-snow tourism’ framework to substantiate and validate the findings. As a result, this research relies on ‘city+tourism’ data. Given the brief snow season characteristic of the southern low latitudes, the average internet attention data from January to February each year is employed as the internet attention index to illustrate the increasing interest of southern tourists’ interest in ice-snow tourism over the years. This methodology may facilitate a more in-depth exploration of how the growth of ice-snow tourism influences the overall tourism attention across various cities in the future. As ice and snow tourism in the south continues to developed and its attention increases year by year, in the future we may be able to use this method to have an in-depth discussion on the impact of the endowment of ice and snow tourism on the total amount of tourism attention in different cities, and transform the current relatively preliminary three-zone division into a five-zone division based on longer-tern and kore clearly fluctuating data, incorporating more influencing factors into the division indicators. Furthermore, when gathering information on ice-snow tourism resources in different cities, the seasonal nature of this type of tourism means that some tourism projects, particularly indoor and outdoor skating rinks may only operate in winter during certain years, making it hard to track their specific opening years. To mitigate this issue, this study excludes certain unverifiable data to ensure the accuracy of the overall dataset. Finally, the research period is limited to 2018-2023, due to the late start of ice-snow tourism industry in the southern region, challenges in data collection and other factors, expanding the research study are difficult to expand. Although a compelling panel dataset can be established, significant fluctuations occur because of impacts of COVID-19 in certain years. The challenges posed by the pandemic, coupled with the heightened online interest and demand spurred by the Beijing Winter Olympics, contribute to the unique research significance of this timeframe and offer insights for future long-term studies.

4.2 Conclusions

This study delineates the southern region of China using the ‘Qinling-Huaihe’ line and establishes a measurement index for ice-snow tourism that fits to low-latitude regions. It assesses the current endowment levels of ice-snow tourism destinations within southern cities. Through comprehensive data collection, 150 southern cities that have engaged in ice-snow tourism from 2018 to 2023 were identified, and their endowment level data over the years were compiled and analyzed. Utilizing ‘city + tourism’ as a keyword, the Baidu Index was employed to gather data on the internet attention received by the city. In alignment with the climatic characteristics of low-latitude regions, average data from January to February were selected for time series analysis. This data was then combined with the endowment level metrics of ice-snow tourism data to calculate the spatial mismatch index, allowing for an analysis of data characteristics and a classification of cities based on the degree of mismatch and their changes over time. The findings indicate that:
(1) During 2018-2023, the endowment level of ice-snow tourism in southern destinations generally increased, experiencing a deceleration in 2020 followed by a notable increase from 2021 to 2022. The fluctuations in the endowment levels of these destinations are influenced by various factors. Prior to 2018, the endowment was predominantly concentrated in the southwestern regions characterized by high altitudes or significant topographical variations, following a endowment path similar to that of high-latitude regions. Since 2018, the resource endowment of ice-snow tourism in the southern region has been steadily improving, with an annual increase in the number of related projects; however, the overall growth rate remains modest. The timeframe from 2019 to 2020 experienced a significant decline in the endowment of ice-snow tourism destinations due to the repercussions of COVID-19. In contrast, the period from from 2020 to 2022, saw a revitalization of this sector, largely driven by the Beijing Winter Olympics, as various regions actively engaged with government initiatives to enhance ice-snow tourism, resulting in a significant surge in development levels, peaking during this timeframe. Following the period after the 2022 Beijing Winter Olympics, the growth of ice-snow tourism in the southern region is continued however at a much slower rate.
The southern region has developed various resource endowment trajectories influenced by its internal regional disparities, with distinct types of ice-snow tourism resources exhibiting varying levels of resilience to risks. Traditional ice-snow facilities, like outdoor ski resorts and large indoor venues, require significant investment and time to build, and they remain stable over time with less market influence, they also have a long planning and construction cycles and long-term existence after completion. While they have development lags, they are less affected by demand and are more resilient. In contrast, the Southern region has seen the emergence of new indoor small ice skating rinks and indoor dry ski resorts that are attached to large shopping malls. These newer venues require shorter construction periods, lower investments, and exhibit greater adaptability to market conditions, the market and demand have a greater influence on this sector, rendering it more susceptible to external factors. In contrast, outdoor venues as well as ice and snow attractions tend to endure over the long term.
(2) Between 2018 and 2023, internet attention received by cities in winter tourism in southern China generally followed an ‘up-down-up’ pattern. It hit a low point between 2020 and 2022 but saw a quick recovery from 2022 to 2023. Prior to 2020, as people’s disposable income in China rose, their interest in tourism also grew. However, this interest dropped significantly from 2020 to 2022 due to the effects of COVID-19. Following the successful Beijing Winter Olympics and the reinstatement of unrestricted travel, there was a notable spike in interest towards winter tourism in southern cities. It is important to note that, due to seasonal nature of ice-snow tourism, the impact of the Olympics, which concluded in February 2022, were only seen in the following winter season of 2023. The shifts in internet attention reflect the changing demands of tourists in southern China for winter tourism. While internet attention has been rising, it remains lower than that of traditional winter tourism spots in higher latitudes, indicating that southern China still has much work to do in developing its winter ice-snow tourism.
(3) There is a spatial mismatch between the growth of ice-snow tourism in the southern regions and the attention it garners. This mismatch follows a pattern where positive mismatch is found in the northwest and negative mismatch in the southeast. Over time, the negative mismatch has intensified and now surpasses the positive mismatch. Additionally, the issues with positive mismatch are more severe. The demand for ice-snow tourism in the south is high, yet the endowment level remains behind, although it has entered a phase of accelerated growth. Research indicates that people in the southern regions are keen to engage in ice-snow tourism; however, the existing resource endowment level is insufficient, resulting in a low mismatch index for internet attention. It can be seen that it is a great significance to endowed ice-snow tourism resources and build ice-snow tourism destinations in the southern region according to their local conditions.
Currently, cities in the southern region can be classified into three distinct categories based on the extent of ice-snow tourism resource endowment and the level of internet attention received by the cities: priority endowment, active endowment, and inert endowment. Cities categorized as priority endowment typically possess favorable conditions for ice-snow tourism, including suitable altitude, terrain, and a solid economic foundation. Furthermore, these cities prioritize ice-snow tourism as a central component of their urban tourism strategy and implement supportive policies to facilitate its growth. Many cities are now shifting towards a focus on priority endowment after a phase of no endowment, which has helped to lower the spatial mismatch. In contrast, active endowment cities, is for those cities which initiated their ice-snow tourism efforts later, however have experienced rapid growth.
[1]
Allison E A. 2015. The spiritual significance of glaciers in an age of climate change. Wiley Interdisciplinary Reviews: Climate Change, 6(5): 493-508.

[2]
Buhalis D, Law R. 2008. Progress in information technology and tourism management: 20 years on and 10 years after the Internet—The state of e-tourism research. Tourism Management, 29(4): 609-623.

[3]
Cai W Y, Yu J, Yang W. 2023. The spatial synergy of the ice-snow tourism industry and its related industries in Jilin Province. Sustainability, 15(16): 12272. DOI: 10.3390/su151612272.

[4]
Fischer A, Olefs M, Abermann J. 2011. Glaciers, snow and ski tourism in Austria’s changing climate. Annals of Glaciology, 52(58): 89-96.

[5]
Hamid R A, Albahri A S, Alwan J K, et al. 2021. How smart is e-tourism? A systematic review of smart tourism recommendation system applying data management. Computer Science Review, 39: 10337. DOI: 10.1016/j.cosrev.2020.100337.

[6]
Jin S H, Yang J, Wang E X, et al. 2020. The influence of high-speed rail on ice-snow tourism in northeastern China. Tourism Management, 78: 104070. DOI: 10.1016/j.tourman.2019.104070.

[7]
Landauer M, Pröbstl U, Haider W. 2012. Managing cross-country skiing destinations under the conditions of climate change—Scenarios for destinations in Austria and Finland. Tourism Management, 33(4): 741-751.

[8]
Li F, Wu F, Li Y, et al. 2023. Ecological carrying capacity and ecological footprint of ski tourism: A case of north slope region of Tianshan Mountain. Polish Journal of Environmental Studies, 32(6): 5551-5561.

[9]
Li P, Liu W. 2021. Research on the participation of Chinese sports cultural elite in ice and snow sports. Frontiers in Public Health, 9: 820765. DOI: 10.3389/fpubh.2021.820765.

[10]
Litvin S W, Goldsmith R E, Pan B. 2008. Electronic word-of-mouth in hospitality and tourism management. Tourism Management, 29(3): 458-468.

[11]
Liu S Y, Guo Q E. 2023. Image perception of ice and snow tourism in China and the impact of the Winter Olympics. Plos One, 18(6): 1-23.

[12]
Pourfakhimi S, Duncan T, Coetzee W. 2020. Electronic word of mouth in tourism and hospitality consumer behaviour: State of the art. Tourism Review, 75(4): 637-661.

[13]
Scott D, McBoyle G, Minogue A, et al. 2006. Climate change and the sustainability of ski-based tourism in eastern north America: A reassessment. Journal of Sustainable Tourism, 14: 376-398.

[14]
Son J Y, Han J H, Kim S C, et al. 2023. Korean adolescent suicide and search volume for “self-injury” on internet search engines. Frontiers in Psychiatry, 14: 1186754. DOI: 10.3389/fpsyt.2023.1186754.

[15]
Stanton A, Katz S J. 2021. Internet search results correlate with seasonal variation of sarcoidosis. BMC Pulmonary Medicine, 21(1): 227. DOI: 10.1186/s12890-021-01602-7.

[16]
Steiger R, Scott D. 2020. Ski tourism in a warmer world: Increased adaptation and regional economic impacts in Austria. Tourism Management, 77: 104032. DOI: 10.1016/j.tourman.2019.104032.

[17]
Tang C C, Yang Y Y, Liu Y R, et al. 2023. Comprehensive evaluation of the cultural inheritance level of tourism-oriented traditional villages: The example of Beijing. Tourism Management Perspectives, 48: 101166. DOI: 10.1016/j.tmp.2023.101166.

[18]
Trawöger L. 2014. Convinced, ambivalent or annoyed: Tyrolean ski tourism stakeholders and their perceptions of climate change. Tourism Management, 40: 338-351.

PMID

[19]
Wang S J, Zhou L Y. 2019. Integrated impacts of climate change on glacier tourism. Advances in Climate Change Research, 10(2): 71-79.

[20]
Wu W W, Lu Y L, Zhang C Y. 2010. Synergy mechanism and measurement of ice and snow tourism resources value. Melbourne, Australia: 2010 International Conference on Management Science & Engineering 17th Annual Conference Proceedings: 779-786.

[21]
Xue C H, Bai Y P. 2023. Spatiotemporal characteristics and factors influencing urban tourism market network in western China: Taking Chengdu as an example. Sustainability, 15: 8135. DOI: 10.3390/su15108135.

[22]
Yang J P, Wang Y X, Tang F, et al. 2023. Ice-and-snow tourism in China: Trends and influencing factors. Humanities and Social Sciences Communications, 10: 826. DOI: 10.1057/s41599-023-02288-4.

[23]
Yu J, Cai W Y, Zhou M L. 2022. Evaluation and prediction model for ice-snow tourism suitability under climate warming. Atmosphere, 13: 1806. DOI: 10.3390/atmos13111806.

[24]
Zhang P, Sun J T. 2023. Demand and influencing factors of ice-snow sports tourism products using heterogeneous network. AIMS Mathematics, 8(6): 13647-13662.

[25]
Zhang Y, Jin X, Liu R T, et al. 2024. Spatio-temporal variation and influencing factors of aero-sports tourism internet attention in Shaanxi Province, China. Heliyon, 10: e34246. DOI: 10.1016/j.heliyon.2024.e34246.

[26]
Zhao Y, Wang Z G, Yong Z W, et al. 2023. The spatiotemporal pattern evolution and driving force of tourism information flow in the Chengdu-Chongqing City Cluster. ISPRS International Journal of Geo-Info- rmation, 12: 414. DOI: 10.3390/ijgi12100414.

[27]
Zhu Y G, Li Q, Ying Z P, et al. 2023. Model of deep information environmental factors on the development of ice and snow sports. Ecological Chemistry and Engineering, 30(1): 133-139.

Outlines

/