Ecotourism

Tourist Satisfaction with Panjin Red Beach Based on Online Comments

  • GAI Xuerui , 1, * ,
  • LI Jiahui 1 ,
  • HU Xinyao 2
Expand
  • 1. School of Tourism Management, Shenyang Normal University, Shenyang 110034, China
  • 2. Master of Education Graduate School, Shenyang Normal University, Shenyang 110034, China
* GAI Xuerui, E-mail:

Received date: 2024-12-20

  Accepted date: 2025-03-10

  Online published: 2025-05-28

Supported by

Basic Research Project of Liaoning Provincial Department of Education(LJKMZ20221469)

Economic and Social Development Research Project of Liaoning Province(2024Lsbkt-104)

Abstract

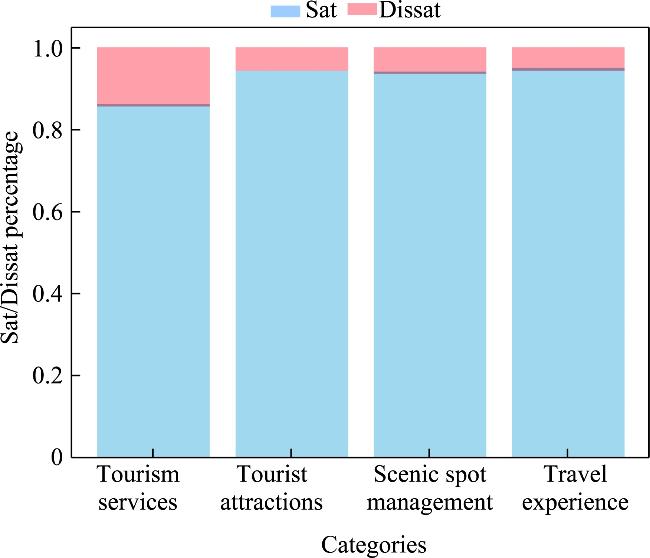
Tracking and investigating tourist satisfaction and accurately identifying the key factors that affect tourist satisfaction have always been among the top priorities for academia and tourist attraction operators. With the rise of online travel, analysis based on online comments has become an important method for tracking and surveying tourist satisfaction. This article examined the online comments of tourists for the Panjin Red Beach Scenic Corridor Scenic Area (hereinafter referred to as Red Beach) on Ctrip as an example. Using natural language processing to classify the tourist evaluations into topics, the main topics of concern were identified as tourism services, tourism attractions, scenic area management, and tourism experience. Through the 5-level rating of Ctrip’s online gaming customer satisfaction, an analysis was conducted on tourist satisfaction and the topics of greatest concern to the tourists were ranked. The results showed that the satisfaction levels from high to low are: tourism experience, tourism attractions, scenic area management, and tourism services. Therefore, satisfaction with related content under the service topic was the lowest so this aspect urgently needs to be improved and enhanced.

Cite this article

GAI Xuerui , LI Jiahui , HU Xinyao . Tourist Satisfaction with Panjin Red Beach Based on Online Comments[J]. Journal of Resources and Ecology, 2025 , 16(3) : 868 -874 . DOI: 10.5814/j.issn.1674-764x.2025.03.022

1 Introduction

Tourism has become an indispensable part of people’s daily lives, and China now has the world’s largest domestic tourism market (Dai, 2024). The satisfaction of tourists with scenic spots not only directly reflects their influence and competitiveness in the tourism market but also provides a direct reference for the formulation of sustainable development strategies, which is one of the important issues in the current development of scenic spots (Zhao and Chen, 2019). The factors affecting tourist satisfaction have always been a core issue of concern in academia. Currently, the evaluation of tourist satisfaction mainly uses questionnaire surveys (Cai, 2016; Zhou and Zheng, 2016), and IPA analysis methods are used to evaluate tourist satisfaction, propose tourist satisfaction improvement models (Chen et al., 2022; Shi et al., 2024) and construct satisfaction index evaluation models (Wang et al., 2015), which have played a positive role in promoting research on satisfaction.
Before the era of big data, questionnaire surveys were necessary and feasible, and they could provide good guidance for the development of scenic spots. However, since they allow researchers to pre-set dimensions and influencing factors of the data, collecting data through questionnaire surveys inevitably has strong subjectivity. In order to overcome this drawback, online text analysis methods have emerged and been applied in tourism research thanks to the new trend of tourism big data development (Li et al., 2018). Online text analysis methods are more commonly used in the fields of hotels and homestays, while research on online comments for national parks and scenic spots is relatively scarce. For example, scholars have conducted sentiment analysis on the constituent elements of the Lingering Garden by establishing a domain dictionary (Liu and Huang, 2021). Another study investigated the image recognition of Suzhou gardens, a world cultural heritage site, from the perspective of foreign tourists (Ma and Zhang, 2022). However, these research methods rely too much on dictionary quality and their universality needs to be improved, otherwise this method may fail to uncover deeper patterns within the data and provide results that are relatively singular.
To better address the above issues, this article proposes a satisfaction research method based on LDA (Latent Dirichlet Allocation). By clustering the topics in online comments through LDA and combining them with specific factors that affect satisfaction, the effective extraction of management and service shortcomings in the Red Beach scenic area can be achieved, so this approach can provide a solution to those problems and a basis for scenic area operators to make specific decisions.

2 Research area and LDA model

2.1 Research area

The Red Beach is in Zhaoquanhe Township, Dawa County, Panjin City, Liaoning Province, China. It is the largest natural scenic spot in the Liaohe River Nature Reserve and attracts the most tourists from both inside and outside the province. Red Beach is the most important component of the wetlands in the Liaohe River Delta, with a total area of 130 km2. It is home to the most important tourist attraction, the Suaeda salsa plant, as well as reed marshes and artificial rice fields. It features 260 species of birds, including red crowned cranes and black billed gulls. In 1985, this area was listed as a city level nature reserve, was later upgraded to a provincial level reserve in 1987, and then promoted to a national level nature reserve in 1988. The reserve preserves a typical and complete coastal wetland ecosystem and natural succession landscape pattern of China’s warm temperate zone, and it is the most complete ecological block of temperate estuarine wetland vegetation types in the world. On January 7, 2020, Red Beach was officially designated as a national 5A level scenic spot by the Ministry of Culture and Tourism, with an annual reception of 400000 tourists.
Statistics show that from October 1 to 7, 2024, Red Beach received over 200000 visitors from both inside and outside the area. Based on of the booming “National Day” market in 2023, the number of visitors increased by 9.5% year- on-year and the reserve received over 30000 visitors in each day for four consecutive days. Meanwhile, on the Ctrip website, the popularity of Red Beach has reached a rating of 6.6, making it one of the main tourist destinations for ecotourism. The influence of Red Beach will become increasingly significant in ecological protection and the dissemination of ecological civilization.

2.2 LDA model

2.2.1 Basic concept of LDA

LDA is a topic model based on Bayesian learning proposed by Blei et al. (2003), and it is an extension of latent semantic analysis and probabilistic latent semantic analysis. LDA is widely used in fields such as text data clustering, computer vision, and bioinformatics processing.
LDA is essentially a probabilistic graphical model. Figure 1 shows the plate notation of LDA as a probabilistic graph model. The nodes in the figure represent random variables, the solid line nodes represent observed variables, the dashed line nodes represent latent variables, and the arrows represent probability dependencies. The rectangles (blocks) represent repetition, and the numbers inside the blocks (shown as K and M) represent the numbers of repetitions.
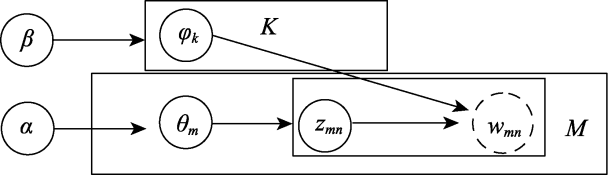
Figure 1 Block representation of LDA probabilistic graph model

Note: Nodes α and β are hyperparameters of the model, where node φk represents the word distribution parameter of the topic, node θm represents the topic distribution parameter of the text, node zmn represents the topic, and node wmn represents the word. K is the number of topics and M is the total number of online texts (the same notation is used below).

For a collection of online texts, the observable known variables are wmn, and the prior parameters given based on experience are α and β. The other variables are unknown hidden variables that need to be learned and estimated based on the observed variables. According to the LDA probability graph model shown in Figure 1, the full LDA model is a joint probability distribution composed of observed variables and latent variables, which can be expressed as:
p w , z , θ , φ | α , β = k = 1 K p φ k | β m = 1 M p θ m | α n = 1 N m p z m n | θ m p w m n | z m n , φ
where the observed variable wrepresents the word sequence in all texts, the latent variable zrepresents the topic sequence in all texts, the latent variable θrepresents the parameter of the topic distribution in all texts, the latent variable φrepresents the parameter of the word distribution in all topics, and α and β are hyperparameters. In formula (1), p( φ k | β) represents the probability of generating the parameter φ kfor the word distribution of the k-th topic under the given condition of hyperparameter β, p( θ m | α) represents the probability of generating the parameter θm for the topic distribution of the m-th text under the given condition of hyperparameter α, p( z m n | θ m) represents the probability of generating z m n, where z m nrepresents the topic at the n-th position of the m-th text, under the given condition of topic distribution θ m, and p( w m n | z m n , φ) represents the probability of generating the word w m n, where w m nrepresents the topic at the n-th position of the m-th text, under the given condition of topic z m nand all topic word distributions. The parameter K is the number of topics and M is the total number of online texts.
The joint probability distribution of the m-th text can be expressed as:
p w m , z m , θ m , φ | α , β = k = 1 K p φ k | β p θ m | α n = 1 N m p z m n | θ m p w m n | z m n , φ
where w m represents the word sequence in the text, z m represents the topic sequence of the text, θ m represents the topic distribution parameter of the text, and z m nrepresents the topic at the n-th position of the m-th text.
The probability of generating the m-th text is:
p w m | θ m , φ = n = 1 N m k = 1 K p z m n = k | θ m p w m n | φ k
The probability of generating m texts under the given hyperparameters α and β is:
p w m | α , β = k = 1 K p φ k | β p θ m | α n = 1 N m l = 1 K p z m n = l | θ m p w m n | φ l d θ m d φ k
The probability of generating all texts under the given hyperparameters α and β is:
p w | α , β = k = 1 K p φ k | β m = 1 M p θ m | α n = 1 N m l = 1 K p z m n = l | θ m p w m n | φ l d θ m d φ k
The LDA model is a probabilistic graph model that includes the word distribution of each topic, the topic distribution of each text, and the topic at each position of the text as latent variables, while the words at each position of the text are observed variables. The learning and inferences of LDA models cannot be solved directly, so Gibbs sampling and a variational EM algorithm are usually used. The former is a Monte Carlo method, while the latter is an approximation algorithm (Li, 2022). This study used Gibbs sampling.

2.2.2 Gibbs sampling

Gibbs sampling is a commonly used Markov chain Monte Carlo method. To estimate the joint distribution p(x) of a multivariate random variable x, Gibbs sampling selects one component of x and fixes the other components. Random sampling is performed according to its conditional probability distribution, and this operation is repeated for each component to obtain a random sample of the joint distribution p(x).
The Gibbs sampling algorithm avoids using the actual parameters to be estimated and instead samples the topic of each word. Once the topic of each word is determined, the parameters can be calculated after counting the word frequencies (Zhu et al., 2024).

3 Data sources and data processing

3.1 Source of data

Ctrip is a well-known tourism brand in China that is committed to providing one-stop global travel services for travelers, including accommodation booking, transportation ticketing booking, travel vacation booking, and business travel management services. Its service scope covers the entire travel process, including pre-trip, during trip, post-trip, and destination services. Through a transaction network consisting of apps, websites, and 24/7 customer service centers, it achieves a perfect connection between users and products, providing travel services to hundreds of millions of travelers every year. According to searches on the Ctrip website, our preliminary assessment found that the tourist review data is detailed and of good quality. Therefore, this study used Ctrip as the data source for analysis. By using octopus to obtain online comment data from Red Beach tourists, a total of 3090 reviews were obtained for the past 9 years, from October 16, 2015, to June 28, 2024. Before data processing, data denoising was performed to reduce interference with topic clustering. It was also necessary to clean the collected comments by removing duplicate comments, redundant punctuation marks, and meaningless text, ultimately yielding 2944 comments.

3.2 Data processing

The most important step for achieving good results in LDA topic clustering is data processing. This study took two steps to process the data. First, the text was segmented using an open-source Python library, the Jieba library. The Jieba library uses two segmentation methods, a dictionary-based segmentation method and a hidden Markov model-based segmentation method. After segmentation, a total of 62364 words were obtained. Second, the stop words were identified. This study started with the stop word list released by Harbin Institute of Technology, which contains a total of 767 stop words. Based on the processing results of this study, it was necessary to further expand the basic stop word list, by including the high-frequency words that appeared in the text for this study, such as ‘ah ah’ and ‘good good’, which are not helpful for clustering the Red Beach topics. In general, the stop word list needs to be expanded to better eliminate the stop words relevant to any given study. After the above data processing steps, the quality of data used for topic classification had been greatly improved.

4 Data analysis

4.1 Topic classification

This study used LDA to cluster the vocabulary of online comments on Ctrip. The initial values of the topics were set to α=0.5, β=0.1, and K=10. The number of iterations for Gibbs sampling was set to 50. In the process of topic clustering estimation, the number of topics K was assigned as 10, 9, 8, 7, 6, 5, 4, 3, 2, and 1. After multiple estimations of dynamic parameter adjustments and an analysis based on the observed pyLDAvis visualization effect, the optimal number of topics (K=4) was finally obtained. The pyLDAvis visualization results obtained are shown in Figure 2.
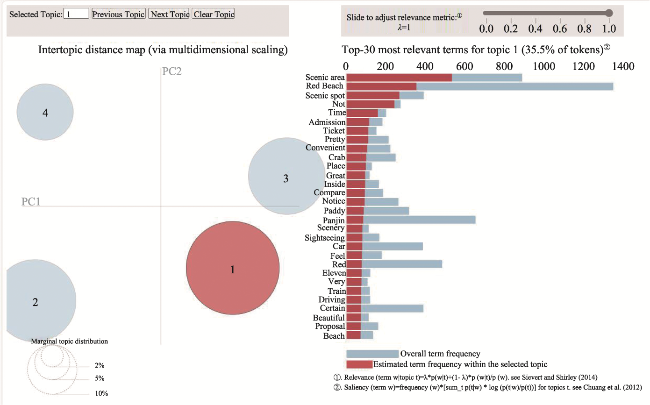
Figure 2 Visualization of topic clustering for online comments by Red Beach tourists using PyLDAvis
In Figure 2, the circles represent the clusters of Topics. Note that the four circles are not merged and are far apart, indicating that the clustering effect of Topics is very good. In using this tool, when selecting Topic 1, the corresponding circle will turn red and the keywords in that Topic will also be displayed, as shown in the column list on the right. The frequency of each keyword word is represented by the length of the red bar. PyLDAvis visualization can help Red Beach operators to visually view the distributions of keywords under various Topics.
Previous studies have shown that statistical analysis based on topic word clustering has great practical value (Zhao and Chen, 2019). This approach is not only helpful for understanding the logical relationships of the context of online text content, but also for deep level clustering of intrinsic topics in online text and the precise exploration of specific problems that urgently need to be solved in scenic spots. Based on these significant topics that are closely related to tourist satisfaction, this study referred to the topic classification of relevant scholars, i.e., tour guide, service, satisfaction, etc. On this basis, it also drew on the empirical classification method of Ma and Zhang (2022). First the LDA topic classification was adopted, and then manual content analysis was used to adjust and refine it. The combination of the speed of artificial intelligence and the experience of researchers can fully leverage the advantages of both natural language processing and human subjective intuition, to obtain optimized data quickly and effectively. Based on LDA topic clustering, five tourism experts and five tourism graduate students were selected to name the topics, and analyze, discuss and adjust the topic words. The researchers ultimately determined four topics and their contents: Topic 1 Tourism Services, Topic 2 Tourist Attractions, Topic 3 Scenic Spot Management, and Topic 4 Travel Experience, as shown in Table 1.
Table 1 Topic classification and corresponding topic words for online comments from Red Beach tourists
Topic Topic 1: Tourism services Topic 2: Tourist attractions Topic 3: Scenic spot management Topic 4: Travel experience
Topic words Documented frequency value Topic words Documented frequency value Topic words Documented
frequency value
Topic words Documented frequency value
1 Service 0.060 Red 0.032 Scenic spot 0.085 Recommend 0.063
2 Ticket 0.022 Crab 0.031 Red beach 0.065 Interesting 0.051
3 Train 0.012 Wetland 0.030 Management 0.039 Pretty good 0.048
4 Sightseeing car 0.011 Suaeda salsa 0.026 Wetland 0.030 Experience 0.045
5 Strengthen 0.009 Paddy 0.019 Environment 0.023 Okay 0.034
6 Attitude 0.008 Beach 0.018 Staff 0.014 Interesting 0.027
7 Self-driving tour 0.007 Food 0.016 Convenient 0.012 Spectacular 0.022
8 Guide 0.006 Reed marshes 0.011 Destruction 0.005 Cost performance 0.018
9 Improve 0.005 Water bird 0.008 Degradation 0.001 Favorable comment 0.011
The analysis in Table 1 shows that the clustering logic relationships between Topic 1, Topic 2, Topic 3, and Topic 4 are very clear. For example, the tourism service topics mainly include convenience, ticketing, discounts, and transportation, with words such as convenience, tickets, purchasing, and sightseeing buses. The topic of tourist attractions includes typical attractions in Red Beach scenic areas such as wetlands, rice fields, alkali grass, reed marshes, and red crowned cranes. Scenic spot management mainly focuses on the current situation of management and protection of Suaeda salsa, such as red beaches, management, staff, and degradation. The topic of travel experience mainly includes feelings and recommendations about visiting Red Beach, such as spectacular, interesting, positive reviews, and recommendations.
Tourism services are the most basic element for tourists undertaking tourism activities, and they run through the entire process of tourism activities. From the perspective of tourists, the most direct and effective way to appreciate natural scenery is to see and interact with nature, such as the red color of the Red Beach, as well as the crabs, alkali grass, reed marshes, and rice fields, which are various tourist attractions with strong attraction and interest among tourists. Travel experience is the most important activity for tourists, and it requires exposure, perception, and evaluation to form the final evaluation of tourism satisfaction. Scenic spot management is the cornerstone for the optimal implementation of these three topics.

4.2 Satisfaction analysis

Ctrip provides two channels that tourists can use to evaluate their travel experience: satisfaction rating and text comments. The comments of tourists in online texts have implicit characteristics and require natural language processing. This study selected LDA for topic classification, which involves overall clustering. The satisfaction rating has explicit characteristics, and tourists can directly evaluate their travel experience through a 5-point rating system (1 to 5 points), which involves specific evaluation. The text comments were divided into four topics: tourism services, tourism attractions, scenic area management, and travel experience. In this study, if tourists gave ratings of 4 and 5, they were classified as satisfied, with scores of 1 to 3 indicating that tourists were dissatisfied with the tourism service. Based on the excavated topics, a tourist satisfaction response map was drawn (Figure 3) for the classification of online comments by Red Beach tourists, which can be used to intuitively understand which topic content made the tourists satisfied or dissatisfied. This study extracted, classified, and analyzed the content of online comments from Red Beach tourists by topic, which yielded 529 service keywords, 1536 tourism attraction keywords, 1645 scenic area management keywords, and 1726 tourism experience keywords. The frequencies of keywords indicate that the most attractive aspect for tourists is the travel experience, followed by attention to scenic spot management, tourism attractions, and finally tourism services.
Figure 3 Satisfaction response chart of online topic classification for Red Beach tourist comments
Figure 3 shows that the lowest satisfaction level among tourists towards the Red Beach scenic area is service, accounting for 86.2%. The remaining three satisfaction levels, from low to high, are scenic area management, tourist attractions, and travel experience, accounting for 94.3%, 94.8%, and 94.9%, respectively. The highest level of dissatisfaction is also with the service, accounting for 13.8%. The remaining three areas of dissatisfaction, from high to low, are scenic area management, tourist attractions, and travel experience, accounting for 5.7%, 5.2%, and 5.1% respectively. Compared to satisfaction, the unsatisfactory topics have greater significance for improving the quality of scenic spots. Carefully reviewing the original text related to the topic of tourism services shows that there are nearly a thousand pieces of data related to keywords such as tickets, transportation, and services. For example, Comment A: “The cost-effectiveness of the scenic area, I feel that the tickets and various services are a bit expensive.” Comment B: “Passing by Panjin Red Beach, I heard that the scenery was very beautiful before, so I went there and it was indeed good. The hygiene environment of the scenic area is 5 points, and the road to Panjin to the scenic area still needs improvement.” Comment C: “Giving three stars is mainly not for the scenery, but for the service and management.” Comment D: “The relationship between the Red Beach and tides is very close, but the scenic area does not provide detailed tide tables in this regard, which looks very unprofessional.”

5 Discussion and conclusions

5.1 Discussion

This study proposes a new method for analyzing tourist satisfaction. Previous methods based on online text satisfaction research mostly either used sentiment analysis instead of satisfaction (Li et al., 2013; Wu et al., 2017; Feng et al., 2021) or constructed a tourist satisfaction evaluation index system (Sun et al., 2022). In the field of tourism, emotions are generally divided into two opposite dimensions, namely positive emotions and negative emotions, and tourist satisfaction or dissatisfaction is inferred based on those positive and negative emotions. The traditional view holds that positive emotions have a positive impact on tourist satisfaction, while negative emotions have a negative impact. Many studies have shown that emotions are an important factor affecting consumer satisfaction (Oliver, 1993; Lai et al., 2024), and some believe that positive and negative emotions have different effects on consumer satisfaction (Oliver, 1993). Consumers who experience positive emotions have higher satisfaction, while those who experience negative emotions have lower satisfaction. Emotion analysis mainly focuses on analyzing the positive or negative emotional tendencies expressed in online textual viewpoints, namely either positive or negative emotions (Liu, 2022). Satisfaction is the result of the tourists' perception of a series of events that occur during their interactions at the tourist destination, which stems from the vacationer’s personality and what they consider to be important vacation goals (Chris, 2012). However, the logic of simply identifying the positive and negative aspects of sentiment analysis and treating them as the level of satisfaction through sentiment analysis and satisfaction analysis is debatable.
This study adopted the method of Natural Language Processing, which is an important direction for online text analysis in the future. The application of natural language processing is widely used in documents and auto completion, and it can be further divided into product comment classification, knowledge extraction, and truth checking (Hobson et al., 2021). The natural language processing method used in this study is based on statistical machine learning, which has much better accuracy and stability compared to rule-based methods. Statistical machine learning based methods are currently an important method for text classification (Che et al, 2023), and LDA models are the main research method for text classification. In traditional tourism research, pre-defined research paradigms are often used to study tourist concerns, and they rely on mature scales for questionnaire surveys and statistical analysis. Even when using mixed research methods, such as qualitative research and quantitative research, pre-defined patterns are used as the framework for the research. Obtaining tourist travel experiences and focal points that are not predefined has always been a challenge in traditional tourism research, so this study provides a useful methodological supplement to the tourism research paradigm.
This study has some limitations. For example, the number of online travel agencies selected should be expanded. This study only selected the Ctrip travel agency, but there are other similar online travel websites, such as Meituan and Dianping. Whether the research results would be limited by the category of the website, user characteristics, and comments remain to be further tested. Furthermore, this study on satisfaction used tourist online ratings directly, but the usefulness of online comments still needs further testing. Finally, this article used the Red Beach Scenic Area as an example. The Red Beach Scenic spot only represents ecological scenic areas, and different types of scenic areas tend to be complex, diverse, and unique. Whether the method explored in this study is applicable to other types of scenic areas is a direction worth investigating further.

5.2 Conclusions

The LDA model was used to classify the topics of tourist online comment data and obtain the frequencies of topic words. By examining online comment data on hot topic keywords, the topics that affect tourist satisfaction in the Red Beach scenic area were found to be: Topic 1 Tourism services, Topic 2 Tourism attractions, Topic 3 Scenic spot management, and Topic 4 Travel experience. The attention to tourism services was the lowest, but in terms of the proportion of satisfaction, the satisfaction with tourism services was the lowest. Although tourists are satisfied with the management of the scenic spot, many of them are worried about the ecological environment of Red Beach. As the main tourist attraction of Red Beach, Suaeda salsa has been affected by both human factors and extreme climate change, resulting in reductions in its distribution area and vibrant colors, which need to be strongly protected by scenic area managers.
[1]
Blei D M, Ng A Y, Jordan M I. 2003. Latent Dirichlet allocation. Journal of Machine Learning Research, 3: 993-1022.

[2]
Cai Q Y. 2016. High winged analysis of factors and mechanisms influencing tourist satisfaction in garden expo park: An empirical study based on structural equation modeling. Chinese Garden, 32(8): 58-64. (in Chinese)

[3]
Che W X, Dou Z C, Feng Y S, et al. 2023. Natural language processing in the model age: Challenges, opportunities, and development. Chinese Science: Information Science, 53(9): 1645-1687. (in Chinese)

[4]
Chen X Y, Xu S Y, Tang C C, et al. 2022. Evaluation and promotion model of tourist satisfaction in ice and snow tourism destinations. Journal of Resources and Ecology, 13(4): 635-645.

DOI

[5]
Chris R. 2012. Research methods in tourism science. Beijing, China: Tourism Education Press.

[6]
Dai B. 2024. Accelerating the construction of a strong tourism country and promoting high-quality development of the tourism industry. Red Flag Manuscript, (12): 25-28. (in Chinese)

[7]
Feng K, Yang Q, Chang X Y, et al. 2021. Customer satisfaction evaluation of fresh e-commerce based on online comments and random dominance criteria. China Management Science, 29(2): 205-216. (in Chinese)

[8]
Hobson L, Cole H, Hannes M. 2021. Practical application of natural language processing. Beijing, China: People’s Posts and Telecommunications Press.

[9]
Lai X F, Xie J Q, Wang X R. 2024. Quality factors of rural tourism scenic spots and their impact on tourist satisfaction: Kano model based on interpretable neural networks (Online). Tourism Science. DOI: 10.16323/j.cnki.lykx.20241018.001. (in Chinese)

[10]
Li H. 2022. Machine learning methods. Beijing, China: Tsinghua University Press. (in Chinese)

[11]
Li Q, Li S B, Wang A H, et al. 2018. Evaluation and analysis method of floating ticket system in scenic spots based on online comment data. Science, Technology and Engineering, 18(1): 273-279. (in Chinese)

[12]
Li Y, Xie Z Y, Zhang Gong P, et al. 2013. Topic classification of tourist online comments based on LDA: Taking the Forbidden City as an example. Information Engineering, 3(3): 55-63. (in Chinese)

[13]
Liu B. 2022. Sentiment analysis (2nd edition). Beijing, China: Machinery Industry Press.

[14]
Liu W L, Huang W. 2021. Sentiment analysis of the composition elements of lingering garden based on domain dictionary. Science, Technology and Engineering, 21(8): 3174-3179. (in Chinese)

[15]
Ma X B, Zhang J H. 2022. Research on the image perception of Suzhou Gardens, a world cultural heritage site, by foreign tourists: Different granular analysis based on natural language processing. Ecotourism in China, 12(4): 550-565. (in Chinese)

[16]
Oliver R L. 1993. Cognitive, affective and attribute bases of the satisfaction response. Journal of Consumer Research, 20(3): 418-430.

[17]
Shi Y R, Chen G H, Zhang Y. 2024. The asymmetric relationships between ski resort attributes and tourist satisfaction: A case study of Changbai Mountain Wanda International Resort. Journal of Chinese Ecotourism, 14(5): 1103-1117. (in Chinese)

DOI

[18]
Sun B S, Ao C L, Wang J X, et al. 2022. Research on satisfaction evaluation of ecotourism based on network text mining. Operations Research and Management, 31(12): 165-172. (in Chinese)

[19]
Wang P, Gao C, Chen X M. 2015. Research on text clustering based on LDA model. Information Science, 33(1): 363-368. (in Chinese)

[20]
Wu W F, Gao B J, Yang H X, et al. 2017. The impact of comment text on hotel satisfaction: A method based on sentiment analysis. Data Analysis and Knowledge Development, 1(3): 62-71. (in Chinese)

[21]
Zhao C Y, Chen M A. 2019. Analysis of factors influencing tourist satisfaction based on network text analysis. Statistics & Decision, (13): 115-118. (in Chinese)

[22]
Zhou X J, Zheng Y Z. 2016. Factors influencing tourist satisfaction in the Three Gorges and brand loyalty testing. Statistics & Decision, (18): 182-184. (in Chinese)

[23]
Zhu X, Liu M, Sun Y D, et al. 2024. Night tourism satisfaction in the Qinghefang tourism and leisure block based on an improved Kano model. Journal of Resources and Ecology, 15(1): 55-65.

DOI

Outlines

/