
Journal of Resources and Ecology >
Spatial and Temporal Dynamics and Driving Factors of Cultivated Land in Anhui Province
|
HAN Zhongwang, E-mail: han4269auyy@163.com |
Received date: 2024-05-16
Accepted date: 2024-09-15
Online published: 2025-05-28
Supported by
Social Scientific Innovation and Development Research Project of Anhui Province(2021CX090)
Key Project in Humanities and Social Sciences of Anhui Provincial Department of Education(2022AH050222)
Rapid population growth, industrialization, and urbanization are driving an increasing demand for land in various industries, which is reducing the available cultivated land resources. This study used the Land-use Dynamic Degree Model and Geo-Detector to explore the spatial and temporal variations in cultivated land resources and the driving factors of cultivated land changes in Anhui Province from 2009 to 2018, using data on cultivated land area and socio-economic indicators. The findings showed reductions in both the total cultivated land area and the per capita cultivated land area in Anhui Province from 2009 to 2018. Most prefecture-level cities experienced reductions in their cultivated land area, with only a few showing increases. All prefecture-level cities except Wuhu City showed decreasing trends in per capita cultivated land area. The changes in the cultivated land area in Anhui Province have been influenced by various socio-economic factors. The impacts of interaction factors were more significant than those of any single factor during the study period. Among these interaction factors, the regional economic structure, level of agricultural technology, state of agricultural production, status of rural development, condition of the rural labor force, and governmental investment and regulation were shown to be crucial and prioritized. These factors significantly contributed to the variations in cultivated land area within Anhui Province. Therefore, balancing the relationship between economic growth and cultivated land preservation, especially strictly implementing cultivated land protection policies, is significantly beneficial for achieving sustainable socio-economic development.
HAN Zhongwang , RUAN Yunfeng , HUO Kun , JIAO Chunyu . Spatial and Temporal Dynamics and Driving Factors of Cultivated Land in Anhui Province[J]. Journal of Resources and Ecology, 2025 , 16(3) : 802 -814 . DOI: 10.5814/j.issn.1674-764x.2025.03.016
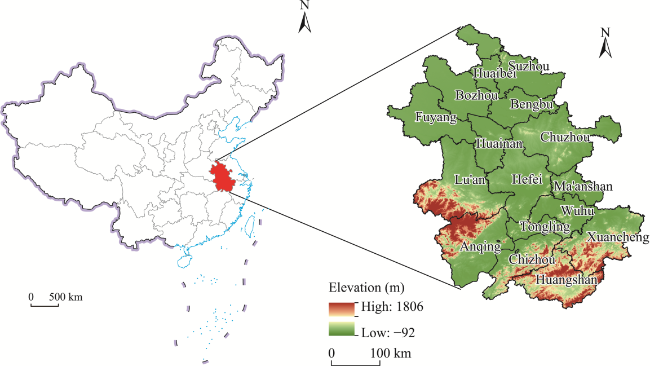
Figure 1 Location of Anhui Province |
Table 1 Table of factors influencing the area of cultivated land in Anhui Province |
| Connotation of influencing factor | Unit |
|---|---|
| Population density (PD) | person km-2 |
| GDP per capita (GPC) | yuan person-1 |
| Proportion of primary industry (PPI) | % |
| Proportion of secondary industry (PSI) | % |
| Proportion of tertiary industry (PTI) | % |
| Area sown with grain crops (ASGC) | ha |
| Grain yield (GY) | t |
| Total power of agricultural machinery (TPAM) | 104 kW |
| Effective irrigated area (EIA) | 103 ha |
| Fertilizer application rate (FAR) | t |
| Rural electricity consumption (REC) | 104 kWh |
| Pesticide usage (PU) | t |
| Fiscal expenditure (FE) | 104 yuan |
| Number of rural employees (NRE) | person |
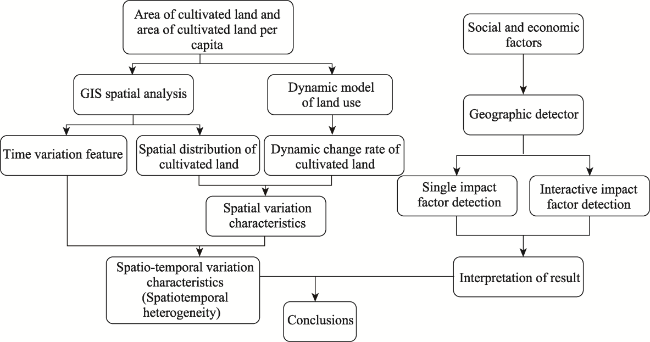
Figure 2 Workflow diagram |
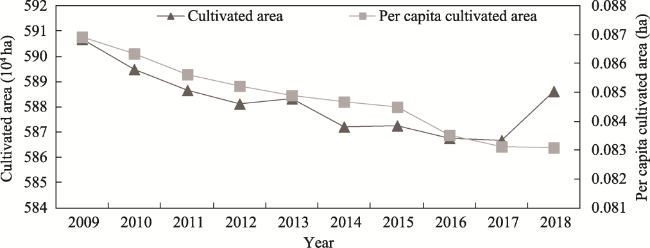
Figure 3 Trends in cultivated land area and per capita cultivated land area in Anhui Province |
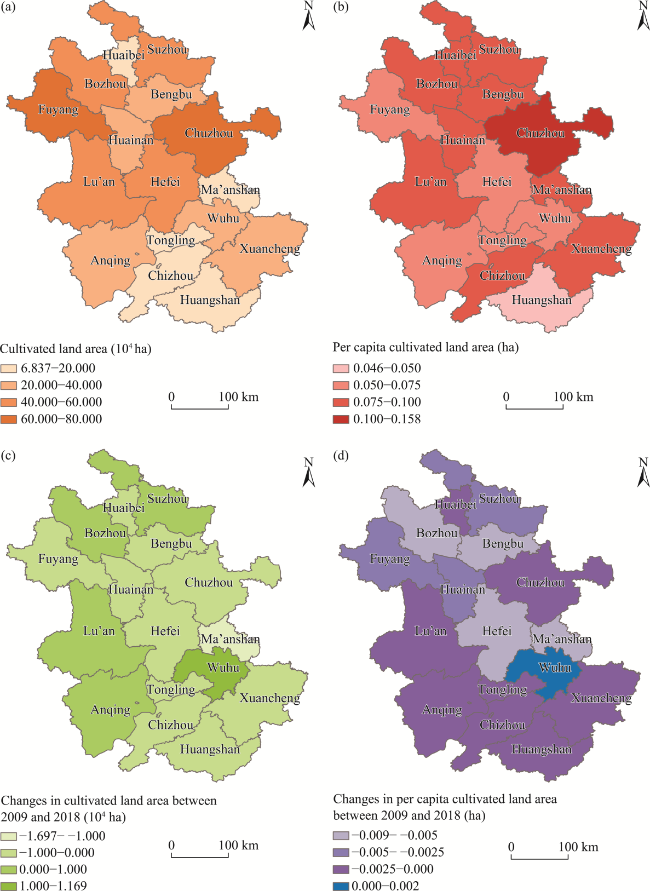
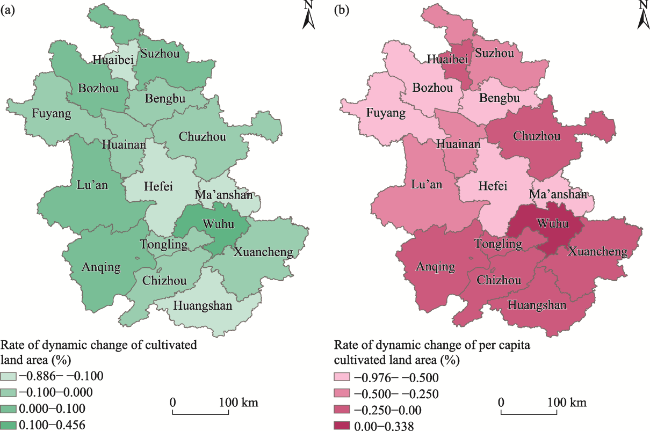
Figure 4 Cultivated land area (a) and per capita cultivated land area (b) in 2018; and changes in cultivated land area (c) and changes in per capita cultivated land area (d) between 2009 and 2018 in Anhui Province |
Figure 5 Rates of dynamic change of cultivated land area (a) and per capita cultivated land area (b) in Anhui Province |
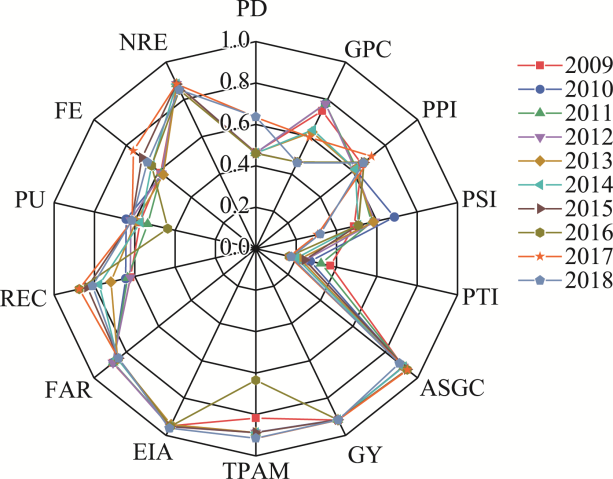
Figure 6 Single-factor detection radar map of factors influencing the spatial and temporal changes of cultivated land in Anhui Province |
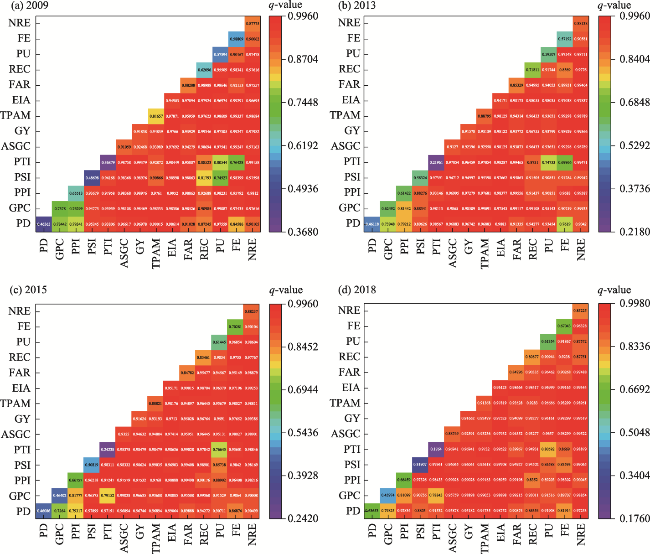
Figure 7 Heat map of the influences of factor interactions on spatiotemporal changes of cultivated land in Anhui ProvinceNote: Only the four-year impact factor interaction detection heat maps for 2009, 2013, 2015, and 2018 are shown since the number of heat maps for each period is too large to show them all. |
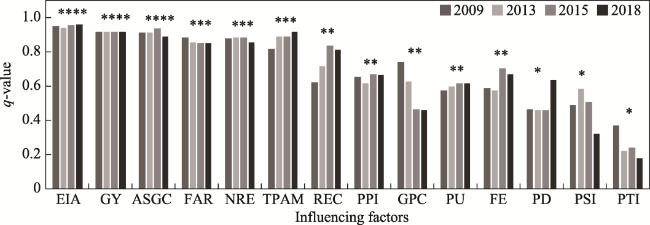
Figure 8 Correlations of factors influencing cultivated land changes based on the results of single factor detection in Anhui ProvinceNote: ****, ***, **, and * indicate strong correlation, secondary strong correlation, tertiary strong correlation, and weak correlation, respectively. |
| [1] |
|
| [2] |
|
| [3] |
|
| [4] |
|
| [5] |
|
| [6] |
|
| [7] |
|
| [8] |
|
| [9] |
|
| [10] |
|
| [11] |
|
| [12] |
|
| [13] |
|
| [14] |
|
| [15] |
|
| [16] |
|
| [17] |
|
| [18] |
|
| [19] |
|
| [20] |
|
| [21] |
|
| [22] |
|
| [23] |
|
| [24] |
|
| [25] |
|
| [26] |
|
| [27] |
|
| [28] |
|
| [29] |
|
| [30] |
|
/
| 〈 |
|
〉 |