Land Resource and Land Use

Spatiotemporal Evolution and Influencing Factors of Multifunctional Cultivated Land in Southwestern Mountainous Areas under the Background of Sustainable Agricultural Development

  • ZHANG Yongdong , 1, 2, 3 ,
  • YANG Zisheng , 2, 3, * ,
  • YANG Renyi 1, 2, 3 ,
  • LIU Fuhua 1, 3 ,
  • HE Yimei 4
Expand
  • 1. School of Economics, Yunnan University of Finance and Economics, Kunming 650221, China
  • 2. Institute of Land & Resources and Sustainable Development, Yunnan University of Finance and Economics, Kunming 650221, China
  • 3. Yunnan Provincial Key Laboratory of Digital Economy and Sustainable Rural Development, Kunming 650221, China
  • 4. School of Tourism and Hospitality Management, Yunnan University of Finance and Economics, Kunming 650221, China
* YANG Zisheng, E-mail:

ZHANG Yongdong, E-mail:

Received date: 2024-11-18

  Accepted date: 2025-04-25

  Online published: 2025-05-28

Supported by

National Natural Science Foundation of China(41261018)

National Natural Science Foundation of China(72263032)

Key Project of Yunnan Province Applied Basic Research Program(202501AS070166)

Abstract

With the rapid development of urbanization and industrialization in China, the expansion of construction land and irrational utilization of cultivated land have led to issues such as cultivated land marginalization, extensive use, non-grain conversion, and non-agriculturalization. These issues are a major threat to sustainable agricultural development, but existing research suffers from limitations including failure to assess the multifunctionality of cultivated land (MCL) from the perspective of sustainable agricultural development. This study constructed an agricultural production function (APF)-social security function (SSF)-ecological maintenance function (EMF)-landscape aesthetic function (LAF) classification system. Using this comprehensive evaluation model, the MCL values for typical provinces in southwestern mountainous areas of China (Guizhou, Sichuan, and Yunnan) were calculated in detail, and their spatiotemporal evolutionary characteristics were explored. Concurrently, the Spearman rank correlation coefficient, geographically weighted regression (GWR) and redundancy model were used to deeply explore the relationships among cultivated land functions and their influencing factors. The results showed three important points. (1) Over the past two decades, the comprehensive values and four sub-functional values of cultivated land in southwestern mountainous areas have shown increasing trends in the order of SSF > EMF > LAF > APF. The values and rates of change of each sub-functional value show obvious spatial variation. However, the spatial gap in cultivated land functions has adverse effects on sustainable agricultural development. (2) There are clear correlations between each pair of the four major functions of cultivated land during the study period, and the number of results reaching significance among the six correlations between the four main cultivated land functions increased significantly from 2000 to 2020. Simultaneously, there are noticeable spatiotemporal differences in the trade-offs and synergies among the MCLs. (3) The development of MCL is most significantly influenced by socioeconomic factors such as the per capita net income of rural residents. Therefore, formulating reasonable land protection policies is imperative for promoting the sustainable development of agriculture. The results of this study can provide guidance for the rational layout and coordinated development of MCL space, for promoting sustainable agricultural development and ensuring food security.

Cite this article

ZHANG Yongdong , YANG Zisheng , YANG Renyi , LIU Fuhua , HE Yimei . Spatiotemporal Evolution and Influencing Factors of Multifunctional Cultivated Land in Southwestern Mountainous Areas under the Background of Sustainable Agricultural Development[J]. Journal of Resources and Ecology, 2025 , 16(3) : 786 -801 . DOI: 10.5814/j.issn.1674-764x.2025.03.015

1 Introduction

Over the past four decades, the rapid development of industrialization and urbanization has led to the expansion of urban areas, primarily driven by land urbanization. This expansion has led to the waste of cultivated land resources, and other problems such as the marginalization, extensive development, anti-intensification, non-grain conversion, and non-agriculturalization of cultivated land (Schindler et al., 2015; Yang, 2020; Yang et al., 2024b). In the ecologically fragile southwestern mountainous areas of China in particular, unreasonable land use, pollution, and abandonment pose a significant threat to the country’s ecological well-being. Optimizing the utilization of cultivated land and achieving sustainable agriculture development are urgent problems that need to be addressed. Sustainable agriculture refers to the development of agriculture to meet social needs while preserving the ecological environment. In the current context of severe environmental pollution and resource scarcity, sustainable agricultural development has become a global consensus. Cultivated land is the foundation of sustainable agricultural development, and it is known as a semi-natural and semi-artificial composite system resulting from the interactions and conflicts between humans and nature (Zou et al., 2021). The traditional way of using cultivated land that blindly pursues output has failed to meet the growing needs of humanity (Liang et al., 2021; Li et al., 2023). With the continuous promotion of top-level design and macroeconomic policies in China, the functions of cultivated land have shifted from emphasizing unitary output to socioeconomic development, environmental protection, and cultural leisure (Zhang et al., 2023). Given these new challenges and evolving circumstances, merely protecting the quantity and quality of cultivated land is insufficient for establishing a comprehensive framework (Niu and Fang, 2019). Instead, deeper exploration is needed from the perspective of the multifunctionality of cultivated land (MCL).
The concept of MCL originated from the idea of agricultural multifunctionality, which can be traced back to studies of “rice culture” in Japan (Aizaki et al., 2006). It was subsequently formed at the World Food and Agriculture Organization Summit (Fu et al., 2018), Organization for Economic Co-operation and Development (OECD) meetings (Xiong et al., 2017), and the United Nations Conference on Environment and Development (UNCED) (Meng and Zhang, 2018). Scholars have also proposed that agriculture has functions such as production, pest control, cultural heritage, and landscape aesthetics (Chen et al., 2017; Wang et al., 2018). There are several approaches to classifying the functions of cultivated land. The first divides cultivated land into additional functions, such as production, life, and ecology, based on the dominant function. The second approach subdivides the social and production functions of cultivated land based on the first method to observe changes in the secondary functions (Fan et al., 2018). In terms of quantifying and evaluating functional values, scholars mainly use multi-factor comprehensive evaluation, mathematical statistics, fuzzy optimization models, and field investigation methods. Among them, the multi-factor comprehensive evaluation method is the most widely used. Some scholars have used mathematical statistics methods such as decomposition summation and income reduction to measure the social, economic, and ecological values of cities (prefectures). Field investigation methods are mainly used to evaluate the non-productive functions of cultivated land that are difficult to quantify (Chen and Wang, 2013). Although numerous methods are available for evaluating MCL in existing research, these methods are too limited and need to be more universal and systematic. From the perspective of the trade-off and synergy relationship of MCL, foreign scholars studying ecosystem services have found that the relationship is universal (Rodríguez et al., 2006). China’s cultivated land policy has always been strict, but some phenomena such as urban land expansion, cultivated land ecological pollution, and abandonment have caused functional imbalances. Therefore, studying the relationships between MCLs is necessary (Su et al., 2019). The changes in MCL are caused by both anthropogenic and natural influencing factors (Feng et al., 2020). Some scholars have investigated how different cultivated land types and their functions affect MCL values, as well as the impacts of land use structure, methods, and socioeconomic factors on spatial variations in MCL (Jiang et al., 2020). Other scholars have suggested that urbanization promotes agricultural scale production and has a positive impact on the agricultural production function (APF) and ecological maintenance function (EMF) of cultivated land (Lyu et al., 2021). Meanwhile, existing studies on the factors influencing MCL seldom take agricultural modernization factors into account.
Despite these efforts, existing research on MCL has several shortcomings. 1) There is no universal standard for the establishment and selection of MCL indicators, and most of them are represented by socioeconomic data, with a single data source (Fan et al., 2023). 2) The simplicity of existing research on MCL evaluation methods limits our understanding of its connotation, so it is difficult to analyze the specific impact mechanisms and spatial changes in the ecology and landscape functions of cultivated land. 3) Existing research on MCL lacks spatiotemporal evaluation of trade-offs and synergies and has not studied MCL from the perspective of sustainable agricultural development. To overcome these limitations, this study combined multiple sources of data to construct an APF-SSF-EMF-landscape aesthetics function (LAF) classification index system by using the InVEST model, Fragstats 4.2 software, Canoco 5.0 software, ArcGIS 10.2, and other software. The comprehensive evaluation method, Spearman rank, geographically weighted regression (GWR), redundancy, and other methods were used to evaluate the comprehensive and sub-index values of MCL at five time periods and analyze their trade-off and synergy relationships. This study adopts a scientific and rational systematic indicator system, along with innovative evaluation methods, and applies them to the spatiotemporal evolution evaluation of MCL in mountainous areas. Theoretically, this study not only improves the progress of MCL evaluation in mountainous areas, but also further enriches the basic theoretical research. Practically, it can provide a reference and guidance for differentiated land use and protection decision-making and management in the southwestern mountainous areas and similar regions according to local conditions.

2 Materials and methods

2.1 Study area

The study area is located in southwestern China, including Yunnan, Guizhou, and Sichuan provinces, between 21°08′- 34°19′N and 97°02′-109°35′E. The total land area is about 1.0563 million km2, with a total of 46 cities (prefectures). The complex and diverse terrain is high in the west and low in the east, consisting of plateaus, basins, and hills. Among them, mountains account for the highest proportion and the widest range, accounting for about 86.53%. Therefore, it is called the southwest mountainous area (Figure 1). Based on the data in the third national land survey, the cultivated land area in the southwestern mountainous areas is 14.0953 million ha, accounting for 13.34%. The per capita cultivated land area is 0.083 ha, which is lower than the national average level. The 7th National Census reported the permanent population of the region as 169.4 million, accounting for about 11.74% of the national population. The urbanization rate of its permanent population is 53.31%. Its GDP is about 9.09 trillion yuan, accounting for approximately 8.97% of the national GDP. The southwestern mountainous area is an important development region for China’s implementation of the “Western Development Strategy”. It has a fragile ecological environment, and natural disasters occur frequently. The migration of the rural labor force to cities (prefectures) has led to severe issues of cultivated land abandonment and waste, with abandoned cropland accounting for about 10% of the total cultivated land area (Yang et al., 2023). The study area map is shown in Figure 1.
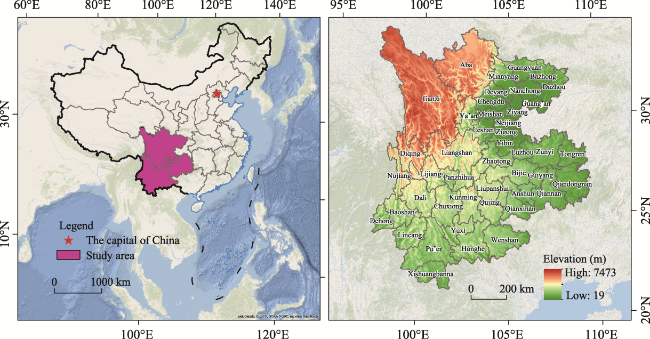
Figure 1 Study area in southwestern China

2.2 Data sources

The multisource data collected and applied in this study mainly involve four categories: land use, socioeconomic, remote sensing, and environmental data. Detailed descriptions of the MCL data sources (data type, name, resolution ratio, and source) are given in Table 1. Land use/cover change (LUCC) data for Yunnan, Guizhou, and Sichuan Provinces in 2000, 2005, 2010, 2015, and 2020 were used to quantify several indicators, including carbon sequestration, habitat quality, aggregation index, and landscape shape index. Environmental and remote sensing data were used to quantify vegetation coverage, slope, annual average temperature, and annual total precipitation. Socioeconomic and agricultural modernization factors in the per capita cultivated land carrying capacity index and factors influencing APF, SSF, and EMF were quantified using socioeconomic data. In addition, note that smoothing or interpolation was applied to the socioeconomic data for some missing years to ensure data integrity.
Table 1 Data source and resolution
Data type Data name Resolution ratio Data source
Land use data Land Use/Cover Change (LUCC) 30 m×30 m Resource and Environmental Science and Data Center of Chinese Academy of Sciences (https://www.resdc.cn)
Environmental data DEM 30 m×30 m Geospatial data cloud (https://www.gscloud.cn)
Temperature 1 km×1 km National Earth System Science Data Center (http://www.geodata.cn)
Precipitation 1 km×1 km
Water system data 90 m×90 m Open Street Map (https://openmaptiles.org)
Remote sensing data Normalized Difference Vegetation Index (NDVI) 1 km×1 km National Oceanic and Atmospheric Administration of the United States (https://www.noaa.gov)
Fractional Vegetation Cover (FVC) 1 km×1 km
Socioeconomic data Crop yield City (prefecture)-level Statistical bureaus in Yunnan Province, Sichuan Province, Guizhou Province, and various cities (prefectures)
Cultivated area
Agricultural practitioners
Output value of the primary industry
Urbanization rate
Per capita GDP
Net income
Fertilizer application amount
Total power of agricultural machinery

2.3 Research framework

As the impacts of human activities increasingly influence the natural environment, the functions of cultivated land have changed from a state of simplicity to diversity, for adapting to changes in the survival, lifestyle, and consumption patterns of human groups. We classified the functions of cultivated land into APF, SSF, EMF, and LAF. The production function originates from the essential attributes of cultivated land, while the survival function arises from the general functions of cultivated land, and the ecological function is particularly important for the ecologically fragile mountainous areas. This study calculated the overall and MCL values of the southwestern mountainous areas, and explored their spatiotemporal characteristics and the relationships between MCLs to reveal their internal correlations. Finally, an indicator system for the factors influencing MCL, comprising natural factors, socioeconomic factors, and agricultural modernization factors, was constructed to clarify the extent and mechanisms by which these internal and external factors operate. The specific research framework is shown in Figure 2.
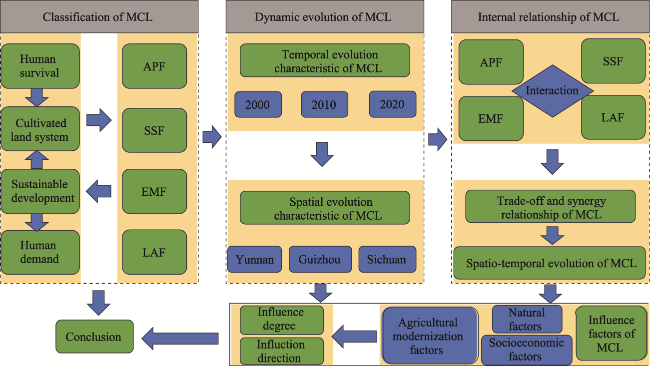
Figure 2 Research framework

2.4 MCL indicator system and research methods

2.4.1 Indicator construction

APF is a core and fundamental function of cultivated land (Niu et al., 2022). It is mainly reflected in the potential output of crops, so three indicators were selected: grain crop yield per hectare, oil crop yield per hectare, and the index of multiple cropping of cultivated land, to reflect the input-output levels of the corresponding factors of cultivated land. The multiple cropping index of cultivated land is the ratio of the annual crop sowing area to the cultivated land area. SSF is one of the most significant functions derived from cultivated land (Hu et al., 2018), and it reflects the ability of farmers to live and ensure food security. To demonstrate the supporting role of cultivated land in the local agricultural population and economy, three indicators were selected: the proportion of agricultural workers in the rural population, per capita primary industry output value, and per capita cultivated land area (Table 2).
EMF is the most important function in the southwestern mountainous areas (Gao et al., 2021; Xu et al., 2022), and it reflects the ability of cultivated land to protect biodiversity and maintain agricultural ecological health. Three indicators of EMF were selected: carbon sequestration per square meter, per capita ecological carrying capacity of cultivated land, and habitat quality of cultivated land. The data for carbon sequestration and habitat quality were calculated using the InVEST model based on the LUCC database. Per capita ecological carrying capacity of cultivated land primarily reflects the carrying capacity of a region’s ecosystem, where a higher value indicates stronger ecological service capacity of the cultivated land. It was calculated as: per capita ecological carrying capacity of cultivated land = cultivated land yield factorper capita cultivated land areacultivated land trade-off factor. Since the research object was only cultivated land, the trade-off factor value is 1, and the yield factor is defined as the ratio of the regional grain yield level per unit area in the southwestern mountainous areas to the national grain yield level per unit area for the corresponding year. LAF reflects the utilization of cultivated land as a carrier of the cultural landscape, and it is also the main direction for the transformation of cultivated land functions (Huang et al., 2022). Therefore, three indicators of LAF were selected: the aggregation index (AI), fractional vegetation coverage (FVC), and landscape shape index (LSI). The AI and LSI were calculated using Fragstats 4.2 software, based on LUCC data. The AI measures the dispersion of patches within a landscape, with values ranging from 0 to 100. A higher AI value indicates greater aggregation of similar patches, resulting in a more compact landscape structure. The LSI represents the minimum possible total edge length of related patch types. An increasing LSI suggests a rise in the irregularity of patches. The FVC was extracted using ArcGIS 10.2 software to obtain the normalized difference vegetation index (NDVI).
Table 2 Indicator of MCL evaluation system
Function Indicator layer Unit Nature Single factor Comprehensive weight
APF Grain crop yield per hectare t + 0.389 0.262
Oil crop yield per hectare t + 0.295
Index of multiple cropping of cultivated land % + 0.315
SSF Proportion of agricultural workers in the rural population % + 0.346 0.316
Per capita primary industry output value yuan person-1 + 0.316
Per capita cultivated land area m2 person-1 + 0.338
EMF Carbon sequestration per square meter g m-2 + 0.293 0.248
Per capita ecological carrying capacity of cultivated land ha person-1 + 0.404
Habitat quality of cultivated land - + 0.303
LAF Aggregation Index (AI) % + 0.415 0.174
Fractional Vegetation Cover (FVC) % + 0.307
Landscape Shape Index (LSI) - - 0.278

Note: In the unit column, the “-” indicates a numerical or exponential form with no units.

2.4.2 Standardization of the indicator system

Due to differences in the positive and negative indicators and units in the collected and calculated data, it was necessary to standardize the range of each indicator and convert all data into dimensionless data.
Positive indicators:
x i j = x i j x min x max x min
Negative indicator:
x i j = x max x i j x max x min
In the above formulas, xij represents the value of the j-th indicator in the i-th city (prefecture). xijʹ represents the standardized value of the j-th indicator in the i-th city (prefecture). xmin and xmax respectively represent the minimum and maximum values of xij. To eliminate the influence of outliers, the standardized value xijʹ was translated by setting yij=xijʹ+0.01 as the processed indicator value.

2.4.3 Indicator weight determination

The Fuzzy Analytic Hierarchy Process (FAHP) is a method that combines the advantages of the fuzzy method and Analytic Hierarchy Process (AHP). This study combined the FAHP and Entropy methods with reference to the weighting methods in the relevant literature (Zhang et al., 2011; Zhu and Zhang, 2017; Liu et al., 2020). The formulas for calculating the weight of each indicator are as follows:
w j = β w A j + γ w B j β + γ = 1
$\left\{\begin{array}{l} D\left(w_{A j}, w_{B j}\right)=\sqrt{\sum_{j=1}^{n}\left(w_{A j}-w_{B j}\right)^{2}} \\ D\left(w_{A j}, w_{B j}\right)^{2}=(\beta-\gamma)^{2} \end{array}\right.$
In formulas (3) and (4), wj represents the comprehensive weight of the j-th indicator. β and γ are the subjective and objective preference coefficients, respectively. wAj is the subjective weight of the j-th indicator determined by FAHP, and wBj is the objective weight of the j-th indicator determined by Entropy. D(wAj, wBj) is the Euclidean distance function, where D denotes the distance value between two points. D(wAj, wBj) is used to measure the degree of difference between the subjective weight wAj and the objective weight wBj. The equation D(wAj, wBj)2 = (βγ)2 links the square of the Euclidean distance to the difference between the subjective and objective preference coefficients. This relationship shows that the difference between subjective and objective weights is proportional to the difference in preference coefficients. Comprehensive weight wj was obtained by solving formulas (3) and (4) simultaneously.

2.4.4 MCL evaluation model

This study used a comprehensive evaluation model to calculate the APF, SSF, EMF, LAF, and MCL index values of cultivated land in the southwestern mountainous areas (Yang et al., 2008; Xu and Wang, 2023).
h i = j = 1 m y i j × w j
In formula (5), hi represents the MCL comprehensive index value of the i-th city (prefecture) or the index values of the four functions of cultivated land. yij represents the value of the j-th indicator for the i-th city (prefecture) after standardization and a shift of 0.01 units, as defined in formulas (1) and (2), where yij = xij′+0.01. wj is the comprehensive weight of the j-th indicator. In addition, to gain a more comprehensive understanding of the dynamic changes in each city (prefecture) during the research period, the values calculated from the comprehensive evaluation model were used to measure the rates of changes in MCL and the four functions of cultivated land for each city (prefecture) from 2000 to 2020. The formula for calculating the rate of change is as follows:
M C L p q _ t 1 t 2 = M C L p q _ t 2 M C L p q _ t 1 M C L p q _ t 1
In formula (6), MCLpq_t1t2 represents the rate of change of the q-th function of the p-th city (prefecture) during the t1-t2 time period, while MCLpq_t1 and MCLpq_t2 represent the values of the q-th function for the p-th city (prefecture) at times t1 and t2, respectively.

2.4.5 Trade-off and synergy relationships

According to the relevant literature (Zhu et al., 2018; Pang et al., 2023), the correlation coefficient of the Spearman rank was calculated using SPSS software. The specific mathematical principles are as follows: Let {(u, v)} denote n pairs of data that are independently and identically distributed, with the population having a bivariate continuous distribution. By sorting the ui in ascending order, a new set of data u1 < u2 <... < un can be obtained. The corresponding vi are referred to as the companions of ui. Assuming that uj is located at the k-th position in the sequence {(u)}, then the number k is defined as the rank of uj, which is denoted as uj′. Similarly, the rank of vj can be defined and denoted as vj′. The differences between each pair of ranks are calculated as di = ui′ − vi′, and then squared to obtain di2. The formula used was as follows:
ρ u , v = 1 6 i = 1 n d i 2 n n 2 1
In formula (7), u and v represent different cultivated land functions, and ρ(u, v) represents the correlation coefficient between u and v, with values ranging from -1 to 1. The di represents the difference between the ranks ui ' and vi', and n represents the number of samples. When ρ(u, v) >0, it indicates a positive correlation between u and v, indicating spatial synergy between the two functions of cultivated land. The larger the positive value, the stronger the synergistic relationship. When ρ(u, v) <0, it indicates a negative correlation between u and v, and there is a spatial trade-off between the two functions of cultivated land. The smaller the negative value, the stronger the trade-off relationship. When ρ(u, v) is not significant, i.e., P>0.1, it indicates that there is no relationship between the cultivated land functions.

2.4.6 Geographically Weighted Regression (GWR)

The GWR model proposed by Fotheringham et al. (2017) is based on the idea of local smoothness. It integrates the spatial attributes of data into the analysis of driving factors, and different spatial positions result in different distribution characteristics of the regression results, reflecting the non-stationarity of relevant parameters in different spatial distributions. Specifically, it was calculated as follows (Yang et al., 2024a):
y i = α 0 u i , v i + α 1 u i , v i x i 1 + + α k u i , v i x i k + ε i i = 1 , 2 , , n
where yi is the observed value of a certain function of cultivated land in the i-th city (prefecture), and xik is the observed value of the k-th independent variable in the i-th city (prefecture); α0 is the intercept coefficient; αk is the estimated coefficient of the k-th independent variable in the i-th city (prefecture); and εi is the random error term.

2.4.7 Analysis of influencing factors

The function of cultivated land is influenced by natural environmental and human activities. Based on the actual situation in the southwestern mountainous areas, eight indicators were selected as the influencing factors of various MCLs in these areas, and they were further divided into natural environment, agricultural modernization, and socioeconomic factors (Fan et al., 2023). In this study, Canoco5.0 software was used for redundancy analysis to explore the relationships between MCL and the different influencing factors, and to identify the significant influencing factors (Table 3).
Table 3 The factors influencing MCL in the southwestern mountainous areas
Type Factor Code Unit
Natural
environment
Slope Slope °
Annual average temperature Temp
Annual total precipitation Prec mm
Agricultural modernization Application amounts of agricultural fertilizers per hectare Fertilizer t ha-1
Total power of agricultural machinery per hectare Power kW ha-1
Socioeconomic Urbanization rate Urban %
Per capita GDP Gdp yuan person-1
Per capita net income of rural residents Income yuan person-1

3 Results

3.1 Spatiotemporal evolution of MCL

The distribution of MCL values and rates of change in various cities (prefectures) of the southwestern mountainous areas are shown in Figure 3. From 2000 to 2020, the overall MCL values in various cities (prefectures) showed upward trends, with a reduction in low-value areas and an increase in high-value areas.
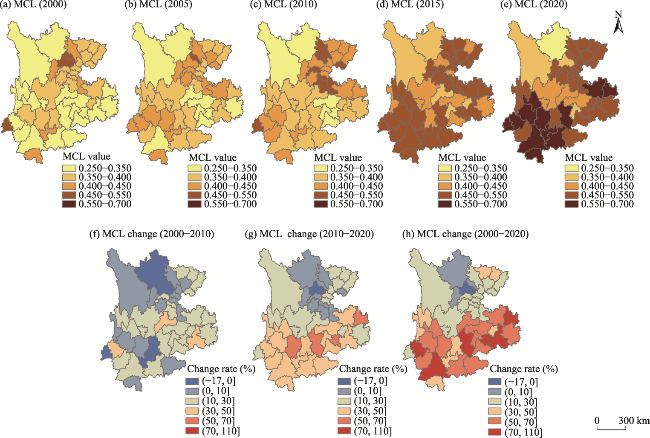
Figure 3 MCL values and change rates from 2000 to 2020
From the perspective of temporal evolution, there were relatively few high-value areas in 2000, with only Chengdu, Deyang, and Dehong ranging from 0.45 to 0.55. Other regions were classified as medium-value or low-value areas, with values below 0.45. In 2005, both the scope and quantity of medium-value areas had expanded, with Deyang City being the only place classified as medium-value to high-value, with a score of 0.49. In 2010, the range and number of high-value areas further increased, mainly concentrated in the Sichuan Basin and western Yunnan Province, with values ranging from 0.45 to 0.55. In 2015, the number of high-value areas significantly increased and they were mainly distributed in Yunnan Province and the Sichuan Basin. In 2020, only eight cities (prefectures) were in the low-value areas. The average MCL value of each city (prefecture) rose from 0.361 to 0.503, an increase of 39.31%. At the same time, the overall rate of change for MCL showed an upward trend from 2000 to 2020, with a slower increase from 2000 to 2010 and a faster increase from 2010 to 2020. This may have occurred because over time, the socioeconomic growth has been faster, the degree of agricultural modernization has improved, and the advantages of MCL have been fully utilized, leading to a more rapid increase in the value.
From the perspective of spatial evolution, MCL exhibits strong agglomeration with an overall spatial pattern of “high in southwest and low in northwest”. High values appear in western Yunnan regions such as Dehong, Baoshan, and Dali, and medium-high values are distributed in Sichuan Basin and most areas of Guizhou. This is because these regions have suitable climates, relatively developed agriculture, and have received many agricultural support policies, such as financial support, tax subsidies, and talent support policies. The rate of change maintains a similar spatial distribution to the MCL values, showing an overall spatial pattern of a decreasing trend from north to south. The Yunnan-Kweichow Plateau, situated in the regions of Yunnan and Guizhou, had the highest rate of change. This can be attributed to the region’s reliance on poverty-alleviation policies. It has achieved significant progress in developing unique plateau agricultural products, strengthening the construction of high-standard farmland, deepening land reform, and promoting modernization in agriculture and rural areas.

3.2 Spatiotemporal evolution of the four functions of cultivated land

The four main functions (APF, SSF, EMF, and LAF) vary greatly between cities (prefectures) and have undergone significant changes over time (Figures 4 and 5). Overall, APF showed an upward trend over time, with an average increase from 0.393 to 0.449. Spatially, it was higher in the northeastern and central regions than in the surrounding areas, but with significant spatial differentiation. APF had a sustainable growth trend from 2000 to 2020, such as in Ganzi Prefecture and Zhaotong City. From 2000 to 2010, APF showed downward trends in the Sichuan Basin, Yunnan, and Guizhou regions, with declining rates of over 10%. The declining rate of APF values in southwestern mountainous areas from 2000 to 2010 was more significant than that from 2010 to 2020. During the research period, the industrial poverty alleviation policy was well implemented, which promoted the development of agricultural productivity.
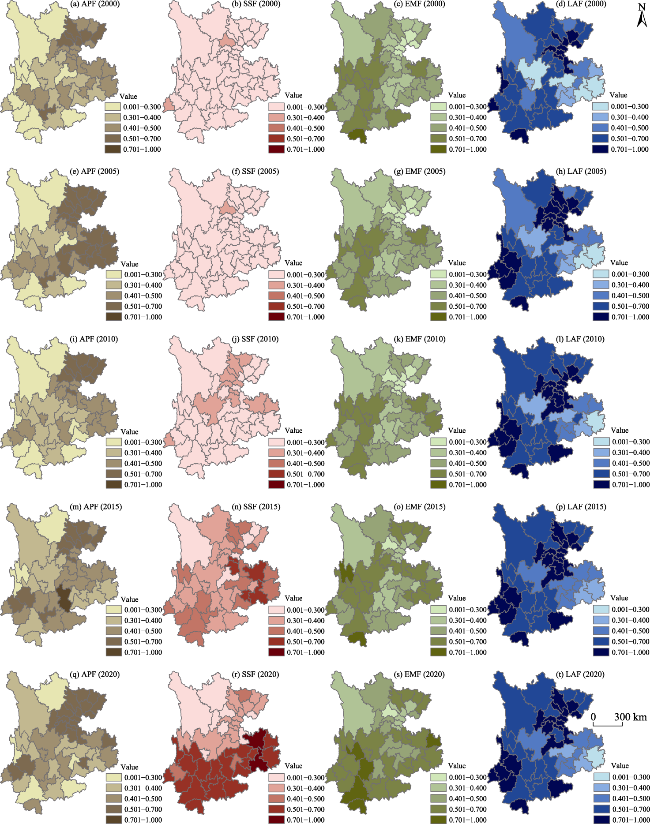
Figure 4 Four functional values of cultivated land in southwestern mountainous areas from 2000 to 2020
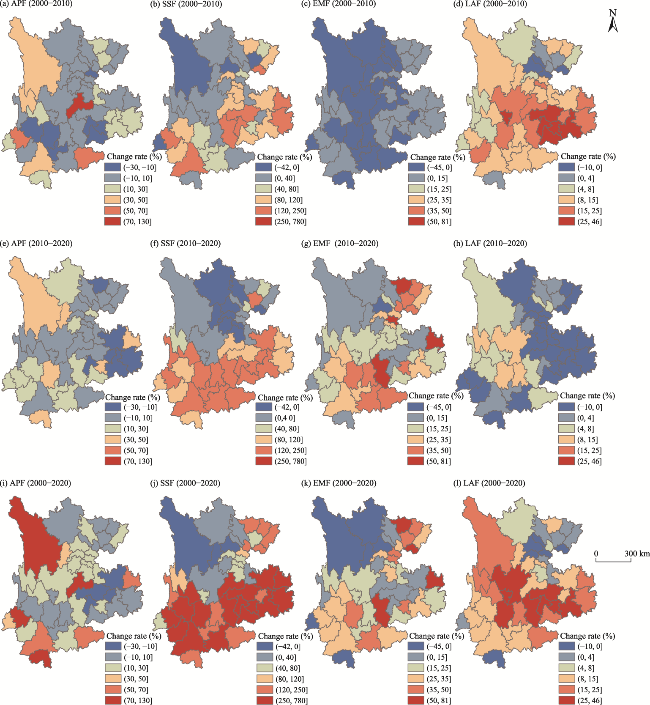
Figure 5 Change rates of in cultivated land in southwestern mountainous areas from 2000 to 2020
SSF values showed a significant upward trend in the southwestern mountainous areas, with an average increase from 0.176 to 0.443. Over time, they exhibited a spatial distribution pattern with a decreasing trend from south to north. In 2000, 2005, and 2010, most areas were low-value areas, while in 2015 and 2020, the number of high-value areas in Yunnan and Guizhou increased and showed clear spatial clustering. Overall, the SSF change rate from 2000 to 2020 showed a decreasing trend from south to north, indicating that the SSF value in Sichuan Province was relatively low and its growth rate was slow. Some areas in northern Sichuan still experienced declining rates of change, whereas Yunnan and Guizhou had higher SSF values and faster growth rates. This was because the population increase in Sichuan led to a reduction in the carrying capacity of cultivated land per unit area.
EMF showed an upward trend during the research period, with the average value increasing from 0.436 to 0.535, and it exhibited a spatial distribution pattern of decreasing from north to south. Among the cities (prefectures), high-value areas appeared in Xishuangbanna, Pu’er, and Dehong, while low-value areas were concentrated in Chengdu, Zigong, and Deyang. These areas are located in the Sichuan Basin and primarily have urban construction land. Due to the acceleration of urbanization, the large amounts of cultivated land around cities (prefectures) have been reduced, resulting in serious pollution and fragmentation of the cultivated land, which in turn had led to a reduction in EMF. Overall the rate of change of EMF showed sustained growth from 2000 to 2020, with Tongren showing the most significant increase of 80.63%. Compared to 2010 to 2020, the rate of decrease in the EMF from 2000 to 2010 was more significant and concentrated in the central region, where it exceeded 10%. The main reason was the blind pursuit of economic growth and industrial expansion in the early years, which resulted in the destruction of cultivated land ecology.
LAF showed an upward trend, with an average increase from 0.580 to 0.640, and a decreasing trend from the center to the periphery. The high-value areas of LAF were mainly distributed in the Sichuan Basin, northwest Yunnan, and Xishuangbanna, while the low-value areas were concentrated in Guizhou. This might be due to the insufficient amount of cultivated land, low mechanization rate, soil erosion, and land pollution, which led to lower LAF values. The rate of change showed a significant upward trend from 2000 to 2020, with some central cities (prefectures) experiencing increases of over 25%. Compared to 2000 to 2010, the LAF decreased only slightly from 2010 to 2020, showing an overall growth trend. The reason is that Yunnan, Guizhou, and Sichuan have successively issued opinions on the construction of high-standard cultivated land, and various cities (prefectures) have implemented high-standard cultivated land construction according to the task indicators.

3.3 Trade-off and synergy relationships of MCL

There are clear correlations between the MCLs from 2000 to 2020 (Table 4). In 2000, four of the six correlations were significant, and two of the four significant results were positively correlated (synergy) while two were negatively correlated (trade-off). The strongest synergistic relationship was SSF-LAF (0.372), and the strongest trade-off relation-ship was APF-EMF (-0.533). In 2010, three of the six correlations were significant, with one positive correlation (synergy) and two negative correlations (trade-off) among the three significant results. The strongest synergy was observed in APF-SSF (0.400), and the strongest trade-off was observed in APF-EMF (-0.495). In 2020, five of the six correlations were significant, with two positive correlations (synergy) and three negative correlations (trade-off) among the five significant results. The strongest synergistic relationship was observed in SSF-EMF (0.574), while the strongest trade-off relationship was observed in SSF-LAF (-0.389).
Table 4 Spearman rank correlation coefficients in southwestern mountainous areas from 2000 to 2020
Year APF-SSF APF-EMF APF-LAF SSF-EMF SSF-LAF EMF-LAF
2000 0.221 (0.14) -0.533 (<0.001) *** 0.299 (0.044) ** -0.034 (0.821) 0.372 (0.011) ** -0.277 (0.062) *
2005 -0.165 (0.273) -0.478 (0.001) *** -0.041 (0.786) 0.123 (0.417) 0.104 (0.491) -0.280 (0.059) *
2010 0.400 (0.006) *** -0.495 (<0.001) *** 0.221 (0.139) -0.082 (0.586) 0.065 (0.666) -0.284 (0.056) *
2015 -0.073 (0.628) -0.482 (0.001) *** 0.337 (0.022) ** 0.431 (0.003) *** -0.144 (0.341) -0.189 (0.209)
2020 -0.354 (0.016) *** -0.298 (0.045) ** 0.349 (0.017) ** 0.574 (<0.001) *** -0.389 (0.008) *** -0.243 (0.104)

Note: ***, **, and * indicate the significant levels are 0.01, 0.05, and 0.1, respectively; and the numbers in parentheses represent the P-values.

Although the above analysis can better reveal the trade- offs and synergies between different cultivated land functions, there might be significant spatial heterogeneity in the trade-offs and synergies. Therefore, the GWR model was used to further investigate the spatial distribution characteristics of the trade-offs and synergies between various cultivated land functions. Referring to relevant research (Hao et al., 2023), the same quantile division method was used to balance the classification of high, moderate, and low levels, or to combine the high, moderate, and low levels (Figure 6).
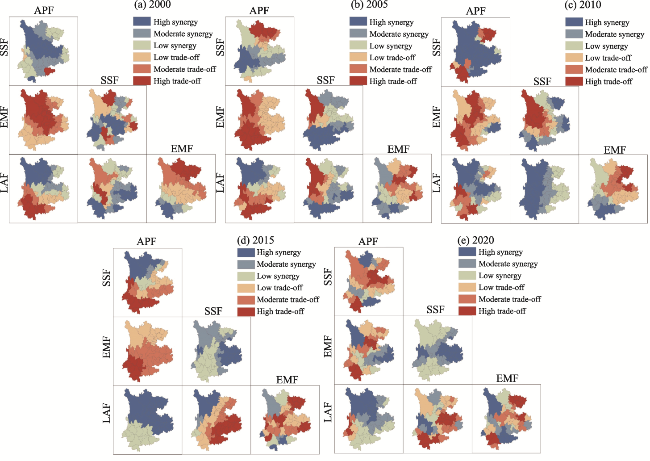
Figure 6 Trade-offs and synergies of MCL in southwest mountainous areas from 2000 to 2020
The GWR regression results indicated significant differences in the trade-offs and synergies at different periods (Figure 6). In 2000, the synergy ratio of MCL was higher than the trade-off ratio. Specifically, APF-SSF, APF-LAF, SSF-EMF, and SSF-LAF mainly exhibited synergistic effects, with synergistic proportions of 95.65%, 56.52%, 76.09%, and 76.09%, respectively. The distribution of APF-SSF synergistic relationships showed decreasing trends from the middle to both sides. SSF-EMF showed the characteristics of middle synergy and surrounding trade-off. APF-EMF and EMF-LAF mainly had trade-off effects, and the distributions of their trade-off relationships showed decreasing trends from north to south, with trade-off proportions of 100% and 76.09%, respectively. In 2005, APF-SSF, SSF-EMF, and SSF-LAF showed synergistic effects, with synergistic proportions of 60.87%, 83.13%, and 71.74%, respectively. The distribution of APF-SSF synergistic relationships showed a pattern of high in the central part and low in the north and south. APF-EMF, APF-LAF, and EMF-LAF mainly had trade-off effects, with trade-off proportions of 100%, 58.70%, and 67.39%, respectively. The trade-off relationships between APF-LAF and EMF-LAF were distributed in the south and northeast.
In 2010, the synergy ratio of MCL was higher than the trade-off ratio. Specifically, APF-SSF, APF-LAF, SSF-EMF, and SSF-LAF exhibited synergistic effects, with synergistic proportions of 67.39%, 58.70%, 63.04%, and 100%, respectively. The APF-SSF synergistic relationship was mainly distributed in the central, eastern, and northwestern regions. The SSF-EMF synergistic relationship was mainly distributed in northeastern and southwestern regions. APF-EMF and EMF-LAF mainly had trade-off effects, and the distribution of the APF-EMF trade-off relationship was high in the north and low in the south, with trade-off proportions of 100% and 76.09%, respectively.
In 2015, the trade-off ratio of MCL was higher than the synergy ratio. Specifically, APF-LAF and SSF-EMF exhibited synergistic effects, each with synergistic proportions of 100%. APF-SSF, APF-EMF, SSF-LAF, and EMF-LAF mainly had trade-off effects, with trade-off proportions of 67.39%, 100%, 86.96%, and 82.61%, respectively. The trade-off relationship between APF-EMF showed a decreasing trend from south to north. The trade-off relationships between SSF-LAF and EMF-LAF were distributed in the east.
In 2020, the trade-off ratio of MCL was higher than the synergy ratio. Specifically, APF-SSF, APF-EMF, SSF-LAF, and EMF-LAF mainly had trade-off effects, and the trade-off relationships were distributed in the northeastern and southwestern regions, with trade-off proportions of 78.26%, 60.87%, 67.39%, and 60.87%, respectively. APF-LAF and SSF-EMF mainly exhibited synergistic effects, with synergistic proportions of 86.96% and 100%, respectively.
Overall, the relationship between the distinct functions of cultivated land during the five time periods was mainly collaborative, with the highest proportions of collaboration in 2000 and 2010, and the strongest synergistic effect was observed between APF-SSF. The year with the highest proportion of trade-offs was 2020, when the APF-EMF trade-off had the strongest effect. This indicated that agricultural production and social security promote each other, while ecological maintenance inhibits them. Notably, the relationship between APF-SSF shifted significantly from high synergy to high trade-off between 2000 and 2020 (Figure 6). This may have occurred due to socioeconomic development in the southwestern mountainous region, which altered resource allocation priorities. More resources may have been allocated to agricultural production to meet food demands, thereby reducing the relative investments in social security.

3.4 Analysis of the factors influencing MCL

Using Canoco 5.0 software to analyze the factors influencing MCL, a two-dimensional ranking chart (Figure 7) was obtained from the RDA analysis. In the diagram, blue lines represent MCL indicators, while red lines represent influencing factor indicators. The length of an arrow reflects the explanatory power of that influencing factor on MCL. The longer the length, the higher the explanatory power of the influencing factor, and the greater the impact on MCL. When the angle between the direction of the influencing factor arrow and the direction of the MCL arrow is less than 90°, it indicates a positive correlation. An angle greater than 90° indicates a negative correlation. The total explanatory rates of the influencing factors on MCL in the southwestern mountainous areas in 2000, 2005, 2010, 2015, and 2020 were 55.2%, 54.85%, 51.87%, 45.80%, and 54.34%, respectively. This analysis only indicated the primary and secondary explanatory rates, which accounted for the majority. Note that the final subplot “Average” in Figure 7f represents the mean values of impact factors across five years: 2000, 2005, 2010, 2015, and 2020.
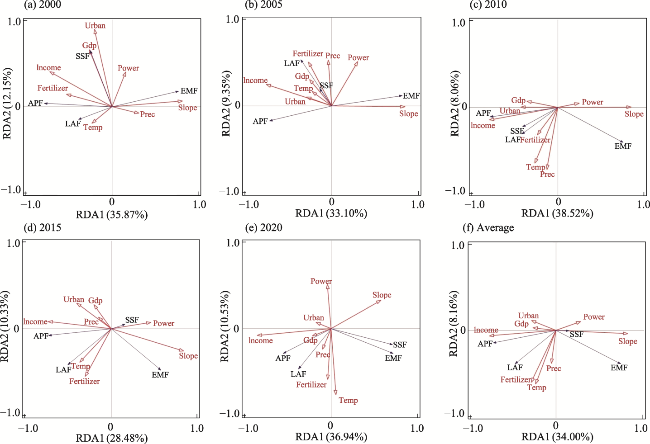
Figure 7 Factors influencing MCL in southwestern mountainous areas from 2000 to 2020
The results indicated that in 2000, the slope, urbanization rate, per capita GDP, and per capita net income of rural residents had significant explanatory power for MCL, indicating that natural and socioeconomic factors are the main factors influencing MCL, with APF, SSF, and EMF being more strongly affected. The slope was positively correlated with EMF, negatively correlated with APF and SSF, positively correlated with the per capita GDP and per capita net income of rural residents, but negatively correlated with EMF.
In 2005, the slope, precipitation, application amounts of agricultural fertilizers, total power of agricultural machinery, and per capita net income of rural residents had significant explanatory power for MCL, indicating that natural and agricultural modernization factors were the main factors influencing MCL, with APF, LAF, and EMF being more strongly affected. Slope and precipitation were positively correlated with EMF and negatively correlated with APF. Agricultural fertilizer application and per capita net income of rural residents were positively correlated with APF and LAF, but negatively correlated with EMF.
In 2010, the slope, temperature, precipitation, and per capita net income of rural residents had significant explanatory power for MCL, indicating that natural and socioeconomic factors were the main factors influencing MCL, with APF and EMF being more strongly affected. The slope was positively correlated with EMF but negatively correlated with APF. Temperature and precipitation were positively correlated with APF and EMF. The per capita net income of rural residents was positively correlated with APF but negatively correlated with EMF.
In 2015, the slope, application amounts of agricultural fertilizers, and per capita net income of rural residents had significant explanatory power for MCL, and they were the main factors influencing MCL, with APF, LAF, and EMF being more strongly affected. The slope was positively correlated with EMF but negatively correlated with APF and LAF. The amount of agricultural fertilizer applied was positively correlated with APF, LAF, and EMF. The per capita net income of rural residents was positively correlated with APF and LAF, but negatively correlated with EMF.
In 2020, the slope, temperature, and per capita net income of rural residents had significant explanatory power for MCL, indicating that natural and socioeconomic factors were the main factors influencing MCL, with APF, SSF, EMF, and LAF being more strongly affected. The slope was positively correlated with SSF and EMF, but negatively correlated with APF and LAF. Temperature was positively correlated with APF, SSF, EMF, and LAF. Per capita net income of rural residents was positively correlated with APF and LAF, but negatively correlated with SSF and EMF.
From the average MCL values of the five time periods from 2000 to 2020, the slope, temperature, application amounts of agricultural fertilizer, and per capita net income of rural residents had greater explanatory power for MCL and were the main factors influencing MCL. The APF, EMF, and LAF were more strongly affected. The slope was positively correlated with EMF but negatively correlated with APF and LAF. The per capita net income of rural residents was positively correlated with APF, LAF, and EMF. Overall, the slope was the main factor affecting the EMF of cultivated land and promoting its development. The per capita net income of rural residents was the main factor influencing APF, SSF, and LAF, and promoting the production, social security, and landscape ecology of cultivated land.

4 Discussion

The southwestern mountainous areas are not only an important region for the Western Development Strategy of China, but they also play crucial roles in national security and ecological protection. For a long time, the rapid expansion of construction land and unreasonable use of cultivated land have caused problems such as marginalization, extensive use, anti-intensification, non-grain conversion, and non-agriculturalization of cultivated land, posing a serious threat to the sustainable development of agriculture. Therefore, exploring MCL in the southwestern mountainous areas under the background of sustainable agricultural development is crucial for understanding and conserving cultivated land. It will also aid in designing rational land-planning and management policies and optimizing resource allocation. In addition, a critical question must be added: Why does this study explore MCL under the background of sustainable agricultural development? This connection is important because sustainable agriculture emphasizes the sustainability of cultivated land development, and how to meet the production needs of cultivated land while ensuring the long-term rational use of cultivated land resources. Specifically, sustainable agriculture requires the reasonable utilization of cultivated land, through technological and institutional changes, to ensure the sustainability of meeting the human food demand. How can cultivated land promote sustainable agricultural development? Cultivated land serves as the fundamental basis for achieving sustainable agricultural progress, and its quality plays a crucial role in determining the healthy developmental capacity of agriculture. The functions of cultivated land are important for measuring sustainable agricultural development. Previous MCL studies that did not consider the background of sustainable agricultural development often overlooked the ecological and landscape functions of cultivated land, and they placed too much emphasis on its production function. Thus, such research lacks a holistic perspective.
What measures should be taken in southwestern mountainous areas to promote the high-quality development of cultivated land and sustainable agriculture? First, the distribution pattern of MCL shows that the low-value areas of MCL are mainly distributed in northwest Sichuan, where the APF and LAF have grown rapidly. The most typical is Ganzi, where the ecology is inherently fragile and unsuitable for large-scale development. Therefore, it is necessary to control the expansion of construction land, implement the policy of returning cultivated land to forests according to local conditions, and develop ecotourism appropriately. In addition, the high-value areas of MCL appeared in the Sichuan Basin and Yunnan Province, with significant increases in SSF, EMF, and LAF in Yunnan Province. However, the increase in the Sichuan Basin was slower, and even showed some reductions. Therefore, these areas need to vigorously promote agricultural modernization, innovate agricultural machinery and equipment, and accelerate the promotion of new agricultural technologies. For Yunnan Province, due to its relatively outdated transportation mode and production level in the past, there is great potential for the development of cultivated land in the later stages. This region should focus on developing EMF, continuously improving its cultivated land quality, and optimizing the allocation of cultivated land resources while ensuring national food security. The analysis of influencing factors showed that natural factors promoted EMF, and the per capita net income of rural residents had the greatest impact on MCL. Therefore, it is necessary to consolidate poverty alleviation achievements and improve the incomes of rural residents. In the current national situation, a significant income gap exists between urban and rural residents. How to increase the income of rural residents through cultivated land, ensure food production and safety, and enhance MCL value will be key focus areas of future research.
This study also has some shortcomings. First, in terms of data acquisition, the soil and cultivated land quality grade data were not obtained. Subsequent research should incorporate soil, water system, and road data into the MCL evaluation to enhance the theoretical and practical significance. Second, for the research scale, it is necessary to narrow the research scope according to reality; carry out MCL evaluations for counties, towns, and villages; formulate practical and feasible land management measures; and achieve agricultural modernization. Third, in the evaluation of MCL relationships, future research should further refine and divide them into single-function, dual-function, triple-function, and multifunctional trade-off collaborative relationships. Fourth, due to data acquisition limitations, this study did not collect more accurate land use/land cover data for continuous years to evaluate the long-term MCL problem in a more detailed manner. This needs to be investigated further in the future.

5 Conclusions

This study used the southwestern mountainous area as an example, starting from the APF, SSF, EMF, and LAF of cultivated land, and evaluated the spatiotemporal evolution patterns, trade-off and synergy relationships, factors influencing the MCL in 46 cities (prefectures) from 2000 to 2020. To a certain extent, it enriches the research on MCL in the southwestern mountainous area under the background of sustainable agricultural development. The main conclusions are fivefold.
(1) From 2000 to 2020, the overall MCL value showed a sustainable growth trend, with the average MCL value in various cities (prefectures) rising from 0.361 to 0.503. Due to the limited natural environment and economic conditions, the spatial distribution showed a pattern of “high in the south and low in the north” over time. The rate of change of MCL increased over time and formed a spatial pattern of “high in the south and low in the north”. Yunnan and Guizhou in the south grew faster, while Sichuan grew slower, and some areas in northwest Sichuan experienced a decline.
(2) Over the past two decades, the APF, SSF, EMF, and LAF have shown increasing trends, with the growth rate ranking of SSF > EMF > LAF > APF. This indicates that the proportion of agricultural workers and per capita primary industry output value in the region have increased rapidly, while the growth rate of grain production has been relatively slow. The distributions of the four functional values and their rates of change showed obvious spatial agglomeration characteristics. The high-value areas generally appear in the Sichuan Basin and the Yunnan-Kweichow Plateau, and the low-value areas generally appear in the northern Sichuan alpine region.
(3) There were clear correlations between MCLs from 2000 to 2020, and a considerable number of MCL correlations increased significantly over time. Generally, the SSF-EMF is considered to have the strongest synergistic relationship, while APF-EMF has the strongest trade-off relationship.
(4) There were significant spatial differences in trade-offs and synergies between MCLs at various times. The synergy ratio was higher than the trade-off ratio in 2000, 2005, and 2010, but by 2015 and 2020, the trade-off ratio was higher than the synergy ratio. Overall, the relationships between the different functions of cultivated land are mainly based on synergy, with the highest proportions of synergy in 2000 and 2010, and the strongest synergy between APF-SSF. The highest proportion of trade-offs in 2020 was for APF-EMF, which had the strongest impact. This indicates that agricultural production and social security promote each other, while ecological maintenance depends on each of them.
(5) Over time, the main factors influencing MCL have changed. Among natural factors, slope had the strongest explanatory power and greatest impact on the EMF of cultivated land. Among socioeconomic factors, the per capita net income of rural residents was the main factor influencing the APF, SSF, and LAF of cultivated land, which had a significant promoting effect on them.
[1]
Aizaki H, Sato K, Osari H. 2006. Contingent valuation approach in measuring the multifunctionality of agriculture and rural areas in Japan. Paddy and Water Environment, 4(4): 217-222.

[2]
Chen M Q, Wang G Y. 2013. Empirical research on the farmer’s understanding to non-product function of cultivated land and the quantization: based on 1065 questionnaires. China Land Science, 27(3): 10-16. (in Chinese)

[3]
Chen Y L, Tao T H, Ding P. 2017. Spatial-temporal distribution characteristics of air quality in urban agglomeration of the Yangtze River Delta. Resources and Environment in the Yangtze Basin, 26(5): 687-697. (in Chinese)

[4]
Fan Y T, Jin X B, Gan L, et al. 2023. Exploring an integrated framework for “dynamic-mechanism-clustering” of multiple cultivated land functions in the Yangtze River Delta region. Applied Geography, 159: 103061. DOI: 10.1016/j.apgeog.2023.103061.

[5]
Fan Y T, Jin X B, Xiang X M, et al. 2018. Evaluation and spatial characteristics of arable land multifunction in southern Jiangsu. Resources Science, 40(5): 980-992. (in Chinese)

DOI

[6]
Feng Q, Zhao W W, Hu X P, et al. 2020. Trading-off ecosystem services for better ecological restoration: A case study in the Loess Plateau of China. Journal of Cleaner Production, 257: 120469. DOI: 10.1016/j.jclepro.2020.120469.

[7]
Fotheringham A S, Yang W B, Kang W. 2017. Multiscale geographically weighted regression (MGWR). Annals of the American Association of Geographers, 107(6): 1247-1265.

[8]
Fu S K, Li X F, Peng J C, et al. 2018. Study on the measurement of urbanization quality of Yangtze River Delta urban agglomeration based on dynamic factor analysis. Resources and Environment in the Yangtze Basin, 27(9): 1909-1918. (in Chinese)

[9]
Gao X, Song Z Y, Li C X, et al. 2021. Spatial differentiation characteristics of cultivated land multifunctional value under urban-rural gradient. Transactions of the Chinese Society of Agricultural Engineering, 37(16): 251-259. (in Chinese)

[10]
Hao X, Yuan S F, Prishchepov A V. 2023. Spatial-temporal heterogeneity of ecosystem service interactions and their social-ecological drivers: Implications for spatial planning and management. Resources, Conservation and Recycling, 189: 106767. DOI: 10.1016/j.resconrec.2022.106767.

[11]
Hu W Y, Zhu Q Y, Zhang A L, et al. 2018. Impacts of multifunctional farmland on agricultural economic growth at county-level from the perspective of quantity and structure: Evidence from Hubei Province. China Land Science, 32(5): 62-70. (in Chinese)

[12]
Huang Z H, Song W H, Cheng W S, et al. 2022. Has the development of leisure agriculture and rural tourism promoted the increase of farmers’ income: An evidence from quasi-natural experiment. Economic Geography, 42(5): 213-222. (in Chinese)

[13]
Jiang G H, Wang M Z, Qu Y B, et al. 2020. Towards cultivated land multifunction assessment in China: Applying the “influencing factors-functionsproducts-demands” integrated framework. Land Use Policy, 99: 104982. DOI: 10.1016/j.landusepol.2020.104982.

[14]
Li S N, Shao Y Z, Hong M J, et al. 2023. Impact mechanisms of urbanization processes on supply-demand matches of cultivated land multifunction in rapid urbanization areas. Habitat International, 131: 102726. DOI: 10.1016/j.habitatint.2022.102726.

[15]
Liang X Y, Jin X B, Sun R, et al. 2021. A typical phenomenon of cultivated land use in China’s economically developed areas: Anti-intensification in Jiangsu Province. Land Use Policy, 102: 105223. DOI: 10.1016/j.landusepol.2020.105223.

[16]
Liu Y Y, Wang S Q, Wang X B, et al. 2020. Flood risk assessment in Bangladesh, India and Myanmar based on the AHP weight method and entropy weight method. Geographical Research, 39(8): 1892-1906. (in Chinese)

[17]
Lyu L G, Gao Z B, Long H L, et al. 2021. Farmland use transition in a typical farming area: the case of sihong county in the Huang-Huai-Hai Plain of China. Land, 10(4): 347. DOI: 10.3390/land10040347.

[18]
Meng X F, Zhang W. 2018. Research on spatial measure and evolution of economic connection in urban agglomeration of Yangtze River Delta. Modern Surveying and Mapping, 41(2): 31-34. (in Chinese)

[19]
Niu H P, Zhao X M, Xiao D Y, et al. 2022. Spatial-temporal pattern evolution and trade-off relationship of cultivated land multifunction in the Yellow River Basin (Henan Section). Transactions of the Chinese Society of Agricultural Engineering, 38(23): 223-236. (in Chinese)

[20]
Niu S D, Fang B. 2019. Cultivated land protection system in China from 1949 to 2019: historical evolution, realistic origin exploration and path optimization. China Land Science, 33(10): 1-12. (in Chinese)

[21]
Pang X F, Lu R C, Li S Q, et al. 2023. Analysis of multi-functional temporal and spatial differentiation pattern and agglomeration characteristics of cultivated land in Guangxi border areas. Chinese Journal of Agricultural Resources and Regional Planning, 44(7): 49-59. (in Chinese)

[22]
Rodríguez J P, Beard T D, Bennett E M, et al. 2006. Trade-offs across space, time, and ecosystem services. Ecology and Society, 11(1): 709-723.

[23]
Schindler J, Graef F, König H J. 2015. Methods to assess farming sustainability in developing countries: A review. Agronomy for Sustainable Development, 35(3): 1043-1057.

[24]
Su Y, Li C L, Wang K, et al. 2019. Quantifying the spatiotemporal dynamics and multi-aspect performance of non-grain production during 2000-2015 at a fine scale. Ecological Indicators, 101: 410-419.

[25]
Wang C, Peng Q, Tang N, et al. 2018. Spatio-temporal evolution and the synergy and trade-off relationship of cultivated land multi-function in 2005-2015: A case of Shapingba District, Chongqing City. Scientia Geographica Sinica, 38(4): 590-599. (in Chinese)

DOI

[26]
Xiong J H, Han S C, Bao B F. 2017. Study on the evaluation of land use efficiency in the Pearl River Delta urban agglomeration based on the malmquist index. Research of Soil and Water Conservation, 24(4): 119-122. (in Chinese)

[27]
Xu D Y, Pu L J, Huang S H, et al. 2022. Spatial and temporal dynamic analysis of cultivated land multifunction in Jiangsu Province and its response to cultivated land changes. Resources and Environment in the Yangtze Basin, 31(3): 575-587. (in Chinese)

[28]
Xu X, Wang Y Y. 2023. Spatial-temporal pattern and influencing factors of the coupled and coordinated development between new urbanization and rural revitalization. Statistics & Decision, 39 (5): 50-55. (in Chinese)

[29]
Yang R Y, He Y M, Zhong C B, et al. 2024a. Study on the spatiotemporal evolution and influencing factors of forest coverage rate (FCR): A case study on Yunnan Province based on remote sensing image interpretation. Forests, 15(2): 238. DOI: 10.3390/f15020238.

[30]
Yang R Y, Zhong C B, Yang Z S, et al. 2024b. Study on China’s Farmland-Grain resource curse: Empirical testing based on 31 provinces and 2843 counties. Land Use Policy, 144: 107241. DOI: 10.1016/j.landusepol.2024.107241.

[31]
Yang Z S. 2020. Land resource science, Beijing, China: Economic Management Press. (in Chinese)

[32]
Yang Z S, Liu Y S, He Y M, et al. 2008. The principles and methods of eco-friendliness evaluation of land use in mountainous areas at county level and its case study. Journal of Natural Resources, 23(4): 600-611. (in Chinese)

DOI

[33]
Yang Z S, Yang S Q, Yang R Y, et al. 2023. A study on spatiotemporal changes of ecological vulnerability in Yunnan Province Based on interpretation of remote sensing images. Diversity-Basel, 15(9): 963. DOI: 10.3390/d15090963.

[34]
Zhang C, Wang Q, Chen J P, et al. 2011. Evaluation of debris flow risk in Jinsha River based on combined weight process. Rock and Soil Mechanics, 32(3): 831-836. (in Chinese)

[35]
Zhang J Y, Cai H S, Zhang X L, et al. 2023. Multi-functional spatiotemporal evolution of cultivated land and its driving mechanisms in Poyang Lake Plain. Bulletin of Soil and Water Conservation, 43(3): 245-253. (in Chinese)

[36]
Zhu F, Zhang H W. 2017. “AHP + entropy weight method” based CW-TOPSIS model for predicting rockburst. China Safety Science Journal, 27(1): 128-133. (in Chinese)

[37]
Zhu Q Y, Hu W Y, Zhao Z S. 2018. Dynamic analysis on spatial-temporal pattern of trade-offs and synergies of multifunctional cultivated land—Evidence from Hubei Province. Economic Geography, 38(7): 143-153. (in Chinese)

[38]
Zou L L, Li Y Y, Liu Y S. 2021. Theory building and empirical research of production-living-ecological function of cultivated land based on the elements. Geographical Research, 40(3): 839-855. (in Chinese)

Outlines

/