
Journal of Resources and Ecology >
How Does Villager Participation Influence the Efficiency of Improvements to the Rural Human Settlement Environment?
|
LIN Limei, E-mail: lin_limei07@126.com |
Received date: 2024-12-03
Accepted date: 2025-03-20
Online published: 2025-05-28
Supported by
Key Project of the National Social Science Fund(24ASH010)
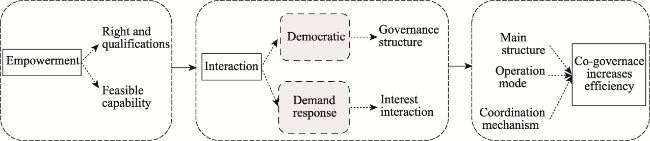
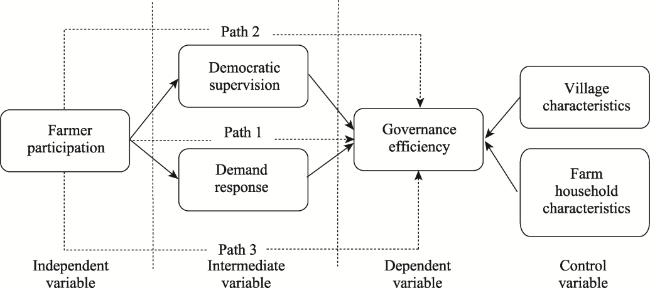
The governance of rural human settlements has long relied on a government-led model, leading to the dilemma of high costs and low effectiveness. Although farmer participation is regarded as crucial for improving governance efficiency, its specific pathways of influence remain unclear. This study constructed a theoretical framework to analyze how farmer participation affects the efficiency of village-level human settlement governance. Based on survey data from 1401 farmers and 192 villages in Northwest Fujian Province, this study employed the Data Envelopment Analysis (DEA) method to measure governance efficiency, used the Tobit model to explore the pathways of impacts from farmer participation, and established a mediation effect model to test the intermediary roles of democratic supervision and demand responsiveness. Key findings: (1) Farmer participation enhances the governance efficiency of rural human settlements through the logical chain of “empowerment” - “government-society interaction” - “common governance”. (2) Democratic supervision and demand responsiveness exhibit significant mediation effects, indicating that farmer participation improves governance efficiency by activating these mechanisms. Policy implications: Farmer participation, reinforced by democratic supervision and demand-responsive mechanisms, serves as an endogenous driver for enhancing governance efficiency. Policy design should focus on institutionalizing participatory channels, optimizing closed-loop demand-response systems, and strengthening the environmental protection capacities of farmers. Future research should be extended to regional comparisons and dynamic effect analyses to validate the universality of these mechanisms.
LIN Limei , ZHANG Yuedong , LI Jun , LAI Yongbo . How Does Villager Participation Influence the Efficiency of Improvements to the Rural Human Settlement Environment?[J]. Journal of Resources and Ecology, 2025 , 16(3) : 702 -714 . DOI: 10.5814/j.issn.1674-764x.2025.03.008
Figure 1 Logic and mechanism of the effect of farmer participation on the efficiency of village habitat management |
Figure 2 Theoretical analysis framework |
Table 1 Distribution of the survey sample |
| City | County (district) | Sample townships (towns) | Number of villages | Number of farmers | Percentage of villages (%) |
|---|---|---|---|---|---|
| Nanping | Jianyang | Masha, Shufang, Shuiji, Tancheng, Tongyou, Xushi, Zhangdun | 47 | 330 | 24.48 |
| Jian’ou | Dikou, Fangdao, Xiaoqiao, Xiaosong, Xudun, Yushan | 26 | 233 | 13.54 | |
| Shunchang | Yuankeng, Zhengfang | 14 | 120 | 7.29 | |
| Zhenghe | Chengyuan, Dongping, Tieshan, Waitun, Xingxi, Xiongshan, Zhenqian | 49 | 373 | 25.52 | |
| Longyan | Changting | Sanzhou, Tieshan, Tongfang, Tufang, Xinqiao, Zhuotian | 30 | 177 | 15.63 |
| Xinluo | Dongxiao, Hongfang, Jiangshan, Longmen | 26 | 168 | 13.54 |
Table 2 Input-output indicators for measuring the efficiency of rural habitat management |
| Type | Target | Meaning and indicator components |
|---|---|---|
| Inputs | Financial inputs | Funds for the purchase of equipment for governance facilities (million yuan yr-1) |
| Management and maintenance funds (million yuan yr-1) | ||
| Land inputs | Area of land for construction of treatment facilities (ha) | |
| Labor inputs | Number of environmental personnel (persons) | |
| Outputs | Ecological outputs | Coverage of household latrines (%) |
| Domestic sewage collection and treatment rate (%) | ||
| Domestic waste disposal rate (%) | ||
| Social outputs | Increased environmental awareness among farmers | |
| Farmers’ environmental habits improve |
Table 3 Basis and meaning of the division of farmer participation behaviors |
| Behavioral level | Behavioral interpretation | Farmer participation behavior |
|---|---|---|
| Manipulated lead | Passive acceptance of policies and programs already formulated by the government or relevant agencies | Non-participation |
| Pass | Access to governance information such as policies, plans, targets, etc., through bulletin boards, pamphlets, microblogging groups, and others, but not yet substantive engagement | Receive information |
| Inquiry reassure | Expressing their opinions and demands, participating in discussions, and making suggestions through the Farmers’ Congress, the Farmers’ Representative Assembly, and others, but with no autonomy over whether the suggestions are adopted | Device |
| Collaborative authorizations | Substantive cooperation with government or relevant institutions in the development and implementation of governance policies and plans, with decision-making authority that directly affects the governance processes and outcomes | Participation in decision-making |
| Citizen control | Greater decision-making power and control through self-organization, self-management and self-supervision | Organization and management |
Table 4 Descriptive statistics of the variables |
| Variable | Variable meaning and assignment | Average value | Standard errors | Minimum value | Maximum value |
|---|---|---|---|---|---|
| Efficiency of village habitat management | DEA model measurements | 0.474 | 0.305 | 0.067 | 1 |
| Farmer participation | Arithmetic mean of participatory behaviors in the five habitat governance components No participation at all = 1, Receive information = 2, Provide advice = 3, Participate in decision-making = 4, Organize and manage = 5 | 2.934 | 0.909 | 1 | 4.875 |
| Farmer demand response | Hardly ever = 1, Occasionally = 2, Usually = 3, More often = 4, Very often = 5 | 2.734 | 1.143 | 1 | 5 |
| Supervision of village information | Hardly ever = 1, Occasionally = 2, Usually = 3, More often = 4, Very often = 5 | 3.245 | 1.100 | 1 | 5 |
| Village population size | Registered population in the village | 1935.766 | 1491.507 | 186 | 14381 |
| Geographic location of villages | Physical distance of the village council from the county town①(km) | 23.941 | 19.046 | 1 | 80 |
| Environmental pollution in the village | Environmental pollution in the village before treatment Rarely = 1, Less often = 2, Fairly often = 3, More severe = 4, Very severe = 5 | 3.578 | 0.821 | 1 | 5 |
| Proportion of out-of-home workers | Percentage of laborers who have been working outside the county for more than half a year: Below 30% = 1, around 40% = 2, around 50% = 3, around 60% = 4, above 70% = 5 | 2.536 | 1.092 | 1 | 5 |
| Village collective income | Average annual income of village collectives in the last five years (ten thousand yuan) | 18.957 | 29.164 | 0 | 200 |
①The shortest road distance between the two locations was calculated using AutoNavi Map software. |
Table 5 Estimated results of the impact of farmer participation on the efficiency of village habitat management |
| Variable | Model (1) | Model (2) |
|---|---|---|
| Farmer participation | 0.091*** | 0.061*** |
| (0.023) | (0.023) | |
| Population size of farm households② | - | 0.079** |
| (0.033) | ||
| Geographic location of villages | - | 0.003*** |
| (0.001) | ||
| Environmental pollution in villages | - | -0.061** |
| (0.026) | ||
| Proportion of out-of-home workers | - | -0.059*** |
| (0.018) | ||
| Village collective income | - | -0.001 |
| (0.001) | ||
| Constant term | 0.207*** | 0.034 |
| (0.072) | (0.293) | |
| LRchi2 | 14.71 | 45.59 |
| PseudoR2 | 0.1664 | 0.5160 |
| Observations | 192 | 192 |
Note: The numbers in parentheses are standard errors; ***, **, and * indicate significance at the 1%, 5%, and 10% levels, respectively; “-” indicates that the variable was not included in the regression model. The same below. ② Since the values of regression coefficients were too small to facilitate the presentation of the results when the original value of the number of farm household population was used in the model, the logarithmic form was used for the post-processing. |
Table 6 Results of the mediation effect test for democratic supervision |
| Variable | Model (3) Supervision of village information | Model (4) Governance efficiency | Model (5) Farmer demand response | Model (6) Governance efficiency |
|---|---|---|---|---|
| Farmer participation | 0.176** | 0.0494** | 0.246*** | 0.0540** |
| (0.089) | (0.022) | (0.092) | (0.023) | |
| Supervision of village information | - | 0.0676*** | - | - |
| (0.018) | ||||
| Farmer demand response | - | - | - | 0.0296* |
| (0.018) | ||||
| Control variables | Controlled | Controlled | Controlled | Controlled |
| Constant term | 1.102 | -0.0512 | 2.921** | -0.0774 |
| (1.103) | (0.281) | (1.252) | (0.293) | |
| LRchi2 | 11.24 | 59.74 | 14.78 | 48.38 |
| PseudoR2 | 0.0194 | 0.6761 | 0.0248 | 0.5476 |
| Observations | 192 | 192 | 192 | 192 |
Note: Control variables are the same as in Table 2. The same below. |
Table 7 Robustness and endogeneity test results |
| Variable | Replacement of independent variables | Replacement of the dependent variable | First stage | Second stage |
|---|---|---|---|---|
| Governance efficiency | Satisfaction | Farmer participation | Governance efficiency | |
| Collective participation | 0.469*** | - | - | |
| (0.121) | ||||
| Farmer participation | - | 0.358*** | - | 0.327*** |
| (0.030) | (0.109) | |||
| Instrumental variable: Whether a system of incentives and disincentives is in place | 0.232*** | - | ||
| (0.054) | ||||
| Constant term | -0.162 | 2.672*** | 2.674*** | -0.756 |
| (0.296) | (0.384) | (0.874) | (0.526) | |
| LRchi2 | 52.94 | 117.17 | 36.09 | - |
| PseudoR2 | 0.5992 | 0.4444 | 0.0711 | - |
| Observations | 192 | 192 | 192 | 192 |
| [1] |
|
| [2] |
|
| [3] |
|
| [4] |
|
| [5] |
|
| [6] |
|
| [7] |
|
| [8] |
|
| [9] |
|
| [10] |
|
| [11] |
|
| [12] |
|
| [13] |
|
| [14] |
|
| [15] |
|
| [16] |
|
| [17] |
|
| [18] |
|
| [19] |
|
| [20] |
|
| [21] |
|
| [22] |
|
| [23] |
|
| [24] |
|
| [25] |
|
| [26] |
|
| [27] |
|
| [28] |
|
| [29] |
|
| [30] |
|
| [31] |
|
| [32] |
|
| [33] |
|
| [34] |
|
| [35] |
|
/
| 〈 |
|
〉 |