Human Activities and Sustainable Development

Understanding Farmers’ Willingness to Participate in Organic Tea Cultivation Insurance: The Roles of Risk Experience, Information Asymmetry and Organizational Factors

  • XU Guoxing ,
  • LIU Xuehan ,
  • LI Tan , *
Expand
  • School of Economics and Management, Anhui Agricultural University, Hefei 230036, China
* LI Tan, E-mail:

XU Guoxing, E-mail:

Received date: 2024-08-19

  Accepted date: 2025-01-16

  Online published: 2025-05-28

Supported by

National Key Research and Development Program of China(2023YFD1700205-4)

General Program of Humanities and Social Sciences Research of Ministry of Education of China(23YJCZH108)

Central Agricultural Office Soft Science Subjects of the Expert Advisory Committee on Rural Revitalization of the Ministry of Agriculture and Rural Affairs of China(202331)

National Key Research and Development Program of the 14th Five-Year Plan of China(2023YFD1700205)

Abstract

Organic tea insurance is essential for protecting the livelihoods of tea farmers, yet its uptake remains limited due to a potential misalignment between the program’s design and farmers' objectives. This study used a discrete choice experiment to explore how risk perceptions and information asymmetry influence farmers’ decisions to purchase organic tea insurance. It also assessed the role of farmer cooperative organizations in facilitating these decisions. We collected data from 323 tea farmers in Anhui Province to estimate their willingness to pay (WTP) for specific insurance features. The results indicate a preference for having organic tea insurance, especially among farmers who have experienced agricultural disasters and are informed about insurance options. However, participation in farmer cooperatives did not significantly enhance mutual understanding or trust in the insurance scheme. Using a random parameter logit model, we found that the WTP varied significantly with changes in the insurance claim starting point (by 1258.44 yuan ha-1) and the government subsidy ratio (by 819.69 yuan ha-1). In contrast, modifications in claim payment timing and total indemnity affected WTP minimally, the impact of claim payment time on WTP is 19.70 yuan ha-1, and the change in total indemnity has an impact of 0.32 yuan ha-1 on WTP. Applying a latent class model, we categorized farmers into two distinct groups based on their attribute preferences and price sensitivities, which remained consistent across robustness tests using an attribute non-attendance regression. This study offers new insights into farmers’ preferences and behaviors toward organic tea insurance, emphasizing the significance of risk experience and information symmetry in their decision-making processes.

Cite this article

XU Guoxing , LIU Xuehan , LI Tan . Understanding Farmers’ Willingness to Participate in Organic Tea Cultivation Insurance: The Roles of Risk Experience, Information Asymmetry and Organizational Factors[J]. Journal of Resources and Ecology, 2025 , 16(3) : 687 -701 . DOI: 10.5814/j.issn.1674-764x.2025.03.007

1 Introduction

The vulnerability of farmers, particularly those from impoverished households dependent on agriculture, has become an increasingly critical issue within the agricultural sector. This vulnerability is especially pronounced in organic agriculture, where farmers face distinct challenges that exacerbate their economic instability. Organic crop insurance is pivotal for mitigating the effects of both natural and anthropogenic disasters on crop yields, stabilizing incomes amidst market fluctuations, influencing cropping decisions, and enhancing the post-disaster resilience of farmers (Chantarat et al., 2013; Akter et al., 2017; Yu et al., 2018). Ensuring robust farmer engagement in these insurance programs is essential for achieving the developmental goals of organic agriculture and ecosystem conservation.
China plays a dominant role in the global tea market, accounting for nearly 43% of the world’s tea production as of 2019 (FAO, 2019). In the organic tea sector, China represented 53.8% of the organic tea imports into the United States as of January 2023 (GATS, 2023). Despite this significant market presence, the Chinese tea insurance sector encounters several challenges, including limited coverage, high barriers to initiating claims, and a lack of awareness and understanding among farmers regarding their insurance options (Nyaaba et al., 2019; Ali et al., 2021). These barriers limit farmer participation and the effectiveness of insurance initiatives, thus restricting the expansion of organic agricultural insurance coverage.
Previous studies have investigated the factors that influence farmers’ participation in agricultural insurance programs, primarily focusing on issues like adverse selection, moral hazard, premium settings, and transaction costs (Skees and Reed, 1986; Nelson and Loehman, 1987; Chambers, 1989; Miranda, 1991). A common theme in this body of literature is the vulnerability of farmers to adverse selection and moral hazard, which arise from informational asymmetries in procuring agricultural insurance (Surminski, 2016). However, a notable gap remains in research concerning insurance for organic tea, particularly regarding risk experiences, information dissemination channels, and the impact of farmer organizations.
To address this gap, this study employed the discrete choice experiment (DCE) methodology, drawing on Lancaster’s (1966) consumer theory and McFadden’s (1980) random utility theory. We conducted an empirical analysis using DCE with a sample of 323 organic tea cultivators from Youfangdian Township in Jinzhai County, Lu’an City, Anhui Province—a region known for producing Lu'an Gua Pian, one of China’s top ten famous teas. Participants were presented with a few hypothetical insurance improvement schemes and a non-participation option in a discrete choice experiment. The data were analyzed using random parameter logit (RPL) and latent class models (LCM).
The DCE method is widely employed in agricultural economics to elucidate stakeholder preferences regarding insurance design and credit selection (Doherty et al., 2021; Shee et al., 2021). This study aims to provide insights into effective insurance plan designs that align with farmers' preferences, focusing particularly on understanding the factors that influence their willingness to engage with organic tea insurance initiatives. We explore how insurance attributes, socio-demographic factors, risk experiences, information asymmetry, and farmers’ organizational involvement impact their willingness to pay (WTP). By examining these dynamics, we seek to contribute valuable insights for policy formulation, with the aim of assisting farmers in managing the risks associated with organic tea cultivation and insurance. Furthermore, this study contributes to the theoretical development of DCE methodologies and WTP assessments for agricultural insurance, a currently underexplored area in the literature.
This study contributes to the literature by examining factors that influence tea farmers’ decisions to purchase organic tea insurance, with a focus on risk experience, information asymmetry, and the role of farmer organizations. Understanding these dynamics is crucial for understanding tea farmers’ investment decisions in organic tea insurance and offers valuable insights for policymakers and insurance providers in the agricultural sector. By assessing how the design of a particular insurance scheme influences farmers’ willingness to insure, the latent class model reveals heterogeneity in the decision-makers’ preferences. This analysis may enhance the uptake of insurance by identifying farmers who would constitute the appropriate target groups for organic tea insurance. Our findings are also relevant for designing similar insurance products for tea or other cash crops in developing countries such as Sri Lanka, Kenya, India, and other emerging economies.
This paper outlines our study within the framework of contextual experience theory. We start with a literature review linking economic theories of choice behavior to individual farmer experiences, and derive three hypotheses regarding their preferences for purchasing organic tea insurance. We then introduce a model that demonstrates how personal experience influences farmers’ willingness to buy tea insurance. Next, we analyze the empirical data from a DCE survey to explore how contextual factors affect farmers’ interactions with insurance attributes. Finally, we discuss the diversity of insurance preferences revealed through our policy and empirical model analyses.

2 Background and literature review

2.1 Background

China has made substantial strides in promoting sustainable agriculture, evidenced by significant legislative efforts. From 2012 to 2016, Chinese policymakers have expanded agricultural insurance coverage for essential sectors, including organics, and introduced tailored insurance for local crops and pilot programs for income insurance (SCPRC, 2012; 2016). By 2022, China inaugurated its first comprehensive income insurance option for organic tea in Pu’er, Yunnan, covering around 134 ha (MFPRC, 2022). This initiative integrates multiple insurance aspects but still faces challenges, such as reaching a 1% depth and density ratio and achieving an insurance penetration of only 500 yuan per tea farmer.
In Anhui Province, a historical center for tea cultivation, the tea industry faces natural and market risks that have prompted the promotion of specialized insurance products like yield and price insurance since 2009. As of 2022, over 5×10⁶ ha has been insured, providing security to 6×10⁵ tea growers, although the sector still features low coverage levels and limited product diversity (CISF, 2022). In addition, Lu’an City’s 2014 vision for the Lu’an Tea Valley and the subsequent “250 Kilometers Tea Valley” project in Youfangdian Township have fostered sustainable practices and boosted local tourism by showcasing traditional tea culture (PGSC, 2014).
This study focuses on Youfangdian Township, Jinzhai County (Figure 1), which is renowned for its extensive tea cultivation. Despite being a leader in tea insurance, the uptake of organic tea insurance in this township remains low. Through a structured survey of six villages conducted in June 2022, this study explores the determinants influencing farmers’ willingness to pay for agricultural insurance, with the aim of advancing organic tea insurance initiatives and supporting the livelihoods of tea growers in the region.
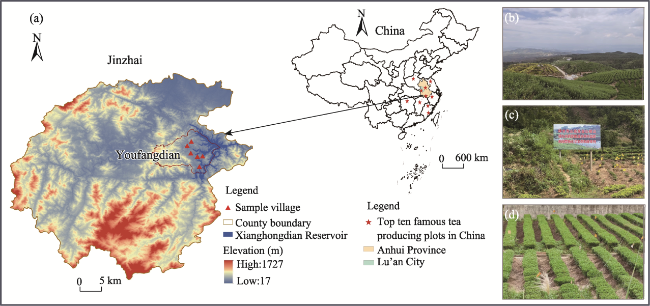
Figure 1 Location, elevation and some sample fields in the study areas

2.2 Literature review

2.2.1 Contextual experience theory

Over the past three decades, the significance of contextual factors in shaping decision-making has gained prominence in the choice modeling literature (Swait and Adamowicz, 2001). Beyond merely selecting among alternatives, the contextual backdrop of experience, memory, and history is critical for explaining significant behavioral phenomena within neoclassical choice theory and welfare measurement (McFadden, 2014). The traditional economic valuation of non-market goods is predicated on the neoclassical assumption that consumers make choices by maximizing utility within their budgetary constraints. McFadden (2014) extended this model to incorporate the influences of experience, memory, and information, and suggested that utility is a function not only of goods and services but also of experiences and unobserved tastes. This integrated approach poses considerable challenges in quantifying developmental contexts.

2.2.2 Risk experience and moral hazard

While traditional economic theories often depict actors as rational (Camerer and Fehr, 2006), behavioral economics suggests that traumatic or significant past experiences can profoundly alter an individual’s risk perception and tolerance (Cohen and Dickens, 2002). Such altered risk perceptions are crucial for understanding moral hazard, where individuals might engage in riskier behaviors under the protection of safety nets.
This theory suggests that experiencing a disaster can increase the likelihood of moral hazard in future decisions. In classical economics, moral hazard refers to a tendency to take greater risks when shielded by insurance or other safeguards (Marshall, 1976). Evidence shows that individuals who receive post-disaster aid may engage in riskier behaviors in subsequent decisions, illustrating this moral hazard effect (Becchetti et al., 2017).
Hypothesis 1: Individuals who have experienced significant risks, such as natural disasters, and subsequently received aid, develop altered perceptions of risk and safety nets that influence their decision-making, including their propensity to invest in organic tea insurance.

2.2.3 Training experience and information asymmetry

Information asymmetry occurs when one party in a transaction has more or better information than the other (Clarkson, 2007). The depth and diversity of an individual’s learning experiences can either exacerbate or mitigate this asymmetry. Comprehensive education and exposure to diverse information sources can provide individuals with better information, reducing the asymmetry in economic transactions.
Learning experiences are crucial for addressing issues of information asymmetry (Einav, 2005). A broad range of learning experiences—including formal education, informal learning, and experiential learning—equips an individual with knowledge and skills, which enhances their ability to process information and make informed decisions. This is particularly relevant in economic contexts where information asymmetry is common, such as in markets or negotiations (Izquierdo and Izquierdo, 2007).
Hypothesis 2: Individuals with a diverse array of learning experiences have a more sophisticated understanding of economic environments, enabling them to better recognize, interpret, and respond to information asymmetries, which leads to more informed and efficient economic decisions.

2.2.4 Organizational factors and collective action

The final hypothesis examines the relationship between experiences in cooperative organizations and the propensity for collective action. It suggests that individuals with experience in cooperative settings are more likely to engage in collective actions that are crucial for economic activities, like forming unions and cooperatives (Ostrom, 2000). This hypothesis is grounded in social capital theory, which posits that experiences in cooperative environments foster trust and norms conducive to collective actions (Lin, 2002).
This hypothesis maintains that individuals with cooperative experiences are better equipped to participate effectively in collective endeavors (Lubell and Scholz, 2001). Such experiences cultivate a sense of community, trust, and mutual understanding that is essential for successful collective action. Studies show that experiences within cooperative organizations lead to improved outcomes in group-based tasks and decision-making processes (Capraro and Coco- ccioni, 2015).
Hypothesis 3: Individuals with extensive experience in cooperative organizations are more likely to successfully initiate and engage in collective economic actions. These experiences build social capital, augment trust, and promote a culture of collaboration, which are essential for overcoming the challenges inherent in collective action.

3 Theoretical frameworks

3.1 The intertemporal decision model

To analyze the hypotheses proposed in Section 2, we developed a simplified utility model within an economic framework. This model employs the von Neumann-Morgenstern utility function (Fishburn and Kochenberger, 1979) to assess the impacts of various experiential factors on the utility of tea farmers.
The model employs the von Neumann-Morgenstern utility function U ( I , D , C , T ), where Iis the farmer’s decision, D represents the risk experience, C represents the organizational experience, T represents the training experience to evaluate information symmetry, and U represents the utility function.
U ( I , D , C , T ) = a × I b × P ( D ) + c × C + d × T
In a given context, the parameters a, b, c and d denote variables representing the respective influences of different factors on utility. P(D) represents risk experience, which can be expressed as a binary variable, e.g., D=1 if the disaster situation reported by the farmer is deemed untrue; otherwise, D=0. I denotes a binary variable of whether or not to purchase insurance; T represents information asymmetry, which can be reflected through training experience; and C represents the experience of the cooperative organization, which is a continuous variable signaling the magnitude of participation.
The goal of tea farmers is to maximize their utility, so they will choose the decision I that maximizes U(I, D, C, T). This can be determined by comparing the utility when insurance is purchased or not. In other words, when U(I, D, C, T)> U(0, D, C, T), they choose to purchase the insurance; otherwise, they do not purchase it.
Hence, the model can be represented by max I { 0 , 1 }U(I, D, C, T). In practice, the estimations of a, b, c and d are crucial for determining the outcome of the model.

3.2 The empirical model

Data from DCE can be analyzed using discrete choice models such as conditional logit (CL) or multinomial logit (MNL) models, which assume a Gumbel distribution for random utility and homogeneity in consumer preferences (Train, 2003).
Based on the theory of random utility (McFadden,1980; Hanemann, 1984), the utility of consumers can be segregated into an observable deterministic part and an unobservable random part. Then, the total utility of individual n from choice card j under scenario t can be represented as:
U n j t = V n j t + ε n j t
where Unjt is the total utility, Vnjt is the observable part, and ε n j tis a random error term representing the impact of unobservable factors on individual selection.
Initial discrete choice models like CL or MNL assume uniform preferences among participants, but newer approaches like random parameter logit (RPL) and latent class models (LCM) recognize preference heterogeneity. The RPL model evaluates individual differences through parameter distributions (mean, standard deviation), which allows for a nuanced understanding of each participant’s preferences. Meanwhile, LCM categorizes individuals into distinct classes based on their traits. In RPL settings, while the indemnity is a fixed parameter for iterative adjustments, attributes such as the claim starting point are treated as random variables, and others like claim arrival time, government subsidy ratio, total indemnity, and the alternative-specific constant (ASC) are fixed. The robustness of these models can be confirmed through likelihood ratio tests that achieve significant levels at 1% (Train, 2003).
According to utility maximization theory, if and only if V n j t > V n i t , j i will farmer n choose the alternative in card j under scenario t. Therefore, the probability (Pnjt) can be expressed as:
P n j t = P ( ( V n j t + ε n j t ) > ( V n i t + ε n i t ) ) j i , i C
where the observable part Vnjt is a linear function, and its formula can be expressed as:
V n j k = A S C + k = 1 K β n j k X n j k
Equation (4) defines the basic model. Vnjk is the observable part of the utility function, which is composed of a vector of various (the size is k) insurance attributes (Xnjk); Xnjk represents the k-th attribute variable in scheme j selected by experimental farmer n, and βnjk is the average coefficient of each attribute variable. Furthermore, ASC captures the average effect of unobserved factors on the choice and indicates the basic utility when farmers do not choose an improved scheme. If farmers choose to maintain the status quo, ASC is assigned 1, otherwise ASC is assigned 0.
The RPL model relaxes the assumption of independent identical distribution and allows the utility parameter to vary randomly among the farmers (Train, 2003). The probability (Pnjk) that farmer n will choose option j from multiple alternatives can be obtained by integrating:
P n j t = exp ( β n j k V n j k ) k = 1 K exp ( β n j k V n j k ) f ( β n j k ) d β n j k
where kis the insurance attribute; Kis the total number of all attributes; and f ( β n j k ) is the density function of the parameter.
Latent class models not only account for preference heterogeneity but can also reveal sources of heterogeneity (Train, 2003). They assume that the distribution of preferences is discrete rather than continuous. Preference structures within (latent) preference categories are assumed to be homogeneous, so subgroup-specific coefficients are estimated. The model estimates the class membership of an observation n assigned to a class s (s=1, …, S) with a class membership probability Hns. This probability depends on the respondent-specific covariate hn, the effect of which is denoted by δs.
H n s = exp ( δ s h n ) s = 1 S exp ( δ s h n )
where S is the total number of all classes. The class-specific predicted probability of choosing a scheme ( P n i | s) in latent class models lies in the class-specific estimates ( β n k s).
P n i | s = exp ( x n i k β n k s ) j = 1 J x n j k β n k s
where j is the option scheme and J is the total number of all option schemes.
The overall probability ( P r o b n i) that decision-maker n chooses a scheme depends on the predicted probability of choosing a scheme ( P n i | s) and the predicted probability of belonging to a certain class (Hns):
P r o b n i = s = 1 S H n s P n i | s
By estimating the parameters of each attribute, the degree of the farmer’s preference for each attribute of agricultural insurance products can be calculated using the willingness-to-pay (WTP) indicator, which can be expressed as:
W T P i = β i β p
where β pdenotes the estimated parameters of price attributes and β idenotes the estimated coefficients of other attributes in the agricultural insurance product.

3.3 Attribute non-attendance (ANA) in the
hypothetical treatment

Discrete choice experiments traditionally assume that decision makers are rational and fully weigh all attributes presented in the choice task, a concept known as fully compensatory preferences (Glenk et al., 2015). However, in scenarios involving repeated decisions, individuals exhibit preference heterogeneity and diverse “heterogeneous processing strategies”. These strategies suggest assumption bias, where respondents consider only a subset of attributes while ignoring others—a phenomenon known as attribute non- attendance (ANA) (Grammatikopoulou et al., 2019).
ANA arises from factors like unfamiliarity with the goods being valued (Sandorf et al., 2017), the use of heuristic methods to simplify decision tasks (Carlsson et al., 2010), lexicographic preferences (Sælensminde, 2006), or true zero preferences (Heidenreich et al., 2018). In addition, protest behavior against the payment mechanism or the perception that certain attributes are irrelevant can cause respondents to disregard some attributes, which affects decision making and potentially leads to biased estimates of preference parameters and willingness to pay (Weller et al., 2014; Nguyen et al., 2015).
Current research on ANA in stated choice studies distinguishes between two main methodologies: the stated non-attendance method and the analytical non-attendance method (Weller et al., 2014; Gonçalves et al., 2022). The stated method directly asks respondents whether they considered all attributes, while the analytical method uses inferential models to determine the extent of attribute consideration. In this study, we employed the stated non-attendance method to assess how ANA processing strategies influence the heterogeneity of preferences and the robustness of our model.

4 Methodology

4.1 Experimental design

The development of the discrete choice experiment (DCE) method involves a structured experimental design that meticulously defines relevant attributes and their levels. This process was conducted in multiple stages.
Initially, we reviewed the components of standard crop insurance contracts in China, focusing on elements such as insurance targets, premium costs, and government subsidies. Then, to ensure the relevance and appropriateness of our DCE, we conducted 20 in-depth interviews with farmers. These interviews helped us to identify the critical attributes and levels for inclusion in the DCE and provided preliminary insights into the farmers’ attitudes towards organic tea insurance.
Following the interviews, we developed a draft survey featuring the identified DCE attributes. This draft was tested among farmers to verify that the attributes included were comprehensive and relevant. The final selection process involved refining these attributes down to five key elements. This selection process was informed by our initial field surveys, pilot policy implementations, and consultations with experts. The essential attributes selected for our insurance plan are detailed in Table 1.
Table 1 Organic tea insurance attributes and levels
Insurance attribute Levels
Claim starting point Loss ratio 30%; Loss ratio 20%; Loss ratio 10%
Indemnity 15000 yuan ha - 1; 22500 yuan ha-1; 37500 yuan ha-1; 45000 yuan ha-1
Claim payment time 20 days; 10 days; 5 days
Government subsidy ratio 80%; 85%; 90%
Total premium 600 yuan ha-1; 675 yuan ha-1; 750 yuan ha -1

Note: The underlined values indicate the status quo of each attribute.

This study identified critical attributes that influence the effectiveness of agricultural insurance for organic tea farmers, each evaluated at different levels, to ascertain the optimal configuration that would bolster the willingness of farmers to adopt insurance.
(1) Indemnity. The current insurance policy for organic tea farming offers a maximum compensation limit of 15000 yuan ha-1, which is inadequate compared to the farmers’ average income of 60000-75000 yuan ha-1. Annual expenses for essentials like organic fertilizers and pest control range from 500-600 yuan. This compensation gap leaves farmers under protected against financial losses (Ghimire et al., 2016; Johnson et al., 2019). To address this, we proposed increasing the indemnity levels to 22500 yuan ha-1, 37500 yuan ha-1, or 45000 yuan ha-1, in addition to the existing 15000 yuan ha-1. Such increases would align the indemnity more closely with the actual income and expenses of organic tea farmers, thereby offering a more effective financial safeguard against the myriad risks inherent in organic tea cultivation.
(2) Claim payment time. This parameter indicates the time that elapses from the disaster incidence to the successful deposit of claims in the farmers’ bank accounts. Currently, the prolonged time is now about 20-25 days, due to multifaceted processes including accident reporting and on-site evaluations, which leads to farmers’ dissatisfaction and diminished willingness to re-insure in the subsequent year (Jin et al., 2016). To rectify this, we recommend reducing the claim payment time to 20, 10, or 5 days.
(3) Claim starting point. This attribute represents the minimal loss rate that qualifies farmers for compensation. Presently, the farmers are often unable to receive compensation due to a mismatch between the actual loss rate (20%-25%) and the established benchmark of 30% in the insurance clauses (Cohen and Fischhendler, 2022). To address this, we propose adjusting the loss rate at the claim initiation point to 10%, 20%, or 30%.
(4) Government subsidy ratio. This ratio delineates the extent of governmental support in the tea insurance premiums. Currently in Anhui Province, the structure is segmented as 25% provincial, 55% municipal and county, and 20% borne by farmers. Studies suggest that a favorable adjustment in this ratio can enhance the farmers’ WTP for insurance (Du et al., 2017; Yu et al., 2021). Hence, we intend to boost the subsidy ratio to 80%, 85%, or 90%.
(5) Total premium. This represents the cumulative cost farmers incur to secure insurance and integrates both individual expenditures and governmental subsidies. Given the current insurance rate of 5% and an insurance amount of 15000 yuan ha-1, the resultant premium in Lu’an City stands at 600 yuan ha-1. To alleviate the financial burden on farmers, we suggest revising the total premium levels to 600 yuan ha-1, 675 yuan ha-1, or 750 yuan ha-1.
To analyze these attributes, 324 potential attribute combination alternatives were created using JMP software for orthographic design to ensure orthogonality and balance. Sixteen schemes were selected for the final survey design, and the design efffciency (D-efficiency ) calculated using the JMP software was 96.82%, indicating a hiah degree of orthogonality (Train, 2003). Each choice set in the survey included a “neither” option to mimic real-life decisions and prevent overestimation of preferences for the improved options. To reduce respondent fatigue and ensure response quality, the choice sets were divided into two versions of the questionnaire that were distributed randomly during the survey. Table 2 illustrates a sample choice set.
Table 2 Example of a choice set
Insurance attribute Scheme A Scheme B Scheme C
Claim starting point Loss ratio 20% Loss ratio 30% Status quo
(Neither A nor B)
Indemnity 15000 yuan ha-1 22500 yuan ha-1
Claim payment time 20 days 20 days
Government subsidy ratio 90% 85%
Total premium 675 yuan ha-1 750 yuan ha-1
Your choice 

4.2 Sampling method and data overview

In the initial phase of our study, we used a two-stage random sampling method at the village level to select farmer respondents. In the first stage, trained enumerators conducted interviews in the local dialect, ensuring that farmers understood the questions. A “screening choice set” with insurance premiums of 600 yuan ha-1, 675 yuan ha-1, and 750 yuan ha-1 was presented, with survey progression contingent on selecting 600 or 675 yuan ha-1. Deviations from these choices resulted in survey termination.
In the second stage, stratified random sampling refined the sample for the full choice experiment. A pre-survey screening identified key insurance attributes (e.g., claims starting point, premiums, indemnity), assessed the farmers’ understanding, and tailored choice scenarios to real-world conditions. That pre-survey included the following participation criteria: 1) Participants must be farmers who have cultivated tea crops; 2) They should possess some insurance experience or relevant background knowledge; and 3) They must volunteer to participate in the study and provide honest feedback during the survey. This process yielded a valid sample of 323 farmers, with a 97.88% questionnaire effectiveness rate. Incomplete or inconsistent responses were excluded to ensure reliability and representativeness.

5 Results

5.1 Descriptive statistics

This study included 323 tea farmers. The demographic analysis is detailed in Table 3 and reflects typical characteristics of Chinese rural farm households, such as limited education and an aging population. The gender distribution aligns well with the Anhui Provincial Census, primarily comprising individuals aged 16 to 59 years with an average education level of 4.4 years. These farmers reported an average household income of 73970 yuan (approximately 10969 USD), and a significant number have experienced agricultural disasters, underscoring their reliance on experiential knowledge for tea cultivation. Our sample closely mirrors the gender demographics of the region, as per the Anhui Statistical Yearbook (2022), but shows a higher age level, slightly lower education, and higher average income compared to the broader population. These differences are analyzed further in relation to their impact on insurance decision making.
Table 3 Demographic characteristics of sample farmers
Variable Indicator Definition Proportion/Mean S.E. Min Max
Sample Census
Social
demographic
characteristics
Gender 1=Male
0=Female
52.60%
47.40%
51.06%
48.94%
0.633 0 1
Age 16-44 years old 12.38% 36.60%
45-59 years old 42.72% 26.01%
Above 60 years old 44.90% 18.60%
Education level Actual years of education of the farmers (yr) 4.406 9.350 3.887 0 16
Total family income Real total household income of farmers (yuan) 73970 29950 47019 4000 230000
Family business characteristics Experienced natural disasters 1=Yes; 0=No 0.969 - 0.190 0 1
Heard of tea insurance publicity 1=Yes; 0=No 0.743 - 0.437 0 1
Participation in farmer organizations 1=Yes; 0=No 0.105 - 0.307 0 1

Note: (a) Census data were obtained from the 2022 Anhui Statistical Yearbook (http://tjj.ah.gov.cn/oldfiles/tjj/tjjweb/tjnj/2022/index.htm); (b) Survey result bins were merged for comparison with the census bins; (c) Respondents under the age of 15 were not included in the sample farmers.

A significant 96.9% of the farmers in the study sample suffered from agricultural disasters which severely impact organic tea crops, including frost, drought, heavy rainfall, flooding, and pests. These high rates might be linked to climate change, which intensifies extreme weather events, and organic farming practices that prohibit chemical pesticides, increasing their vulnerability to pests. Despite the high incidence of agricultural disasters, tea insurance uptake remains low in this area. As smallholders with limited education, many farmers struggle to understand insurance products (Liu et al., 2016), leading to cautious attitudes and low participation. High insurance costs in disaster-prone areas and the complexity of claims processes (e.g., reporting and claiming damages) further deter enrollment (Hill et al., 2013).

5.2 Estimation results

The estimations for this study were conducted using Nlogit 5 and Stata 16 statistical software. The estimated multinomial logit model yielded a pseudo-R2 of 0.097, the random parameter logit model pseudo-R2 was 0.377, and the latent class model pseudo-R2 was 0.408. According to Hensher and Johnson (2018), models within this range are indicative of a sufficiently close fit with the data.

5.2.1 Tea farmers’ perception of the insurance scheme

Table 4 illustrates the estimation results of the MNL and RPL models. Significant P-values for the coefficients indicate willingness-to-pay (WTP), while significant P-values for standard deviations reveal preference heterogeneity (Ureta et al., 2022). Negative alternative-specific constant coefficients at the 1% level suggest farmers prefer organic tea insurance over the status quo, which is driven by frequent disasters that threaten yields and cause economic distress.
Table 4 Estimation results of random parameter logit
Variable MNL model RPL model
Coefficient Std. error Coefficient Std. error
Mean
Claim starting point -3.353*** 0.710 -4.027*** 0.933
Indemnity 0.001*** 0.000 0.001*** 0.000
Claim payment time -0.056*** 0.007 -0.063*** 0.007
Government subsidy ratio -2.046** 0.939 -2.623** 1.107
Total premium -0.046*** 0.014 -0.048*** 0.015
ASC -1.512*** 0.294 -1.619*** 0.322
Standard deviations
Claim starting point 6.886** 2.821
Number of observations 3876 3876
Log-likelihood -882.504 -881.453
Adj-R2 0.097 0.377
AIC 1777.0 1776.9

Note: Levels of significance: * means 10%; ** means 5%; *** means 1%.

The estimated coefficients of all the included insurance attributes are significantly impactful on farmers’ WTP. A higher indemnity increases WTP, as farmers prefer greater compensation (Feng et al., 2020). Conversely, shorter claim payment times and lower claim starting points enhance WTP by reducing financial strain and increasing compensation rates. Interestingly, a lower government subsidy ratio increases WTP, possibly due to skepticism about subsidy efficiency and regional disparities in subsidy policies. For low-income farmers, high premiums and inefficient subsidies reduce demand (Goodwin and Smith, 2013). Current subsidy policies that are reliant on government funding limit risk diversification and suffer from delays and inadequate oversight, further undermining interest in insurance.
Overall, the analysis suggests a consistent trend among farmers to invest in additional organic tea insurance schemes, with both insurance attributes and the government subsidy ratio significantly affecting WTP.

5.2.2 Latent class results

Considerable variations in the standard deviations of coefficients in our models indicate diverse perceptions of the insurance scheme’s attributes among participants. This diversity prompted us to estimate the LCM to discern distinct groups of farmers based on their perceptions. The selection of a two-class LCM was justified by the Bayesian Information Criterion (BIC) values, which suggested an optimal balance between model complexity and interpretability, an improved log-likelihood, and a manageable class size for our sample (Table 5).
Table 5 Criteria for selecting the optimal number of classes in the latent class model
Number of classes Log-likelihood Number of
parameters
AIC BIC
2 -835.131 14 1698.3 1770.6
3 -817.713 23 1682.3 1800.2
4 -811.416 32 1688.5 1852.1
5 -803.813 41 1689.6 1901.3
6 -805.807 50 1711.6 1969.8
Table 6 features the results of this refined model, which delineate two distinct farmer classes. Members of Class 1, comprising 78.5% of the sample, evaluate multiple factors including the claim starting point, claim payment time, indemnity amounts, government subsidy ratios, and overall costs. Members of Class 2, making up 21.5% of the participants, primarily focus on the cost aspect alone.
Table 6 Estimation results of the latent class model
Variable Latent class model
Class 1
(Attributes preference type)
Class 2
(Price-sensitive type)
Class share (Hns) a 78.5% 21.5%
Predicted probability
per class ( P n i | s) b
64.8% 71.9%
Coefficient Std. error Coefficient Std.
error
Attributes of the insurance
scheme
Claim starting point -18.6053*** 3.6116 2.6441 2.8807
Indemnity 0.0044*** 0.0006 0.0005** 0.0002
Claim payment time -0.0796*** 0.0147 0.0091 0.0426
Government subsidy ratio -8.5776** 3.5359 0.5247 4.3166
Total premium -0.1496*** 0.0258 -0.2662*** 0.0723
Respondent-specific
covariates
Natural disasters 1.5750*** 0.6048 0.0000 0.0000
Tea insurance publicity 1.2910*** 0.2803 0.0000 0.0000
Farmer organization 0.8923 0.6284 0.0000 0.0000
Constant -1.1445* 0.6048 0.0000 0.0000
Number of observations 3876
Log likelihood -835.131
Adj-R2 0.408
AIC 1698.3
BIC 1770.6
LR Chi2 1168.552***

Note: Levels of significance: * indicates 10%; ** indicates 5%; *** indicates 1%. a. The class membership probabilities (or class shares) were calculated with Nlogit5 and represent the posterior probability that a participant is in a certain class. This probability depends on the respondent-specific covariates. b. The class-specific choice probability was calculated with Nlogit5 and represents the predicted probability of scheme participation conditional on being in a certain class.

This two-class LCM facilitates a nuanced understanding of the farmers’ decision-making processes, and reveals that while a majority consider a range of attributes when choosing insurance products, a significant minority prioritize cost above all other factors. This distinction is crucial for designing targeted insurance policies that cater to the diverse needs and priorities within the farming community.
The results from the latent class model largely corroborate the predictions made by the multinomial logit and random parameter logit models, but they also reveal the existence of two distinct types of farmers based on their preferences for insurance attributes and individual experience characteristics.
Class 1: Farmers-attributes and experience focused (64.8% probability). The first type of farmer aligns closely with the outcomes obtained from the MNL and RPL models, exhibiting a moderate overall preference for tea insurance. However, the farmers in this group show a particularly strong inclination towards certain insurance attributes, notably the claim starting point and the government subsidy ratio. These preferences suggest that farmers in this category, especially those with disaster and training experience, place significant importance on the conditions under which they become eligible for compensation (claim starting point) and the extent of governmental financial support (government subsidy ratio).
Class 2: Farmers-money-sensitive and price-oriented (71.9% probability). Farmers in this group exhibit exceptional interest in higher indemnity amounts and lower premiums, with insurance functional attributes appearing less important. The high significance of the coefficient for the premium attribute implies extreme sensitivity of these tea farmers to insurance costs, and higher insurance costs reduce the likelihood of farmers insuring their tea gardens, possibly due to their financial status. Furthermore, while the coefficient of indemnity is relatively small, its high significance suggests these farmers seek higher compensation to cover the materialized costs and potential losses.
Covariate Integration in LCM. The inclusion of three key covariates—risk experience, training experience, and participation in farmer organizations-in the LCM aimed to deepen our understanding of the sampled tea growers’ classification traits. These covariates are prominently featured and representative within our sample. Within the framework of the LCM, experiences related to natural disasters and awareness of tea insurance promotions emerged as positive and significant variables. This indicates that farmers’ personal experiences with disasters and their familiarity with insurance schemes significantly influence their perceptions and preferences for insurance. On the other hand, participation in farmer organizations does not exhibit statistical significance. This lack of significance could imply that involvement in these organizations may not have a direct or discernible impact on farmers’ decisions regarding tea insurance.
Thus, the LCM analysis not only validates the initial model predictions but also provides nuanced insights into the diverse attitudes and preferences among farmers regarding tea insurance. It highlights the complexity of decision-making processes in agricultural insurance, which are influenced by a blend of personal experiences, risk perceptions, and knowledge of the existing insurance schemes.

5.2.3 Latent class characteristics

Within the defined classification groups, the first group is characterized by a higher household income, a frequent incidence of natural disasters, extensive exposure to tea insurance training, and active participation in cooperative operations. Notably, variables such as gender, age, education level, and cooperative participation contribute only marginally, accounting for less than 10% of the variance. These farmers, who are typically older with lower education but higher income, value all insurance attributes. Disaster experiences, cooperative engagement, and reduced information asymmetry enhance their awareness of insurance features, although frequent disasters may pose a moral hazard. Current training programs moderately improve their sensitivity to compensation but lack sufficient comprehensiveness.
In contrast, the second category of farmers displays a singular focus on the compensation aspect of the insurance product, reflecting the priorities of the average farmer. This group’s perspective underscores the need for insurance policies that directly address the primary concerns of the general farming population.
A descriptive statistical analysis reveals that high proportions of tea growers in the first category (Table 7) have encountered natural disasters (98.5%) and are aware of tea insurance promotions (80.8%). However, only a small fraction (11.5%) has engaged in farmer organizations. Therefore, disaster experiences and insurance promotion significantly influence their behavior, with loss aversion and external knowledge increasing their likelihood of purchasing insurance. In contrast, participation in farmer organizations has a positive but statistically insignificant impact due to low engagement and limited understanding of their roles.
Table 7 Characteristics of respondents in the Latent class model
Variable Variable description Class 1
(%)
Class 2 (%)
Gender Male 63.54 53.09
Female 36.46 46.91
Age (yr) Youth (16-44) 11.15 20.99
Middle-aged (45-59) 51.33 43.21
Old-aged (≥60) 37.52 35.80
Education
(yr)
Primary education (≤9) 95.75 92.59
Secondary education (9-12) 2.92 4.32
Advanced education (>12) 1.33 3.09
Total annual family
income (yuan)
Low income (≤24000) 15.40 18.52
Middle income (24000-60000) 25.75 40.12
High income (≥60000) 58.85 41.36
Natural disasters Yes 98.50 83.33
No 1.50 16.67
Tea insurance publicity Yes 80.80 29.01
No 19.20 70.99
Farmer organizations Yes 11.50 3.70
No 88.50 96.30

Note: Average exchange rate from June to August 2022 was 1 yuan=0.148 USD).

5.3 Willingness-to-pay analysis

Table 8 shows the trade-offs and monetary values tea growers assign to the various agricultural insurance attributes across three models, which are derived from the utility function parameters. The RPL model, which accounts for farmer heterogeneity, aligns closely with the MNL model in attribute rankings. The farmers’ preferences are ranked as: claim starting point>government subsidy ratio>claim payment time>total indemnity.
Table 8 Estimates of willingness-to-pay for the individual attributes of organic tea insurance
Attribute MNL model RPL model Latent class model
Class 1 Class 2
Mean (95% CI) Mean (95% CI) Mean (95% CI) Mean (95% CI)
Claim starting point -1093.37
(-1547.31, -639.62)
-1258.44
(-1823.10, -684.69)
-1869.35***
(-2468.18, -1263.68)
148.98
(-142.08, 29.34)
Total indemnity 0.33
(0.32,0.45)
0.32
(0.32,0.45)
0.45***
(0.33, 0.56)
0.03*
(0.00, 0.06)
Claim payment time -18.26
(-23.64, -14.64)
-19.70
(-19.635, -14.775)
-7.98***
(-11.895, -4.080)
0.51
(-0.27, 0.33)
Government subsidy ratio -667.17
(-1267.59, -66.86)
-819.69
(-817.28, -141.35)
-860.25***
(-1459.95, -260.54)
29.57
(-451.65, 510.78)

Note: Levels of significance: * indicates 10%; ** indicates 5%; *** indicates 1%. Values are expressed in yuan ha-1 with mean WTP estimates. The average exchange rate from June to August 2022 was 1 yuan=0.148 USD.

The most significant attribute is the claim starting point, with farmers willing to pay 1258.44 yuan ha-1 per level change, reflecting its critical role in compensation eligibility. The MNL and RPL models show a difference of approximately 165.08 yuan ha-1. The government subsidy ratio follows, with a WTP of 819.69 yuan ha-1, indicating a preference for lower subsidy proportions due to inefficiencies and delays, and it deviates from the MNL model by almost 152.52 yuan ha-1. Claim payment time has a smaller impact (19.70 yuan ha-1), with faster settlements preferred under situations of financial strain and distrust. Total indemnity has the least influence (0.32 yuan ha-1), as full compensation is rare and discrepancies between expected and actual payouts reduce its importance.
The WTP analysis from the MNL and RPL models shows high consistency, indicating minimal heterogeneity among farmers. However, the latent class model elucidates a bifurcation in preferences between two distinct cohorts. The first cohort values indemnity highly but negatively views other attributes, while the second cohort favors all attributes, with indemnity being the most significant. This delineation implies that the farmers within the first cohort are predisposed to allocate a higher financial commitment to certain modified attributes of the agricultural insurance product, as evidenced by the positive estimations. Conversely, the negative estimations indicate the monetary values these farmers are prepared to expend to avoid alterations to the product.
The estimates show that among the insurance product types, class one members were willing to offer 1869.35 yuan ha-1 for the claim starting point in order to maintain or avoid a decline in the status quo level of organic tea insurance products. The same class one members were ready to contribute 7.98 yuan ha-1 and 860.25 yuan ha-1 to insure their tea garden with an efficient claim payment time and government subsidy ratio, respectively. In terms of loss indemnity, class one members were ready to offer a negligible but positive amount of 0.45 yuan ha-1 to avert untimely and inadequate compensation.
Members of class two, on the other hand, were only willing to offer payment for indemnity. The estimates clearly show that members of class two were ready to contribute a paltry 0.03 yuan ha-1 in the indemnity attribute to avoid perpetuating the status quo. Like the members of the first class, those in the second class prominently valued the cost-related attributes, preferring compensation tied to incurred losses, although they exhibited a relatively lower actual willingness to pay. Regarding other insurance attributes, the members in the second class expressed positive evaluations, although no statistically significant preferences could be discerned.

5.4 Robustness test

5.4.1 Attribute non-attendance

Existing studies show that respondents often use information-processing strategies like attribute non-attendance (ANA) to reduce the cognitive burden when making choices (Bello and Abdulai, 2016; Quan et al., 2018). ANA occurs when respondents disregard certain attributes in decision-making, potentially violating the preference continuity and biasing results (Colombo et al., 2013).
To test the robustness of the basic model's results, this study excluded certain samples based on post-survey questions asking farmers whether they ignored specific attributes. Among 31 farmers who reported ANA, two ignored two attributes, and 29 ignored one. The most neglected attributes were claim payment time (18 respondents) and claim starting point (10 respondents), with only one respondent disregarding the total premium(Figure 2).
Figure 2 Numbers of farmers ignoring individual attributes and combinations of attributes
This distribution highlights a prioritization hierarchy, with claim payment time and starting point being less critical, while the total premium was almost universally considered. The relative insignificance of these attributes could be indicative of their perceived lower impacts on the overall utility derived from the insurance product. These findings emphasize the dominant role of cost considerations in farmers' insurance decisions, and provide valuable insights for tailoring insurance products to align with their preferences.

5.4.2 Robustness results

Excluding farmers who ignored at least one attribute, we re-ran the regression analysis using the RPL model. The results in Table 9 show that farmers’ preferences for organic tea insurance attributes remained highly consistent with the RPL model, confirming the model’s robustness.
Table 9 Estimation results of stated attribute non-attendance
Variable Coefficient Std. error Z-value
Mean
Claim starting point -4.695*** 1.042 -4.50
Indemnity 0.001*** 0.000 9.08
Claim payment time -0.065*** 0.009 -7.57
Government subsidy ratio -3.114** 1.257 -2.48
Total premium -0.054*** 0.017 -3.19
ASC -1.715*** 0.366 -4.69
Standard deviations
Claim starting point 9.320*** 2.712 3.44
Number of observations 3504
Log-likelihood -1283.18
Adj-R2 0.393
AIC 1573.1
LR Chi2 1007.22***

Note: Levels of significance: * indicates 10%; ** indicates 5%; *** indicates 1%.

6 Discussion

6.1 Heterogeneous effects of farmers’ willingness to insure

Agricultural insurance is crucial for mitigating the economic losses in agriculture caused by extreme weather and other uncertainties. Farmers’ preferences for such insurance are influenced by their risk attitudes, information asymmetry, and product attributes. To understand these preferences, we assessed farmers’ WTP for organic tea insurance using a choice experiment approach and a latent class model. This allowed us to identify the key factors affecting their decisions and to quantify their WTP for specific insurance attributes.
Our findings revealed a general preference among farmers for additional organic tea insurance, as evidenced by a statistically significant negative ASC. This aligns with previous research suggesting that farmers enroll in agricultural insurance to manage risks and minimize losses, with their preferences influenced by the specific attributes and levels of the insurance products (Liesivaara and Myyrä, 2014).
The latent class model enabled a detailed analysis of farmer heterogeneity by incorporating factors like disaster experience, training, and participation in farmer organizations. This approach revealed that preferences for organic tea insurance are shaped not only by socio-economic factors but also by personal experiences, thus providing insights into how these factors influence insurance attribute selection (Weber and Milliman, 1997).
We identified two distinct groups based on their insurance preferences, which we can call advocates and cautious farmers.
Advocates (78.5% of the sample) show a preference for key insurance attributes, such as shorter claim payment times and more accessible claim starting points. They also show a negative preference for maintaining the status quo, indicating strong support for proactive insurance adoption.
Cautious (21.5% of the sample) farmers are price-sensitive, and show significant preferences for lower premiums despite valuing other insurance-related attributes and government subsidies.
The diverse preferences highlighted by the latent class model underscore the impracticality of a one-size-fits-all approach, emphasizing the need for tailored insurance schemes to address the diverse needs of different farmers. Farmers with low-temperature frost disaster experience and insurance knowledge are key targets for customized plans. Some farmers prefer higher coverage limits, as the current level of 15000 yuan ha-1 often serves only as a basic safety net. This indicates the need to reassess and potentially increase coverage to better reflect the tea farmers’ actual risks and costs. These findings offer valuable guidance for designing effective agricultural insurance products, particularly for organic and economically vital crops like tea.

6.2 Experience factors of farmers’ willingness to insure

Our study identified three key types of social experiences that significantly influence farmers’ decisions regarding organic tea insurance: disaster experience, training related to insurance, and participation in agricultural cooperatives. The empirical results show that disaster and relevant training experiences strongly impact preferences for insurance, and enhance the likelihood of adoption among those with these experiences. Conversely, King and Singh (2020) emphasized that trust in insurance companies significantly boosts demand for insurance, which aligns with our findings that advocates of organic tea insurance tend to trust these institutions more.
Furthermore, Liu et al. (2016) and Hill et al. (2013) highlighted that a lack of understanding about basic risks and insurance components discourages farmers from purchasing insurance. Mensah et al. (2023) suggested that insufficient knowledge about risks over time reduces the willingness to insure. This misalignment between farmers’ subjective knowledge and the objective aspects of insurance negatively influences their insurance preferences. In addition, Mahul and Stutley (2010) noted that unrealistic expectations about insurance claims can lead to moral hazards, where insured individuals take greater risks due to the perceived safety net insurance provides.
Interestingly, membership in farmer organizations tends to correlate with a higher preference for insurance, possibly due to the shared knowledge and risk mitigation strategies within these groups. Coydon and Molitor (2011) supported this, noting that community organization membership can foster micro-insurance adoption.

6.3 Limitations and future work

This study focuses predominantly on the demand side, i.e., farmers’ preferences and willingness to pay, but it does not further explore the supply side, which includes the utility and feasibility from the insurers’ perspective as well as potential planning costs. The simplistic nature of the insurance product used in this study, comprising only five attributes, may not capture the complexity of real-world insurance products that can have numerous attributes (Staples et al., 2020).
A notable methodological limitation is the potential for hypothetical bias, where responses in a hypothetical scenario may not accurately predict real-world behaviors (Milad et al., 2021). However, the controlled experimental setup provides reliable insights into the farmers’ decision-making process. We adopted several strategies to mitigate hypothetical bias. We used randomized questionnaire versions to reduce systematic bias (Hensher et al., 2015), and real market information and existing product references to enhance external validity (Louviere et al., 2000). We also included five attributes—economic and non-economic—to capture diverse preferences, and post-experiment interviews to understand the farmers’ decision-making process and identify potential biases. These four measures improved the robustness of the findings.

7 Conclusions and policy implications

In this study, we analyzed the latent preferences of farmers for different levels of attributes in organic tea insurance and measured the WTP values for those attributes. Furthermore, we categorized the sample farmers based on various characteristics and examined the impacts of experiences such as disasters, training, and participation in cooperative organizations on farmers’ decisions to insure organic tea. We also analyzed the group regression of farmers’ knowledge of government subsidies. The robustness of the results was validated through regression on ANA.
The following key conclusions can be drawn from this study. First, the sampled farmers exhibit strong preferences and WTP for organic tea insurance. Second, farmers' insurance preferences are heterogeneous, with disaster and training experiences boosting insurance adoption, but cooperative participation has a limited impact. Third, among insurance attributes, farmers prioritize the claim starting point> government subsidy ratio>claim payment time>total indemnity. Fourth, using a random parameter logit model, WTP varies significantly with changes in the claim starting point (1258.44 yuan ha-1) and government subsidy ratio (819.69 yuan ha-1), while claim payment time (19.70 yuan ha-1) and total indemnity (0.32 yuan ha-1) have minimal effects. Fifth, applying latent class modeling, we categorized farmers into “attribute-preference” and “price-sensitive” groups. Finally, robustness checks indicated that the conclusions remain valid even when using the ANA group regression method.
The results of this study emphasize that tailored crop insurance, combined with education on basic risks and organic tea insurance, can drive adoption in developing economies. Setting scientifically justified claim starting points and implementing diverse subsidies, training, and awareness campaigns are the keys to boosting participation. Policymakers are advised to consider farmers’ preferences, especially for organic and economic crops, while insurers are urged to customize products to meet diverse needs. In rural areas, assessing farmers’ preferences for risks, claims, timelines, and costs is essential for effectively expanding crop insurance adoption and managing agricultural risks. These insights offer valuable guidance for managing agricultural risks in developing economies.
[1]
Akter S, Krupnik T J, Khanam F. 2017. Climate change skepticism and index versus standard crop insurance demand in coastal Bangladesh. Regional Environmental Change, 17: 2455-2466.

[2]
Ali W, Abdulai A, Goetz R, et al. 2021. Risk, ambiguity and willingness to participate in crop insurance programs: Evidence from a field experiment. Australian Journal of Agricultural and Resource Economics, 65: 679-703.

[3]
Becchetti L, Castriota S, Conzo P. 2017. Disaster, aid, and preferences: The long-run impact of the tsunami on giving in Sri Lanka. World Development, 94: 157-173.

[4]
Bello M, Abdulai A. 2016. Impact of Ex-Ante hypothetical bias mitigation methods on attribute non-attendance in choice experiments. American Journal of Agricultural Economics, 98(5): 1486-1506.

[5]
Camerer C F, Fehr E. 2006. When does “economic man” dominate social behavior? Science, 311(5757): 47-52.

[6]
Capraro V, Cococcioni G. 2015. Social setting, intuition and experience in laboratory experiments interact to shape cooperative decision-making. Proceedings of the Royal Society B: Biological Sciences, 282(1811): 20150237. DOI: 10.1098/rspb.2015.0237.

[7]
Carlsson F, Kataria M, Lampi E. 2010. Dealing with ignored attributes in choice experiments on valuation of Sweden’s environmental quality objectives. Environmental and Resource Economics, 47: 65-89.

[8]
Chambers R G. 1989. Insurability and moral hazard in agricultural insurance markets. American Journal of Agricultural Economics, 71(3): 604-616.

[9]
Chantarat S, Mude A G, Barrett C B, et al. 2013. Designing index-based livestock insurance for managing asset risk in northern Kenya. Journal of Risk and Insurance, 80: 205-237.

[10]
CISF (China Insurance Security Fund Co., LTD). 2022. Regulatory voice: Research on risk characteristics and insurance models of Anhui tea industry (Issue 5, 2022). http://www.cisf.cn/fxgc/zdtj/3602.jsp. (in Chinese)

[11]
Clarkson G, Jacobsen T E, Batcheller A L. 2007. Information asymmetry and information sharing. Government Information Quarterly, 24(4): 827-839.

[12]
Cohen A N, Fischhendler I. 2022. An archetype for insurance thresholds for extreme natural events in the agricultural sector. Climate Risk Management, 36: 100434. DOI: 10.1016/j.crm.2022.100434.

[13]
Cohen J L, Dickens W T. 2002. A foundation for behavioral economics. American Economic Review, 92(2): 335-338.

[14]
Colombo S, Christie M, Hanley N. 2013. What are the consequences of ignoring attributes in choice experiments? Implications for ecosystem service valuation. Ecological Economics, 96: 25-35.

[15]
Coydon M, Molitor V. 2011. Commercial insurers in microinsurance. Luxembourg, Luxembourg: Microinsurance Network.

[16]
Doherty E, Mellett S, Norton D, et al. 2021. A discrete choice experiment exploring farmer preferences for insurance against extreme weather events. Journal of Environmental Management, 290: 112607. DOI: 10.1016/j.jenvman.2021.112607.

[17]
Du X, Feng H, Hennessy D A. 2017. Rationality of choices in subsidized crop insurance markets. American Journal of Agricultural Economics, 99: 732-756.

[18]
Einav L. 2005. Informational asymmetries and observational learning in search. Journal of Risk and Uncertainty, 30: 241-259.

[19]
FAO (Food and Agriculture Organization of the United Nations). 2019. China—Tea Production Metric Tons: 1961 to 2019. https://www.nationmaster.com/nmx/timeseries/china-tea-production.

[20]
Feng H, Du X, Hennessy D A. 2020. Depressed demand for crop insurance contracts, and a rationale based on third generation prospect theory. Agricultural Economics, 51: 59-73.

[21]
Fishburn P C, Kochenberger G A. 1979. Two-price von Neumann-Morgenstern Utility functions. Decision Sciences, 10(4): 503-518.

[22]
GATS (Global Agricultural Trade System). 2023. United States Department of Foreign Agricultural Service. January Tea Report: 2023 China Exports& US Imports. https://blog.firsdtea.com/posts/january-te-a-report-2023-china-exports-us-imports.

[23]
Ghimire Y N, Timsina K P, Gauchan D. 2016. Risk management in agriculture: Global experiences and lessons for Nepal. Government of Nepal. Lalitpur, Nepal: Socioeconomics and Agricultural Policy Research Division, Nepal Agricultural Research Council (NARC).

[24]
Glenk K, Martin-Ortega J, Pulido-Velazquez M, et al. 2015. Inferring attribute non-attendance from discrete choice experiments: Implications for benefit transfer. Environmental and Resource Economics, 60: 497- 520.

[25]
Gonçalves T, Lourenço-Gomes L, Pinto L M C. 2022. The role of attribute non-attendance on consumer decision-making: Theoretical insights and empirical evidence. Economic Analysis and Policy, 76: 788-805.

[26]
Goodwin B K, Smith V H. 2013. What harm is done by subsidizing crop insurance? American Journal of Agricultural Economics, 95: 489-497.

[27]
Grammatikopoulou I, Pouta E, Artell J. 2019. Heterogeneity and attribute non-attendance in preferences for peatland conservation. Forest Policy and Economics, 104: 45-55.

DOI

[28]
Hanemann W M. 1984. Welfare evaluations in contingent valuation experiments with discrete responses. American Journal of Agricultural Economics, 66(3): 332-341.

[29]
Heidenreich S, Watson V, Ryan M, et al. 2018. Decision heuristic or preference? Attribute non-attendance in discrete choice problems. Health Economics, 27: 157-171.

DOI PMID

[30]
Hensher D A, Johnson L W. 2018. Applied discrete-choice modelling. London, UK: Routledge.

[31]
Hensher D A, Rose J M, Greene W H. 2015. Applied choice analysis. Cambridge, UK: Cambridge University Press.

[32]
Hill R V, Hoddinott J, Kumar N. 2013. Adoption of weather-index insurance: Learning from willingness to pay among a panel of households in rural Ethiopia. Agricultural Economics, 44(4-5): 385-398.

[33]
Izquierdo S S, Izquierdo L R. 2007. The impact of quality uncertainty without asymmetric information on market efficiency. Journal of Business Research, 60(8): 858-867.

[34]
Jin J, Wang W, Wang X. 2016. Farmers’ risk preferences and agricultural weather index insurance uptake in rural China. International Journal of Disaster Risk Science, 7: 366-373.

[35]
Johnson L, Wandera B, Jensen N, et al. 2019. Competing expectations in an index-based livestock insurance project. The Journal of Development Studies, 55: 1221-1239.

[36]
King M, Singh A P. 2020. Understanding farmers’ valuation of agricultural insurance: Evidence from Vietnam. Food Policy, 94: 101861. DOI: 10.1016/j.foodpol.2020.101861.

[37]
Lancaster K J, Tsushima T. 1966. A new approach to consumer theory. Journal of Political Economy, 74(2): 132-157.

[38]
Liesivaara P, Myyrä S. 2014. Willingness to pay for agricultural crop insurance in the northern EU. Agricultural Finance Review, 74: 539-554.

[39]
Lin N. 2002. Social capital:A theory of social structure and action (Vol. 19). Cambridge, UK: Cambridge University Press.

[40]
Liu F, Corcoran C P, Tao J, et al. 2016. Risk perception, insurance recognition and agricultural insurance behavior—An empirical based on dynamic panel data in 31 provinces of China. International Journal of Disaster Risk Reduction, 20: 19-25.

[41]
Louviere J J. 2000. Stated choice methods:Analysis and applications. Cambridge, UK: Cambridge University Press.

[42]
Lubell M, Scholz J T. 2001. Cooperation, reciprocity, and the collective-action heuristic. American Journal of Political Science, 45(1): 160-178.

[43]
Mahul O, Stutley C J. 2010. Government support to agricultural insurance: Challenges and options for developing countries. Chicago, USA: World Bank Publications.

[44]
Marshall J M. 1976. Moral hazard. The American Economic Review, 66(5): 880-890.

[45]
McFadden D. 1980. Econometric models for probabilistic choice among products. The Journal of Business, (3): 13-29.

[46]
McFadden D. 2014. The new science of pleasure:Consumer choice behaviour and the measurement of well-being. In: Handbook of choice modelling. Cheltenham, UK: Edward Elgar Publishing: 7-48.

[47]
Mensah N O, Owusu-Sekyere E, Adjei C. 2023. Revisiting preferences for agricultural insurance policies: Insights from cashew crop insurance development in Ghana. Food Policy, 118: 102496. DOI: 10.1016/j.foodpol.2023.102496.

[48]
MFPRC (Ministry of Finance of the People’s Republic of China). 2022. The Yunnan Provincial Department of Finance is located in Yuxi, Baoshan, and Pu’er launch pilot program for green and organic agricultural product income insurance. www.mof.gov.cn/zhengwuxinxi/xinwenlianbo/yunnancaizhengxinxilianbo/202112/t20211227_3778461.htm. (in Chinese)

[49]
Milad H, Michiel C J B, John M R, et al. 2021. Hypothetical bias in stated choice experiments: Part I. Macro-scale analysis of literature and integrative synthesis of empirical evidence from applied economics, experimental psychology and neuroimaging. Journal of Choice Modelling 41: 100309. DOI: 10.1016/J.JOCM.2021.100309.

[50]
Miranda M J. 1991. Area-yield crop insurance reconsidered. American Journal of Agricultural Economics, 73(2): 233-242.

[51]
Nelson C H, Loehman E T. 1987. Further toward a theory of agricultural insurance. American Journal of Agricultural Economics, 69(3): 523-531.

[52]
Nguyen T C, Robinson J, Whitty J A, et al. 2015. Attribute non-attendance in discrete choice experiments: A case study in a developing country. Economic Analysis and Policy, 47: 22-33.

[53]
Nyaaba J A, Nkrumah-Ennin K, Anang B T. 2019. Willingness to pay for crop insurance in Tolon District of Ghana: Application of an endogenous treatment effect model. AIMS Agriculture and Food, 4(2): 362-375.

[54]
Ostrom E. 2000. Collective action and the evolution of social norms. Journal of Economic Perspectives, 14(3): 137-158.

[55]
PGSC (People’s Government of Shucheng County). 2014. Interpretation of the Construction Plan for Lu’an Tea Valley. www.shucheng.gov.cn/public/content/12227801. (in Chinese)

[56]
Quan S, Zeng Y, Yu X, et al. 2018. WTP for baby milk formula in China: Using attribute nonattendance as a priori information to select attributes in choice experiment. Agribusiness, 34: 300-320.

[57]
Sælensminde K. 2006. Causes and consequences of lexicographic choices in stated choice studies. Ecological Economics, 59(3): 331-340.

[58]
Sandorf E D, Campbell D, Hanley N. 2017. Disentangling the influence of knowledge on attribute non-attendance. Journal of Choice Modelling, 24: 36-50.

[59]
SCPRC (State Council of the People’s Republic of China). 2012. Order of the State Council of the People’s Republic of China (No. 629): Agricultural Insurance Regulations. www.gov.cn/zhengce/content/2012-11/16/content_1760.htm. (in Chinese)

[60]
SCPRC (State Council of the People’s Republic of China). 2016. Opinions of the Central Committee of the Communist Party of China and the State Council on Implementing the New Development Concept, Accelerating Agricultural Modernization Construction, and Achieving the Goal of a Moderately Prosperous Society in All respects. www.gov.cn/zhengce/2016-01/27/content_5036698.htm. (in Chinese)

[61]
Shee A, Turvey C G, Marr A. 2021. Heterogeneous demand and supply for an insurance-linked credit product in Kenya: A stated choice experiment approach. Journal of Agricultural Economics, 72(1): 244-267.

[62]
Skees J R, Reed M R. 1986. Rate making for farm-level crop insurance: Implications for adverse selection. American Journal of Agricultural Economics, 68(3): 653-659.

[63]
Staples A J, Reeling C J, Widmar N J O, et al. 2020. Consumer willingness to pay for sustainability attributes in beer: A choice experiment using eco-labels. Agribusiness, 36: 591-612.

DOI

[64]
Surminski S. 2016. Insurance instruments for climate-resilient development. In:The economics of climate-resilient development. Cheltenham, UK: Edward Elgar Publishing.

[65]
Swait J, Adamowicz W. 2001. Choice environment, market complexity, and consumer behavior: A theoretical and empirical approach for incorporating decision complexity into models of consumer choice. Organizational Behavior and Human Decision Processes, 86(2): 141-167.

[66]
Train K E. 2003. Discrete choice methods with simulation. Cambridge, UK: Cambridge University Press.

[67]
Ureta J C, Motallebi M, Vassalos M, et al. 2022. Estimating residents’ WTP for ecosystem services improvement in a payments for ecosystem services (PES) program: A choice experiment approach. Ecological Economics, 201: 107561. DOI: 10.1016/j.ecolecon.2022.107561.

[68]
Weber E U, Milliman R A. 1997. Perceived risk attitudes: Relating risk perception to risky choice. Management Science, 43(2): 123-144.

[69]
Weller P, Oehlmann M, Mariel P, et al. 2014. Stated and inferred attribute non-attendance in a design of designs approach. Journal of Choice Modelling, 11: 43-56.

[70]
Yu J, Smith A, Sumner D A. 2018. Effects of crop insurance premium subsidies on crop acreage. American Journal of Agricultural Economics, 100: 91-114.

[71]
Yu J, Summer D A, Lee H. 2021. Premium rates and selection in specialty crop insurance markets: Evidence from the catastrophic coverage participation. Food Policy, 101: 102079. DOI: 10.1016/j.foodpol.2021.102079.

Outlines

/