
Journal of Resources and Ecology >
Spatio-temporal Dynamics of Greenhouse Gas Emissions among Four Types of Rice in China
|
ZHANG Bingbin, E-mail: ICE_96@163.com |
Received date: 2025-01-24
Accepted date: 2025-04-15
Online published: 2025-05-28
Supported by
National Natural Science Foundation of China(42001249)
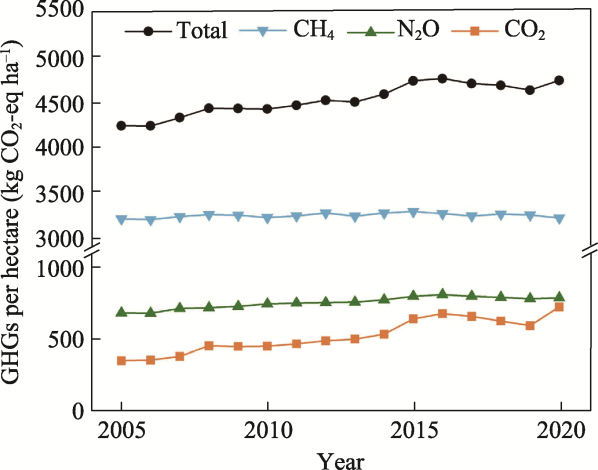
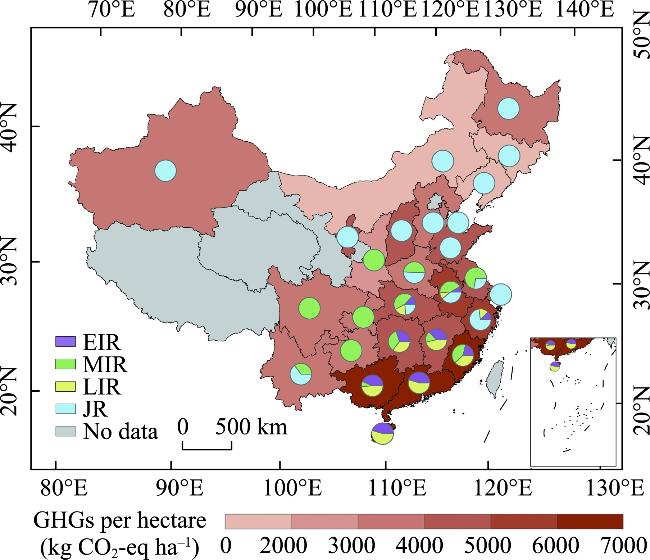
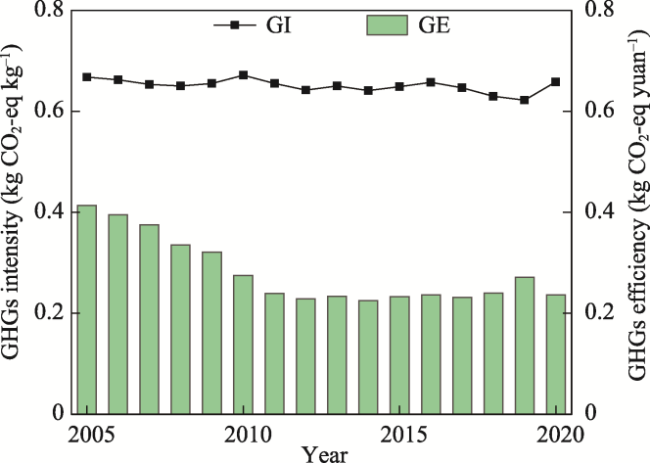
Rice is not only the most basic staple crop, but also a major contributor to greenhouse gas emissions (GHGs). Negative emission options that can guarantee food security are urgently needed. In this study, we analyzed the temporal and spatial dynamics of GHGs from four types of rice in China, namely early indica rice, mid-season indica rice, late indica rice, and japonica rice, and estimated their mitigation potentials. The main results are fourfold. (1) The annual average GHGs per hectare was 4513.5 kg CO2-eq ha-1, increasing gradually from 2005 to 2020, while there was an opposite trend in annual average GHGs efficiency (0.4 kg CO2-eq yuan-1). The GHGs intensity was 0.9 kg CO2-eq kg-1 and remained constant in the same period. (2) The GHGs per unit (sowing area, output or output value) in central and southeastern China were higher than those in the north and west. (3) The GHGs per unit (area, yield or output value) of late indica rice were the highest while the corresponding values for japonica rice were the lowest. (4) The GHGs per hectare might be able to achieve a 20% reduction from the 2020 level, providing that cropland redistribution and mitigation measures are adopted. Finally, we put forward policy proposals and available measures for emission reduction to promote the sustainable development of agricultural systems.
Key words: rice; double-cropping rice; greenhouse gas; mitigation; cropland redistribution
ZHANG Bingbin , YANG Lun . Spatio-temporal Dynamics of Greenhouse Gas Emissions among Four Types of Rice in China[J]. Journal of Resources and Ecology, 2025 , 16(3) : 630 -641 . DOI: 10.5814/j.issn.1674-764x.2025.03.003
Table 1 Accounting system of GHGs from rice cultivation |
| Gas type | Emission source | Indicators |
|---|---|---|
| CO2 | Urea input | (1) Fertilizer application rate |
| (2) Urea content | ||
| Manual labor respiration | Number of rice-farmers | |
| Diesel fuel combustion | Fuel consumption | |
| CH4 | Rice cultivation | (1) Sowing area |
| (2) Growing season length | ||
| (3) Organic amendment | ||
| (4) Water regime | ||
| Enteric fermentation | Number of farm cattle | |
| Diesel fuel combustion | Fuel consumption | |
| N2O | Soil management | (1) Fertilizer application rate |
| (2) Straw inputs | ||
| Diesel fuel combustion | Fuel consumption |
Table 2 Advanced agricultural practices |
| Agricultural input | Adjusted- indicator | Value | Mitigation measures |
|---|---|---|---|
| Irrigation water | SFw | 0.55 | Precision fertilization and water-saving irrigation (Cui et al., 2018) |
| Fertilizer | Application rate | 15% reduction | |
| Diesel fuel | Consumption | 30% reduction | Effective machinery operation and the use of clean energy (Chel and Kaushik, 2011; Xu et al., 2012) |
Figure 1 Total GHGs per hectare of the four types of rice in China from 2005 to 2020 |
Figure 2 Provincial average annual GHGs per hectare from the four types of rice in China from 2005 to 2020Note: The pie charts show the proportions of total emissions of each type of rice. |
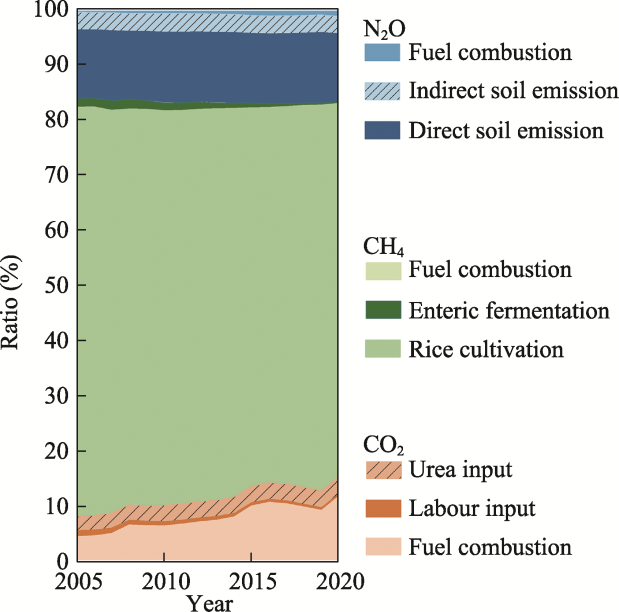
Figure 3 Gas composition of rice GHGs per hectare from 2005 to 2020 |
Figure 4 GHGs intensity (GI) and efficiency (GE) of all four types of rice in China from 2005 to 2020 |
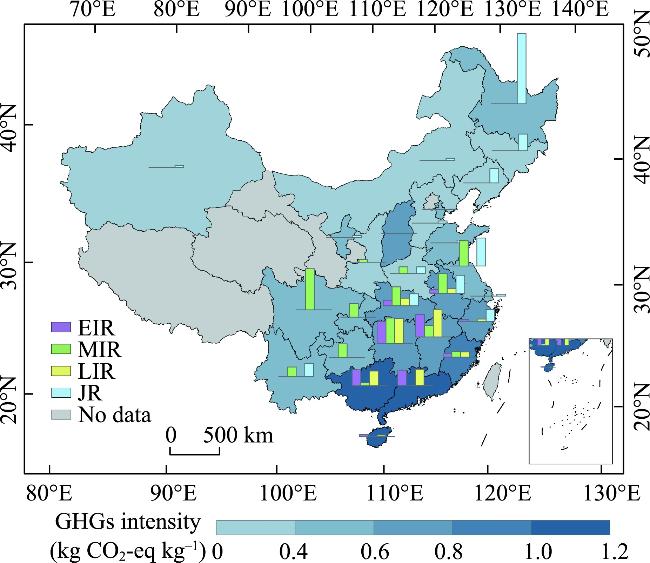
Figure 5 Provincial average annual rice GHGs intensities in China from 2005 to 2020Note: The bar charts show the yields of the four types of rice. |
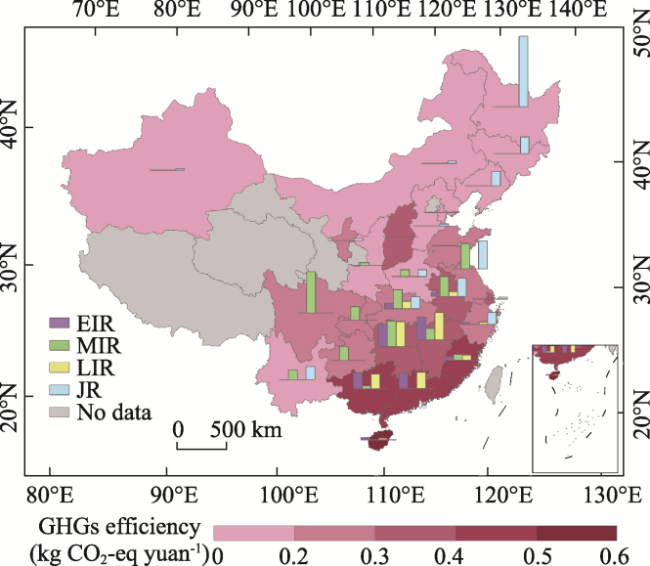
Figure 6 Provincial average annual rice GHGs efficiencies in China from 2005 to 2020Note: The bar charts show the output values of the four types of rice. |
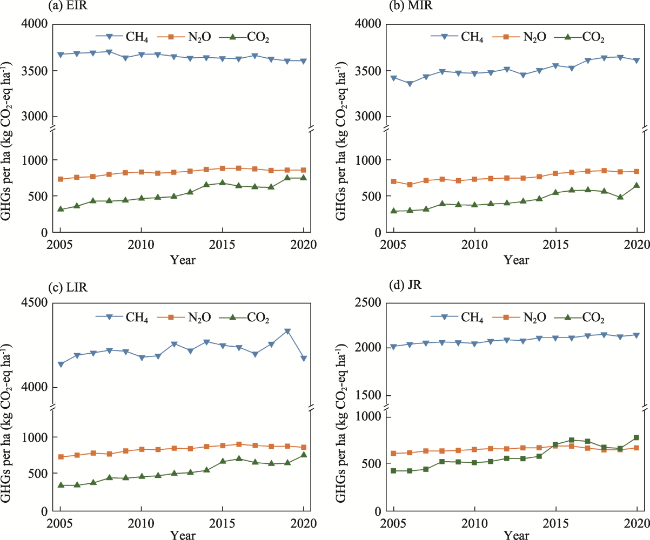
Figure 7 GHGs per hectare among the four types of rice from 2005 to 2020 |
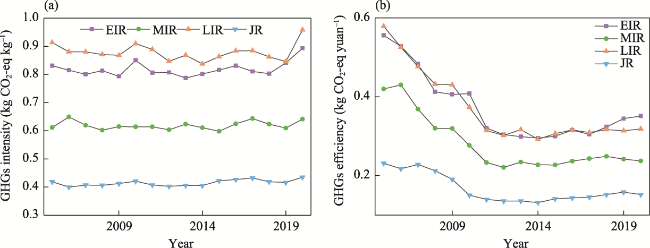
Figure 8 GHGs intensities and efficiencies among the four rice types in China from 2005 to 2020 |
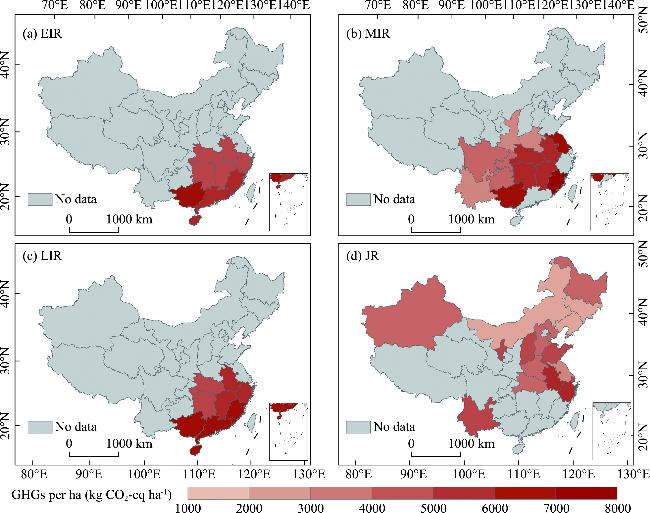
Figure 9 Provincial average annual GHGs per hectare among the four types of rice in China from 2005 to 2020 |
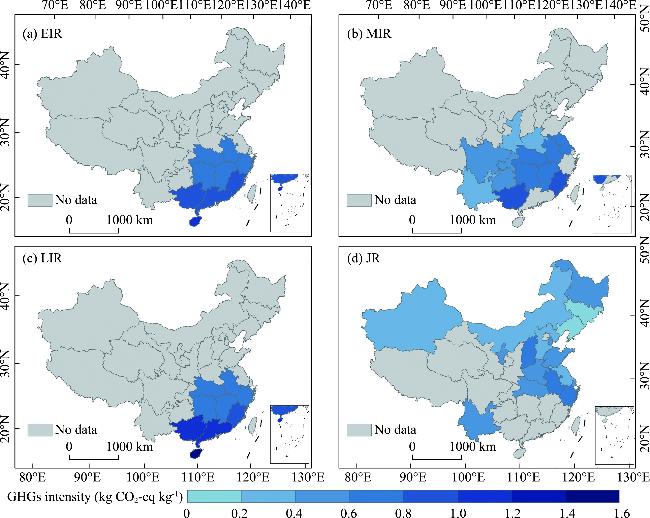
Figure 10 Provincial average annual GHGs intensities among the four types of rice in China from 2005 to 2020 |
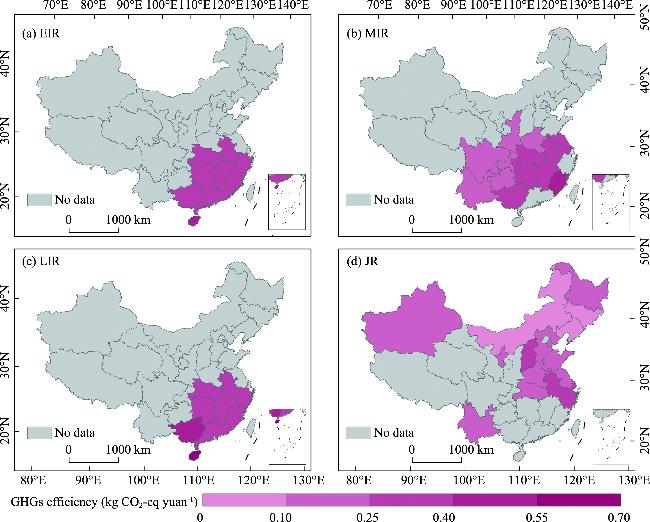
Figure 11 Provincial average annual GHGs efficiencies among the four types of rice in China from 2005 to 2020 |
Table 3 Mitigation potentials after cropland optimization |
| Province | Optimized sowing area (ha) | Variation (ha) | GHGs (Tg) | Reduction rate (%) | ||||||
|---|---|---|---|---|---|---|---|---|---|---|
| EIR | MIR | LIR | JR | EIR | MIR | LIR | JR | |||
| Anhui | 83.7 | 0 | 555.9 | 1872.5 | -86.6 | -1089.8 | 376.7 | 799.7 | 13.7 | 13.6 |
| Hubei | 0 | 1280.9 | 1509.2 | 2998.8 | -122.4 | 1280.9 | -718.1 | 1509.2 | 22.0 | 12.2 |
| Guangdong | 1834.4 | 0 | 0 | 0 | 965.3 | 0 | -965.3 | 0 | 11.4 | 9.1 |
| Hainan | 227.5 | 0 | 0 | 0 | 117.6 | 0 | -117.6 | 0 | 1.4 | 11.3 |
| Henan | 0 | 617.1 | 0 | 0 | 0 | 307.3 | 0 | -307.3 | 2.0 | 8.4 |
| Hunan | 2762.0 | 1231.9 | 0 | 0 | 1536.2 | -244.2 | -1292.0 | 0 | 19.2 | 8.5 |
| Jiangxi | 1939.6 | 1502.2 | 0 | 0 | 722.1 | 556.4 | -1278.5 | 0 | 18.2 | 11.6 |
| Guangxi | 1760.1 | 0 | 0 | 0 | 954.9 | -133.7 | -821.2 | 0 | 11.1 | 9.1 |
| Fujian | 368.6 | 233.1 | 0 | 0 | 270.9 | -25.3 | -245.6 | 0 | 4.1 | 11.6 |
| Zhejiang | 126.0 | 0 | 0 | 510.0 | 24.8 | 0 | -89.6 | 64.8 | 3.7 | 3.7 |
| Total | 9101.9 | 4865.2 | 2065.1 | 5381.3 | 4382.8 | -1347.3 | -3083.2 | 1557.0 | 106.8 | 10.6 |
Note: The cropland redistribution is not an effective way to reduce GHGs, with the exceptions of Hubei, Hunan, Guangxi, Guangdong and Fujian provinces. In addition, cropland optimization always comes with high costs and a long transitional period for farmers. |
Table 4 Mitigation potentials at the provincial level |
| Province | GHGs per hectare (kg CO2-eq ha-1) | Total GHGs (Tg CO2-eq) | Reduction rate (%) | ||
|---|---|---|---|---|---|
| BAU | S | BAU | S | ||
| Heilongjiang | 3843.6 | 3457.4 | 14.9 | 13.4 | 10.0 |
| Hubei | 5489.7 | 4275.4 | 25.0 | 19.0 | 24.0 |
| Anhui | 6100.4 | 4670.3 | 15.8 | 12.1 | 23.5 |
| Zhejiang | 6072.3 | 4707.1 | 3.9 | 3.0 | 21.6 |
| Jiangsu | 5031.3 | 3877.7 | 11.2 | 8.6 | 23.1 |
| Yunnan | 4152.8 | 3398.4 | 3.2 | 2.6 | 18.9 |
| Jilin | 2248.8 | 1856.4 | 1.9 | 1.6 | 17.5 |
| Liaoning | 2639.0 | 2092.2 | 1.4 | 1.1 | 20.7 |
| Henan | 3528.6 | 3194.9 | 2.2 | 2.0 | 9.5 |
| Shandong | 5719.3 | 4363.4 | 0.6 | 0.5 | 23.7 |
| Shanghai | 4354.3 | 3413.0 | 0.4 | 0.3 | 21.6 |
| Ningxia | 5305.2 | 4209.9 | 0.3 | 0.3 | 20.6 |
| Hebei | 3827.7 | 3518.1 | 0.3 | 0.3 | 8.1 |
| Xinjiang | 4187.9 | 3709.8 | 0.2 | 0.2 | 11.4 |
| Inner Mongolia | 2689.5 | 2019.1 | 0.4 | 0.3 | 24.9 |
| Tianjin | 3513.6 | 3216.2 | 0.2 | 0.2 | 8.5 |
| Shanxi | 4897.1 | 4618.6 | 0 | 0 | 5.7 |
| Fujian | 7536.5 | 4970.1 | 4.6 | 3.3 | 29.2 |
| Guangxi | 6918.8 | 4735.5 | 12.2 | 10.5 | 14.1 |
| Jiangxi | 6106.6 | 4496.5 | 20.6 | 15.8 | 23.3 |
| Hunan | 5206.8 | 4139.9 | 21.0 | 17.0 | 19.2 |
| Chongqing | 3955.1 | 2948.4 | 2.6 | 1.9 | 25.5 |
| Sichuan | 3888.1 | 2971.5 | 7.3 | 5.5 | 23.6 |
| Guizhou | 3733.8 | 3322.5 | 2.5 | 2.2 | 11.0 |
| Shaanxi | 3052.7 | 2704.3 | 0.3 | 0.3 | 11.4 |
| Hainan | 7154.6 | 5021.9 | 1.6 | 1.4 | 17.1 |
| Guangdong | 6831.0 | 5046.5 | 12.6 | 10.8 | 14.1 |
| Total | 5228.1 | 4191.2 | 167.3 | 134.1 | 19.9 |
Note: “BAU” and “S” represent the business-as-usual scenario and the mitigation scenario, respectively. |
Table 5 Specific and practical measures |
| Mitigation technology | Impelmtation method | Reference |
|---|---|---|
| Water saving irrigation technologies | Mid-season drainage | Haque et al., 2016 |
| Alternating wet and dry irrigation | Runkle et al., 2019 | |
| Shallow irrigation and intermittent irrigation | Chen and Chen, 2023 | |
| Precision fertilization | Integrated soil-crop system management | Cui et al., 2018 |
| Crop models or field experiments | Cai et al., 2023; Wu et al., 2015 | |
| Deep placement | Liu et al., 2020 | |
| Effective energy utilization | Fuel consumption reduction | Xu et al., 2012 |
| Clean energy (e.g., solar photovoltaic water pumping power and solar dryers) | Ghasemi-Mobtaker et al., 2020 | |
| Biofuels | Yang et al., 2018 |
| [1] |
|
| [2] |
|
| [3] |
|
| [4] |
|
| [5] |
|
| [6] |
|
| [7] |
|
| [8] |
|
| [9] |
|
| [10] |
FAO (Food and Agriculture Organization of the United Nations). 2020. Agrifood systems. https://www.fao.org/faostat/en/#data/GT/visualize.
|
| [11] |
FAO (Food and Agriculture Organization of the United Nations). 2022. Agrifood systems.
|
| [12] |
FAO (Food and Agriculture Organization of the United Nations). 2021. Crops and livestock products. https://www.fao.org/faostat/en/#data/GT.
|
| [13] |
|
| [14] |
|
| [15] |
|
| [16] |
|
| [17] |
|
| [18] |
|
| [19] |
|
| [20] |
|
| [21] |
|
| [22] |
IPCC. 2021. Climate Change 2021:The physical science basis. Contribution of Working Group I to the Sixth Assessment Report of the Intergovernmental Panel on Climate Change. Cambridge, UK: Cambridge University Press.
|
| [23] |
|
| [24] |
|
| [25] |
|
| [26] |
|
| [27] |
|
| [28] |
|
| [29] |
|
| [30] |
|
| [31] |
|
| [32] |
|
| [33] |
|
| [34] |
|
| [35] |
|
| [36] |
|
| [37] |
|
| [38] |
|
| [39] |
|
| [40] |
|
| [41] |
|
| [42] |
|
| [43] |
|
| [44] |
|
| [45] |
|
| [46] |
|
| [47] |
|
/
| 〈 |
|
〉 |