Human Activities and Sustainable Development

Spatiotemporal Evolution and Driving Factors of Industrial Wastewater Discharge in China

  • WANG Yimin ,
  • LI Xianchuan ,
  • ZHAO Meng , *
Expand
  • Faculty of Civil Engineering and Mechanics, Kunming University and Technology, Kunming 650500, China
* ZHAO Meng, E-mail:

WANG Yimin, E-mail:

Received date: 2024-08-19

  Accepted date: 2024-11-25

  Online published: 2025-05-28

Abstract

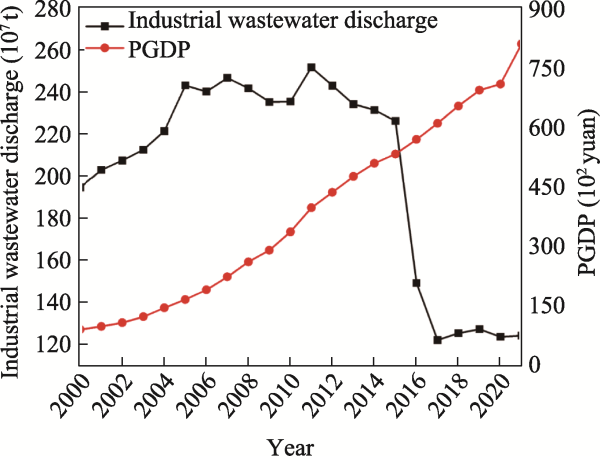
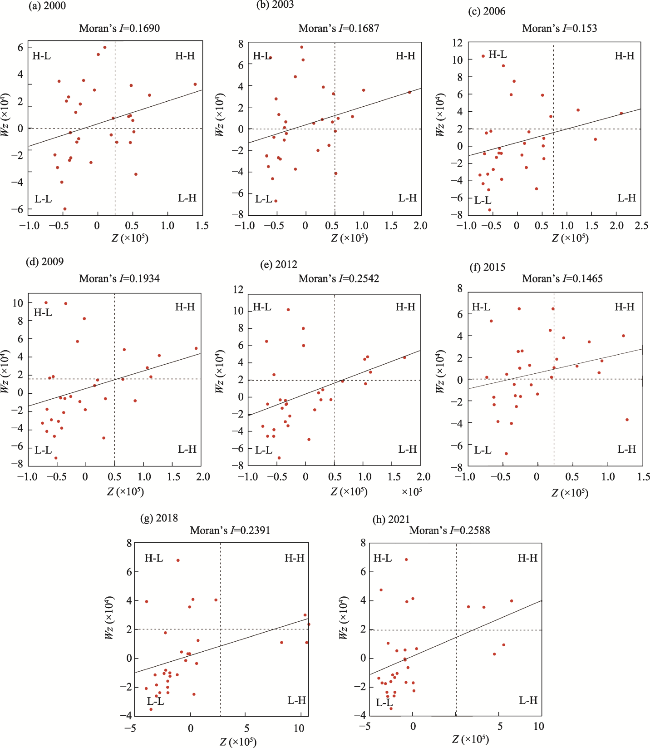
China’s rapid economic growth since 2000 has been closely linked to an increase in environmental pollution, and industrial wastewater discharge during the industrialization process has significantly impacted the country’s ecological environment. While early industrialization was strongly associated with environmental degradation, the situation has improved over time, largely due to the implementation of environmental protection policies and technological innovations. However, the long-term effects of industrialization on the environment remain, with significant regional disparities. Through Exploratory Spatial Data Analysis (ESDA), this study examines the spatial and temporal trends of industrial pollution discharges in China from 2000 to 2021 and their drivers. The results show a sharp rise in discharges during the early stages of that period, peaking around 2011. Since then, the discharges have declined steadily following the adoption of environmental policies and technological advances, supporting the Environmental Kuznets Curve (EKC) hypothesis. Spatially, discharges from developed regions in the east and south were markedly higher than those from other areas, reflecting significant regional imbalances. Moran’s I analysis further demonstrated a spatial clustering effect, with high discharges concentrated in a small number of provinces. Considering these findings, this study recommends further reductions in industrial pollutant discharges and fostering sustainable economic and environmental development through the enhancement of environmental technologies, the optimization of industrial structures, and the promotion of coordinated regional governance.

Cite this article

WANG Yimin , LI Xianchuan , ZHAO Meng . Spatiotemporal Evolution and Driving Factors of Industrial Wastewater Discharge in China[J]. Journal of Resources and Ecology, 2025 , 16(3) : 618 -629 . DOI: 10.5814/j.issn.1674-764x.2025.03.002

1 Introduction

Rapid global economic growth and industrialization have posed significant challenges to sustainable development, especially in developing countries. Among these challenges, industrial wastewater discharges have emerged as a critical threat to ecosystems and public health (Wang et al., 2021a). With the world’s second-largest economy, China’s industrialization has exerted substantial pressure on its environment. Despite recent initiatives such as the “Beautiful China” strategy and various environmental protection measures, industrial wastewater discharges remain persistently high in certain regions, particularly in the water-scarce eastern provinces (Bu et al., 2021). These discharges jeopardize water security, contribute to widespread water pollution, and disrupt ecological stability. Hence, understanding the spatiotemporal patterns of industrial wastewater discharge and their driving factors is essential for developing more targeted environmental management policies (Geng et al., 2014).
The relationship between economic growth and pollution has been extensively examined in previous research. Notably, the Environmental Kuznets Curve (EKC) hypothesis suggests that pollution levels initially increase with economic growth but eventually decline as economies mature, with that decline driven by technological advancements and heightened environmental awareness (Xiang et al., 2022). While some studies have explored spatial-temporal patterns and regional disparities in wastewater discharge (Ma et al., 2020; Liu et al., 2022), others have investigated the coupling of wastewater discharge with economic activities or assessed the influence of emerging factors like the digital economy (Chen and Chen, 2021; Sun et al., 2022). However, comprehensive studies that combine national-scale analysis with an exploration of spatial spillover effects remain limited. In addition, much of the existing literature focuses on short-term periods or localized regions, while ignoring the broader implications of industrial restructuring, technological progress, and policy interventions on wastewater discharge (Liu and Guo, 2023).
This study seeks to fill these gaps by systematically analyzing the spatiotemporal evolution of industrial wastewater discharges across China from 2000 to 2021. Employing Exploratory Spatial Data Analysis (ESDA) and the Spatial Durbin Model (SDM), this research identified spatial clustering patterns and quantified the cross-regional spillover effects of discharges. These methodologies enable a more comprehensive understanding of the dynamic interplay between economic growth, environmental policies, and technological advancements.
The EKC framework serves as a theoretical lens for this analysis. Initially proposed by Kuznets in the context of economic inequality (Kuznets, 1955), it has since been extended to environmental studies. The EKC posits an inverted U-shaped trajectory for pollutant discharges relative to economic growth, with discharges rising during the early phases of development and declining as economies advance. While EKC has been globally validated, most studies have overlooked the nuanced spatial and temporal variations inherent in this relationship. Research on the applicability of EKC to industrial wastewater discharge at the regional level in China remains scarce, underscoring the need for further investigation.
This study examined the regional disparities and long-term trends in wastewater discharges while considering key factors such as GDP per capita, urbanization rate, population density, and secondary industry production. By integrating ESDA and SDM, this research highlights both the direct and indirect influences of these factors, offering insights into the spatial dynamics of discharges. The findings validate the EKC hypothesis within the Chinese context and provide actionable recommendations for policymakers to achieve sustainable development goals.

2 Data sources and empirical models

2.1 Data sources

This study examines data spanning from 2000 to 2021, with a focus on industrial wastewater discharges in the various Chinese provinces, based on information from the China Environmental Statistics Yearbook. In addition, supplementary data on population, industrial structure, GDP, population density, and urbanization rates were sourced from the China Statistical Yearbook, the China Energy Statistical Yearbook, and the China Circular Economy Yearbook. To ensure data consistency and comparability, the analysis excluded Hong Kong, Macau and Taiwan.
While these sources are robust and widely recognized, variations in reporting practices and statistical standards among the provinces and over the years introduce certain inconsistencies. For example, differences in wastewater measurement techniques or policy-driven changes in reporting requirements may have influenced the presentation of discharge data over time. To address these challenges, this study employed rigorous data standardization methods and cross-referenced multiple sources to enhance data consistency and reliability. Leveraging these measures ensures a credible representation of the industrial wastewater discharges across China.

2.2 Empirical models

This study used various empirical models and analytical methods to explore the factors influencing industrial wastewater discharge, as well as its spatial and temporal patterns. These approaches included examining the link between economic development and environmental pollution, conducting spatial statistical analysis, and applying multifactor regression models.

2.2.1 EKC curve analysis of industrial wastewater
discharge data

To explore the relationship between GDP and industrial wastewater discharge, this study applied both quadratic and cubic regression models under the framework of the EKC hypothesis. The quadratic model assumes a straightforward inverse U-shaped curve, representing the idea that pollution initially rises with economic growth but eventually declines as economies reach higher levels of development (Yang et al., 2010):
Y i t = α + β 1 X i t +   β 2 X i t 2 + ε i t
where Yit represents the annual industrial wastewater discharge for province i in year t, while Xit refers to the GDP per capita of the same province and year. The term Xit2 captures the nonlinear relationship expected under the EKC hypothesis, allowing for a turning point where pollution begins to decrease as economic development advances. For the coefficients, α is the intercept, β1 and β2 are coefficients to be estimated, and εit represents the error term accounting for unexplained variation.
To further refine the analysis, a cubic term was introduced in the extended model:
Y i t = α + β 1 X i t +   β 2 X i t 2 + β 3 X i t 3 + ε i t
The cubic model provides additional flexibility by capturing more complex dynamics. Unlike the quadratic model, which assumes a simple turning point, the cubic model accommodates an “N-shaped” curve with two potential turning points. This suggests that pollution may initially increase with GDP, decrease at intermediate levels, and potentially rise again in regions with exceptionally high economic output. Such dynamics are particularly relevant in areas where industrial intensification or energy demand may offset earlier environmental gains. Each coefficient in the cubic model provides specific insights: β1 reflects the initial relationship between GDP per capita and discharge; β2 indicates the degree of curvature that defines the inverse U-shaped pattern; and β3 captures the potential for a secondary rise in discharges at higher GDP levels. Together, these coefficients can reveal nuanced trends in how industrial wastewater discharges evolve with economic growth.
In the context of this study, the cubic model was critical for analyzing regional disparities in the economic-pollution relationship. While many provinces adhere to the classic EKC trajectory, some with high GDP levels may deviate from it due to intensified industrial activity or delayed policy enforcement (Brajer et al., 2008). Comparing the results of both models provides a comprehensive understanding of the EKC hypothesis and its applicability to China’s industrial wastewater discharges.

2.2.2 Analysis of the Moran index

Moran index (Moran’s I) is a widely used measure of spatial autocorrelation that was introduced by Moran in 1950 to assess the degree of similarity between neighboring geographic regions. In this study, the local Moran’s I was applied to detect localized spatial clusters or dispersion patterns of industrial wastewater discharge. This index can reveal the spatial relationships between different regions and aids in identifying pollution hotspots as well as areas with low discharge. Such insights are valuable for developing more precise environmental management strategies for government agencies and other relevant stakeholders (Musakwa and Van Niekerk, 2014; Zhang et al., 2020).
The local Moran’s I was used to quantify the degree of spatial autocorrelation at each location, and thus provide insight into the nature of localized spatial patterns. This index takes values within the range of -1 to 1. A value of Ii greater than 0 indicates positive local spatial autocorrelation, implying that similar values are clustered around location i. Conversely, an Ii value less than 0 indicates negative local spatial autocorrelation, whereby dissimilar values are clustered around location i. An Ii of 0 indicates the absence of a notable spatial autocorrelation in that particular location, suggesting a random distribution in the surrounding area (Fernández-Fernández et al., 2019; Hata et al., 2021). The formula for calculating the local Moran’s I is:
I i = x i x ¯ S 2 j = 1 N w i j ( x j x ¯ )
In equation (3), Ii represents the local Moran’s I for the i-th region, indicating the degree of spatial autocorrelation around that region. The observations for the i-th and j-th regions are denoted as xi and xj, respectively, while x ¯ is the mean value of all regional observations. The spatial weighting matrix element, wij, reflects the spatial relationship between regions i and j. The variance of the observations S2 is defined as:
  S 2 = 1 N i = 1 N w i j ( x i x ¯ ) 2
In this context, S2 represents the variance of the observations and serves to standardize the differences between individual observations and the mean value, ensuring that the local Moran’s I is appropriately scaled. This formula ensures a precise quantification of localized spatial patterns, enabling the identification of clustering or dispersion in industrial wastewater discharge. By applying this method, regions with strong spatial relationships or contrasting discharges can be systematically analyzed, providing actionable insights for environmental governance and policy optimization.

2.2.3 Analysis of spatial measurement models

In this study, the Spatial Durbin Model (SDM) was employed to explore the factors affecting industrial wastewater discharge. The SDM accounts for both the direct impact of variables and the spatial lag effect, which enables a more thorough analysis of how the different factors affect industrial wastewater discharge (Zhao et al., 2020; Wang et al., 2021b).
Y i t = α + ρ W Y i t + X i t β + W X i t θ + σ i t
In this model, Yit represents the industrial wastewater discharge in province i during year t, while Xit is a vector of explanatory variables, including secondary industry output, population density, urbanization rate, and GDP. The matrix W acts as the spatial weighting matrix, which indicates the spatial relationships between regions. WYit represents the spatial lag of industrial wastewater discharge, and WXit captures the spatial lag of the explanatory variables. For the coefficients, α denotes the constant term, and ρ and β are vectors of coefficients to be estimated, with θ as the spatial autoregressive coefficient. The error term is denoted by σit.
The SDM effectively captures both “direct” impacts within a region and “indirect” spillover effects on neighboring regions, providing insights into spatial interdependencies (Pan et al., 2021). Unlike other models such as SAR and SEM, which focus on limited spatial relationships, the SDM incorporates spatial lags of both dependent and explanatory variables, which enables a more comprehensive analysis of cross-regional interactions (Elhorst and Fréret, 2009). This makes SDM particularly suitable for studying industrial wastewater discharges in China, where economic networks and shared water systems create significant spatial linkages, so the results can offer critical insights for regional and national wastewater management.

3 Results and discussion

3.1 Descriptive statistical analysis

The descriptive statistics for industrial wastewater discharge and related variables in each province were analyzed for the period from 2000 to 2021. The values presented in Table 1 represent the annual averages over the 22-year period, in terms of the mean, standard deviation, minimum, and maximum values of the main variables.
Table 1 Annual average descriptive statistics of the main variables in China (2000-2021)
Variable Mean Std. Dev. Min Max
Industrial wastewater discharge (106 t) 651.78 627.70 2.04 341.61
GDP per capita (103 yuan) 37.98 30.22 2.66 183.98
Population density (persons km-2) 424.74 635.34 2.14 3988.78
Urbanization rate (%) 50.05 17.52 15.66 89.60
Secondary sector output (109 yuan) 732.89 826.64 2.72 5177.54
The descriptive statistics reveal significant variability in the main variables, underscoring pronounced regional disparities in economic and industrial characteristics. For example, industrial wastewater discharge averaged 6.5178×10⁸ t annually, with a standard deviation of 62769.60 t, reflecting substantial differences between the provinces. These disparities align closely with their levels of industrialization, with manufacturing hubs such as Jiangsu and Guangdong contributing to the higher end of the spectrum, while less industrialized provinces remain at the lower end (Šipuš et al., 2012).
GDP per capita ranged from 26620 to 1.8398×10⁵ yuan, further highlights the economic imbalances among the regions, with the developed eastern provinces achieving significantly higher levels compared to the central and western regions. Population density averaged 424.74 persons km-2 but ranged widely from sparsely populated provinces like Tibet to highly urbanized areas such as Shanghai, illustrating the diverse demographic and spatial characteristics across the country.
Urbanization rates and industrial output exhibit similar disparities. Provinces with higher urbanization rates, particularly in the eastern coastal regions, tend to have more advanced wastewater management systems but also face intensified environmental pressures from their concentrated industrial and residential activities. Industrial output shows the greatest variability, ranging from 2.72×10⁹ to 5.17754×10¹² yuan, with developed provinces dominating the upper range, reflecting their significant contributions to national economic activity and corresponding environmental challenges.
These statistics provide a crucial foundation for understanding the disparities in industrial activity, economic development, and urbanization among the provinces. They also set the stage for a deeper examination of the specific factors influencing industrial wastewater discharge, which can offer insights into the design of more effective and regionally tailored environmental management strategies.

3.2 EKC curve analysis of industrial pollution discharges

The EKC hypothesis provides a framework for examining the relationship between economic development and industrial wastewater discharge. Figures 1 and 2 depict this relationship and the trends from 2000 to 2021. The data demonstrate that industrial wastewater discharge exhibited a classic inverted U-shaped curve with increasing GDP per capita. In the initial sqtages of economic growth, discharge was relatively low, but it rose significantly as industrial activities intensified and economic expansion accelerated. This pattern suggests that during early economic development, the environmental costs of industrialization outweigh the benefits of technological advancements and heightened environmental awareness.
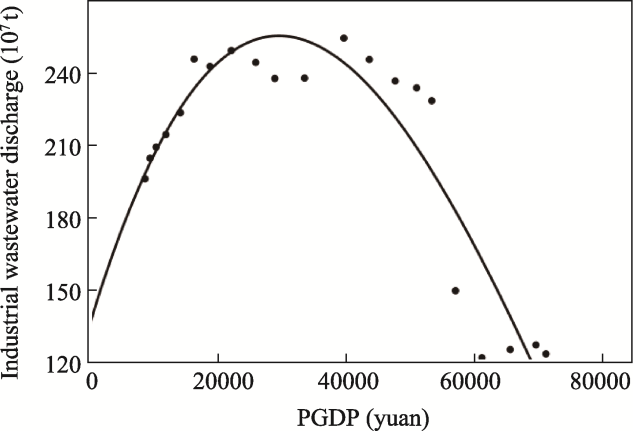
Figure 1 EKC of GDP per capita and industrial wastewater discharge in China (PGDP represents GDP per capita)
Figure 2 Trends in industrial wastewater discharge and GDP per capita in China, 2000-2021
The data shows that in 2000, China’s industrial wastewater discharge totaled 1.9427×10⁹ t, with GDP per capita at 8592.48 yuan. By 2004, the discharges had increased to 2.21×10⁹ t, while GDP per capita rose to 14079.39 yuan. Discharges peaked in 2011 at nearly 2.40×10⁹ t, while GDP per capita reached approximately 35000 yuan. After this peak, the discharges began to decline despite continued economic growth, marking a turning point in the EKC curve.
This decline in discharge reflects increasing environmental awareness and the progressive implementation of government policies. In particular, The law promulgated by China in 2008 on the Prevention and Control of Waterborne Discharges, which began to be rigorously enforced after 2011, played a crucial role in reducing wastewater discharges (Jiang et al., 2014). This law introduced stricter pollution discharge standards and required industries to install advanced wastewater treatment facilities, leading to significant reductions in industrial discharges. In addition, the Water Pollution Prevention and Control Action Plan (2015-2020) mandated further upgrades to wastewater treatment infrastructure and enforced penalties for non-compliance. These policies, combined with advances in industrial technologies, contributed to the sharp decline in wastewater discharge after 2011.
By 2021, industrial wastewater discharge had declined by approximately 50% from the peak, providing strong support for the EKC hypothesis (Tian et al., 2022). The EKC analysis of industrial wastewater discharge from 2000 to 2021 shows that the amount of discharge initially rose along with economic growth. However, as environmental policies were enforced, technological innovations were adopted, and industrial restructuring occurred, the discharges begin to decline once a certain level of economic development was reached. Through the implementation of these policies and regulations, China has effectively balanced economic growth with environmental protection, further validating the EKC hypothesis within the Chinese context (Hu and Lee, 2008; Luo et al., 2017).
While the national trend shows an inverted U-shaped curve for industrial wastewater discharge relative to economic growth, significant regional differences exist. Economically developed regions, such as the eastern provinces of Jiangsu, Zhejiang, and Guangdong, had higher initial discharges due to rapid industrialization. However, these regions were also early adopters of environmental regulations and technologies, contributing to a faster decline in discharges as GDP per capita increased. In contrast, the less developed western and central regions such as Ningxia, Qinghai, and Xinjiang experienced slower industrial growth and thus lower discharge levels. These areas have only recently begun to implement stricter environmental policies, which may explain their lag in discharge reductions compared to the more affluent regions (Farzadkia et al., 2020).
Policy variations among regions have also impacted discharge trends. For example, the eastern provinces benefited from early investments in wastewater treatment infrastructure and received more stringent oversight due to their industrial density. On the other hand, the central and western regions with fewer resources faced challenges in implementing such infrastructure, which contributed to slower progress in discharge reductions. These regional differences underscore the roles of both economic development levels and policy intensity in shaping industrial wastewater discharge across China.

3.3 Spatial autocorrelation analysis

The spatial clustering of industrial wastewater discharges offers valuable insights into regional disparities and their underlying drivers (Chen and Yan, 2022). Figure 3 depicts the Moran’s I scatter plot for China’s industrial wastewater discharge between 2000 and 2021, which captures the degree of clustering among different regions and the dynamic shifts in spatial relationships over time. This plot highlights the persistent clustering of high-discharge and low-discharge areas, illustrating both stability and changes in the regional patterns of pollution. These observations are integral for understanding the roles of economic activities, industrial development, and environmental policies in shaping the spatial distribution of wastewater discharges.
Figure 3 Scatter plot of Moran’s I index for industrial wastewater discharge in China
The analysis of the Moran’s I scatterplot for China’s industrial wastewater discharge from 2000 to 2021 reveals notable spatial autocorrelation with fluctuations over time, yet a persistent and significant spatial clustering effect. In this context, a Moran’s I value above 0 indicates positive spatial autocorrelation, where similar discharge levels tend to cluster together. Values closer to 0.25 or higher suggest stronger spatial clustering, which we interpret as high spatial aggregation. Note that Moran’s I remains consistently positive, exceeding 0.15 in most years and peaking at 0.2588, indicating moderate to strong clustering of the high and low discharges across the regions.
The scatterplot highlights a concentration of points in the first quadrant (H-H) and third quadrant (L-L), confirming the tendency for high-discharge regions to cluster with other high-discharge areas, while low-discharge regions tend to be grouped with other low-discharge areas. For instance, the high-discharge (H-H) regions are primarily located in eastern provinces such as Shanghai, Jiangsu, and Shandong. Conversely, low-discharge (L-L) regions are concentrated in western provinces like Xinjiang, Ningxia, and Tibet, demonstrating the relative stability of discharge over time.
Furthermore, H-L type areas (high discharge regions adjacent to low discharge regions) are mainly found in Sichuan and Liaoning provinces, though their prevalence has diminished over time. For example, domestic wastewater discharge in Hebei surpassed that in Liaoning by 2010, shifting Liaoning from an H-L type to an L-L type region. L-H type areas (low-discharge zones neighboring high-discharge zones) are predominantly in Fujian, Jiangxi, and Chongqing, and located near high-discharge regions such as Guangdong, Zhejiang, Sichuan, and Hubei.
While Moran’s I fluctuates year by year, the general trend suggests an increase in spatial autocorrelation in some periods. This variation may be influenced by adjustments to environmental policies and changes in economic activities. Throughout the study period, the Chinese government continued to introduce key environmental measures aimed at reducing industrial wastewater discharge, which shaped the observed trends in spatial autocorrelation (Cheniti et al., 2021).
For example, implementation of the Water Pollution Prevention and Control Action Plan (2015-2020) modernized industrial plants by enforcing strict pollution discharge standards and introducing a wastewater discharge permit system (Cheng et al., 2016). Moreover, the Central Environmental Protection Inspection System significantly improved local environmental governance. Regular environmental inspections and accountability mechanisms ensured that local governments and enterprises adhered to environmental laws, thereby promoting effective pollution control. These policies have played a crucial role in reducing industrial wastewater discharge and enhancing water quality nationwide.
In summary, the spatial autocorrelation of industrial wastewater discharge in China from 2000 to 2021 shows significant fluctuations but reveals a clear geospatial clustering effect between the high- and low-discharge areas. This phenomenon is closely tied to a series of environmental policies implemented by the Chinese government, which have reduced wastewater discharge and improved regional water environments by strengthening regulation and encouraging technological innovation. These findings offer valuable insights for further optimizing environmental policies and regional governance.
Building on the Moran’s I analysis, Figure 4 provides a comprehensive geographic visualization of the industrial wastewater discharges across China. These maps further illustrate the regional disparities, offering a spatial perspective on the clustering effects and discharge patterns discussed above. This visualization complements the statistical findings by highlighting specific high- and low-discharge regions, which contributes to the interpretation of spatial dynamics over the study period.
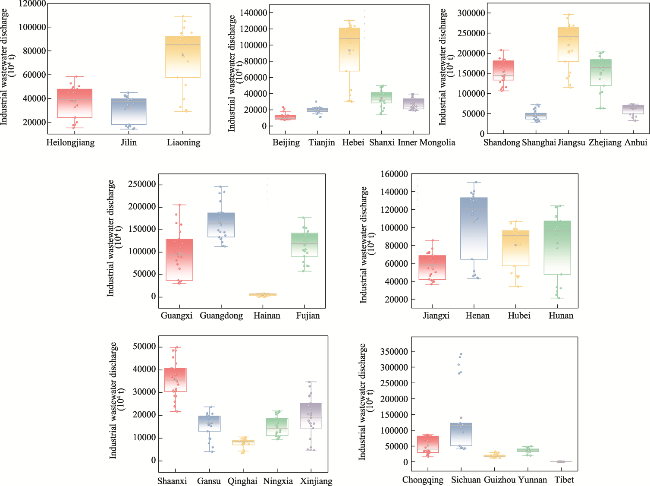
Figure 4 Distribution of industrial wastewater discharges in China from 2000 to 2021
Between 2000 and 2021, Figure 4 illustrates the geographical distribution of industrial wastewater discharges across the Chinese provinces. The color gradient represents discharge levels, with lighter blue shades corresponding to discharges between 2.04×10⁶ and 4.2×10⁷ t, and darker blue shades indicating discharges exceeding 4.5×10⁸ t. Intermediate shades represent discharges of 4200.01×104- 14500×104 t, 14500.01×104-22000×104 t, and 22000.01×104- 45000×104 t. This system categorizes the provinces based on these gradients, highlighting distinct regional patterns of industrial wastewater discharge over the study period.
The data reveals pronounced regional disparities in industrial wastewater discharge. Eastern coastal provinces, such as Jiangsu, Zhejiang, Shandong, and Guangdong, consistently exhibit the darkest shades, reflecting the highest levels of discharge throughout the study period. These provinces are characterized by dense industrial activity, advanced economic development, and the dominance of manufacturing and heavy industries (Zhang et al., 2023). Despite substantial investments in pollution control measures and wastewater treatment technologies, the total discharges in these regions remain high due to the scale and intensity of their industrial output.
In contrast, the central and western provinces including Sichuan, Shaanxi, and Xinjiang are represented by lighter shades, indicating relatively lower levels of discharge. Notably, some of these regions, such as Sichuan and Shaanxi, initially exhibited darker shades during the earlier years of the study period, reflecting high levels of wastewater discharge driven by industrial growth. Over time, these provinces transitioned to lighter shades, suggesting the impacts of stricter environmental regulations and improved wastewater management practices. This shift highlights the roles of policy interventions and technological advancements in stabilizing or reducing discharges in regions undergoing industrialization.
The observed regional disparities in industrial wastewater discharge are closely tied to the implementation of region-specific environmental policies and industrial strategies. In the eastern coastal provinces, initiatives such as the Circular Economy Demonstration Program have emphasized resource efficiency and wastewater recycling in key industries. For instance, Guangdong has developed advanced circular economy practices that integrate wastewater reuse into industrial processes to reduce untreated discharges. Similarly, Jiangsu has introduced incentive schemes to encourage cleaner production technologies that have resulted in measurable improvements in wastewater management. However, these regions continue to face challenges in mitigating the absolute discharge volumes driven by their large-scale industrial activities.
In the central and western provinces, where industrial activities are less concentrated, environmental policies have aimed to align new industrial projects with sustainability goals (Cheng et al., 2022). For example, Sichuan recently launched the Industrial Wastewater Recycling Implementation Plan (2024-2026) to promote wastewater reuse and improve water use efficiency. Meanwhile, Shaanxi has focused on enforcing stricter environmental standards for high-pollution industries, which has limited their expansion while fostering greener industrial practices. These initiatives demonstrate a growing emphasis on sustainable development, but ongoing industrialization in these regions highlights the need for continuous monitoring and tailored policy interventions.

3.4 Spatial and temporal changes in industrial wastewater discharge

The temporal and spatial dynamics of industrial wastewater discharge in China between 2000 and 2021 reveal significant regional disparities and evolving trends. Figure 5 provides a comprehensive visual representation of these annual changes, highlighting differences among the provinces and the factors driving these variations. This figure captures not only the concentrations of discharges in economically developed regions but also the emergence of fluctuations in areas undergoing industrial transformation. This nuanced portrayal of regional discharge patterns underscores the interplay between economic activities, industrial policies, and environmental management practices over the past two decades. It sets the stage for a deeper exploration of the factors influencing these trends and their implications for future policymaking.
Figure 5 Analysis of the temporal and spatial distributions of industrial wastewater discharges in China, 2000-2021
The box plots of industrial wastewater discharges from 2000 to 2021 highlight significant variations among the provinces during this period. Overall, industrial wastewater discharge levels were notably higher in the eastern region compared to the central and western regions, particularly from 2000 to 2010. Economically advanced eastern provinces such as Jiangsu, Zhejiang, and Shandong consistently exhibited high and fluctuating discharges, as indicated by the longer box lengths, reflecting the intensity of industrial activities and the peaks in wastewater discharge (Peng et al., 2023). The rapid economic growth and heavy concentration of industrial operations during this time contributed to the surge in discharges. However, the progressive introduction of environmental protection policies, such as the Action Plan to Prevent and Control Waterborne Discharges, has led to substantial reductions in discharges in the eastern region. The distribution has also become more centralized in recent years, highlighting the effectiveness of these policies.
In contrast, industrial wastewater discharges in the central and western regions, including provinces like Qinghai, Tibet, and Gansu, remained much lower and were less volatile compared to the east. The more concentrated distribution reflects the lower level of industrialization in these regions, which has kept overall discharges relatively low (Dufatanye et al., 2022). Nonetheless, as industrialization progressed in some central and western provinces, fluctuations in discharges have become more evident. For instance, Inner Mongolia in 2007 and Guangxi in 2015 saw significant increases in their discharges, likely linked to accelerated industrialization and industrial relocation.
Anomalous values were observed in certain provinces during specific years. For example, Jiangsu’s discharges surged in 2015, potentially reflecting changes in industrial operations or shifts in policy enforcement during that time. Similarly, the spikes in Inner Mongolia and Guangxi suggest the inherent volatility of industrial growth and policy implementation in these areas. While these outliers do not alter the overall trend of declining discharges, they provide valuable insights into the short-term dynamics within specific provinces.
Between 2000 and 2010, China experienced its peak of industrial wastewater discharge. Since then, discharges have gradually decreased due to stronger environmental policies, particularly in the eastern provinces. However, the discharges in some central and western regions continue to fluctuate, especially in provinces experiencing rapid industrialization like Inner Mongolia and Guangxi. Moving forward, future environmental policies should emphasize the central and western regions, to ensure that industrialization proceeds in a way that effectively controls pollution and prevents a resurgence in discharges in those regions (Guo et al., 2022).

3.5 Direct and indirect impacts

The SDM framework was employed to examine the direct and indirect impacts of economic and social factors—such as GDP per capita, urbanization rate, population density, and secondary industry output—on industrial wastewater discharges. see Table 2 and Table 3. This analysis highlights how regional economic dynamics and spatial interdependence shape pollution patterns across China (Ma et al., 2020).
Table 2 Descriptions of variables
Variable name Variable description Notation
Industrial wastewater Industrial wastewater discharge Y
GDP per capita Average GDP per person PGDP
Population density Population per square kilometer PD
Urbanization rate Urban population as a percentage of total population UR
Secondary sector
output
Gross domestic product of the secondary sector IP
Table 3 Results of regression analysis of factors affecting industrial wastewater discharge
Variant Ratio Standard error Z-value P-value
lnPGDP -1.027 0.361 -2.847 0.004 ***
lnUR 0.744 0.641 1.162 0.245
lnPD 0.116 0.105 1.097 0.273
lnIP 1.045 0.111 9.437 <0.001***
R² 0.921
R ¯ 2 0.888
F-value 27.280 <0.001***

Note: * indicate 10% level of significance; ** indicate 5% level of significance; *** indicate 1% level of significance.

With a regression coefficient of -1.027 at the 1% significance level (P=0.004), the effect of lnPGDP on industrial wastewater discharges was found to be significantly negative. This finding aligns with the EKC hypothesis, which posits that discharges decline after a region reaches a certain level of economic growth, suggesting that industrial wastewater discharges decrease as economic development advances.
On the other hand, lnIP showed a positive and statistically significant relationship with industrial wastewater discharge, with a regression coefficient of 1.045 at the 1% significance level (P<0.001). This indicates that as the scale of industrial activity increases, so does wastewater discharge.
In contrast, the effects of lnUR and lnPD on industrial wastewater discharge were not statistically significant. This suggests that wastewater discharges did not significantly increase in highly urbanized and densely populated areas, likely due to more advanced wastewater treatment infrastructure and environmental protection technologies mitigating the environmental impact of population growth.
The SDM analysis revealed a significant spatial spillover effect associated with secondary industry output. This finding suggests that industrial wastewater discharges are influenced not only by industrial activity within a region but also by economic activities in neighboring regions, highlighting a clear spatial interdependence. For example, regions with high industrial output often stimulate demand for supporting industries and services in adjacent areas, indirectly increasing wastewater discharges in those neighboring regions. Furthermore, interconnected supply chains link production processes and raw material extraction across regions, amplifying the environmental burden beyond local boundaries. Shared water resources, such as rivers and lakes, also play a role in transmitting pollutants from high-discharge areas to adjacent lower-discharge regions, further reinforcing the spatial spillover effects (Song et al., 2023). These dynamics emphasize the regional nature of industrial wastewater discharges, where economic activities across borders interact and shape environmental outcomes. To effectively address these challenges, strengthened cross-regional coordination and cooperation are essential for managing industrial wastewater and mitigating its environmental impacts.
In summary, the direct and indirect effects of economic growth and secondary industry output on industrial wastewater discharge are particularly pronounced, while the influences of urbanization and population density are less significant. These findings provide a valuable basis for shaping environmental policy. Policymakers should focus on regions with concentrated industrial activities and enhance interregional collaboration to effectively manage and reduce industrial wastewater discharges (Shen, 2020).

4 Conclusions and recommendations

In this study, the spatial and temporal evolution of industrial wastewater discharges in China from 2000 to 2021 were investigated by systematically analyzing the main influencing factors using SDM. The conclusions drawn from the findings are threefold.
(1) Temporal evolution characteristics. From 2000 to 2011, industrial wastewater discharges in China followed a consistent upward trend, driven largely by rapid industrialization and economic growth. However, beginning in 2011, as environmental policies such as the Action Plan for the Prevention and Control of Water Pollution began to take effect, a significant reduction in wastewater discharges was observed. A particularly sharp decline in discharges occurred in 2016, illustrating the success of environmental policies and technological advancements in controlling pollution. Overall, industrial wastewater discharge exhibits an inverted U-shaped pattern, rising initially before declining, which supports the EKC hypothesis.
(2) Spatial distribution characteristics. Industrial wastewater discharges were predominantly concentrated in eastern and southern China, particularly in provinces such as Jiangsu, Zhejiang, and Guangdong, where dense industrial activity drives high discharge levels. Despite significant investments in wastewater treatment and stricter regulations, these regions continue to face environmental pressures due to their large-scale industrial bases. In contrast, central and western provinces such as Sichuan and Xinjiang recorded relatively lower discharges, reflecting their smaller industrial output. However, as industrialization accelerates in these regions, proactive measures will be necessary to manage any potential increases. The SDM analysis also underscores spatial spillover effects, where economic activities and pollution in high-discharge regions impact neighboring areas, highlighting the importance of cross-regional collaboration.
(3) Regression analysis results. The regression analysis identified secondary industry output as the primary driver of industrial wastewater discharges, with higher output correlating directly with increased discharges. For example, industrial hubs like Jiangsu and Shandong exhibited strong links between industrial activity and discharge levels. In contrast, GDP per capita was negatively correlated with discharges, supporting the EKC hypothesis by indicating reduced pollution at higher economic development stages. Urbanization rate and population density showed minimal impacts, likely due to the advanced wastewater treatment systems in highly urbanized areas. However, as urbanization expands in the central and western regions, ensuring effective wastewater management will be crucial to avoid replicating the high-discharge patterns seen in the east.
To reduce industrial wastewater discharge, this study recommends a comprehensive strategy that involves optimizing the industrial structure, prioritizing technological innovation, strengthening regulatory oversight, and enhancing regional coordination. Reducing the reliance on high-polluting industries by decreasing the share of secondary industries in GDP while expanding the tertiary sector can also lower the overall environmental burden. Advancing wastewater treatment technologies and resource recovery methods, especially in heavily polluting sectors, will further improve treatment efficiency and reduce discharge.
Regulatory oversight should be intensified, with stricter enforcement of environmental protection policies in high- discharge areas such as eastern and southern China. Furthermore, the central and western regions need to accelerate their development of environmental protection infrastructure to mitigate the environmental impact of ongoing industrialization. Inter-regional collaboration is essential for managing transboundary environmental challenges and ensuring sustainable development across the provinces.
These measures aim to achieve the dual objective of controlling industrial wastewater discharge while supporting economic growth. The findings of this study provide actionable insights for policymakers in China and other developing countries who strive to address industrial wastewater challenges in a sustainable and equitable manner.
[1]
Brajer V, Mead R W, Xiao F. 2008. Health benefits of tunneling through the Chinese Environmental Kuznets Curve (EKC). Ecological Economics, 66(4): 674-686.

[2]
Bu Y, Wang E, Jiang Z. 2021. Evaluating spatial characteristics and influential factors of industrial wastewater discharge in China: A spatial econometric approach. Ecological Indicators, 121: 107219. DOI: 10.1016/j.ecolind.2020.107219.

[3]
Chen M, Chen H. 2021. Spatiotemporal coupling measurement of industrial wastewater discharge and industrial economy in China. Environmental Science and Pollution Research, 28: 46319-46333.

[4]
Chen W, Yan W. 2022. The impact of metal waste imports on industrial wastewater discharge in China. Frontiers in Environmental Science, 10: 911497. DOI: 10.3389/fenvs.2022.911497.

[5]
Cheng J, Dai S, Ye X. 2016. Spatiotemporal heterogeneity of industrial pollution in China. China Economic Review, 40: 179-191.

[6]
Cheng J, Zou R, Wang H, et al. 2022. How does China’s industrial wastewater shadow price evolve? The perspective of spatiotemporal characteristics and differences decomposition. Environmental Science and Pollution Research, 29(20): 30363-30382.

[7]
Cheniti H, Cheniti M, Brahamia K. 2021. Use of GIS and Moran’s I to support residential solid waste recycling in the city of Annaba, Algeria. Environmental Science and Pollution Research, 28: 34027-34041.

[8]
Dufatanye I, Lee Y, Kim H, et al. 2022. Industrial wastewater discharge and compliance investigation for environmentally resilient Rwanda. Water, 14(19): 3100. DOI: 10.3390/w14193100.

[9]
Elhorst J P, Fréret S. 2009. Evidence of political yardstick competition in France using a two-regime spatial Durbin model with fixed effects. Journal of Regional Science, 49(5): 931-951.

[10]
Farzadkia M, Jorfi S, Nikzad M, et al. 2020. Evaluation of industrial wastes management practices: Case study of the Savojbolagh industrial zone, Iran. Waste Management & Research, 38(1): 44-58.

[11]
Fernández-Fernández M I, Martín de la Vega P T, Jaramillo-Morán M A. 2019. Pollution and sustainability indices for small and medium wastewater treatment plants in the southwest of Spain. Water, 11(3): 543. DOI: 10.3390/w11030543.

[12]
Geng Y, Wang M, Sarkis J, et al. 2014. Spatial-temporal patterns and driving factors for industrial wastewater emission in China. Journal of Cleaner Production, 76: 116-124.

[13]
Guo H, Zhou F, Zhang Y, et al. 2022. Quantitative analysis of sulfur dioxide emissions in the Yangtze River Economic Belt from 1997 to 2017, China. International Journal of Environmental Research and Public Health, 19(17): 10770. DOI: 10.3390/ijerph191710770.

[14]
Hata A, Shirasaka Y, Ihara M, et al. 2021. Spatial and temporal distributions of enteric viruses and indicators in a lake receiving municipal wastewater treatment plant discharge. Science of the Total Environment, 780: 146607. DOI: 10.1016/j.scitotenv.2021.146607.

[15]
Hu J L, Lee Y C. 2008. Efficient three industrial waste abatement for regions in China. The International Journal of Sustainable Development and World Ecology, 15(2): 132-144.

[16]
Jiang B, Zheng J, Qiu S, et al. 2014. Review on electrical discharge plasma technology for wastewater remediation. Chemical Engineering Journal, 236: 348-368.

[17]
Kuznets S. 1955. Economic growth and income inequality. American Economic Review, 45(1): 1-28.

[18]
Liu S, Liu X, Ma B, et al. 2022. Analysis on the pattern and driving factors of industrial wastewater discharge in the Wuhan Metropolitan Area. Journal of Water and Climate Change, 13(6): 2490-2503.

[19]
Liu X, Guo W. 2023. Dynamic nonlinear effects of urbanization on wastewater discharge based on inertial characteristics of wastewater discharge. Science of the Total Environment, 904: 166514. DOI: 10.1016/j.scitotenv.2023.166514.

[20]
Luo A, Fang H, Xia J, et al. 2017. Mapping potentials of low-grade industrial waste heat in Northern China. Resources, Conservation and Recycling, 125: 335-348.

[21]
Ma B, Tian G, Kong L. 2020. Spatial-temporal characteristics of China’s industrial wastewater discharge at different scales. Environmental Science and Pollution Research, 27: 8103-8118.

[22]
Musakwa W, Van Niekerk A. 2014. Monitoring urban sprawl and sustainable urban development using the Moran Index: A case study of Stellenbosch, South Africa. International Journal of Applied Geospatial Research, 5(3): 1-20.

[23]
Pan X, Guo S, Li M, et al. 2021. The effect of technology infrastructure investment on technological innovation—A study based on the spatial Durbin model. Technovation, 107: 102315. DOI: 10.1016/j.technovation.2021.102315.

[24]
Peng L, Deng X, Li Z. 2023. An extended input-output analysis of links between industrial production and water pollutant discharge in the Yangtze River Economic Belt. Journal of Cleaner Production, 390: 136115. DOI: 10.1016/j.jclepro.2023.136115.

[25]
Shen Z. 2020. Coordinated environment and economy in coastal development based on industrial wastewater and SO2 emissions. Journal of Coastal Research, 109(SI): 13-18.

[26]
Šipuš I, Štrkalj A, Glavaš Z. 2012. Removal of Cr (VI) ions from aqueous solution using foundry waste material: Kinetic and equilibrium studies. Canadian Metallurgical Quarterly, 51(4): 413-418.

[27]
Song C, Chen Y, Yin G, et al. 2023. Spatial correlation and influencing factors of industrial agglomeration and pollution discharges: A case study of 284 cities in China. Environmental Science and Pollution Research, 30(1): 434-450.

[28]
Sun X, Chen Z, Shi T, et al. 2022. Influence of digital economy on industrial wastewater discharge: Evidence from 281 Chinese prefecture-level cities. Journal of Water and Climate Change, 13(2): 593-606.

[29]
Tian G, Xia Q, Wu Z, et al. 2022. Ecological network analysis of industrial wastes metabolism based on input-output model for Jiangsu, China. Waste Management, 143: 23-34.

DOI PMID

[30]
Wang F, Wang R, He Z. 2021a. The impact of environmental pollution and green finance on the high-quality development of energy based on spatial Dubin model. Resources Policy, 74: 102451. DOI: 10.1016/j.resourpol.2021.102451.

[31]
Wang H, Cui H, Zhao Q. 2021b. Effect of green technology innovation on green total factor productivity in China: Evidence from spatial Durbin model analysis. Journal of Cleaner Production, 288: 125624. DOI: 10.1016/j.jclepro.2020.125624.

[32]
Xiang Y, Shao W, Wang S, et al. 2022. Study on regional differences and convergence of green development efficiency of the chemical industry in the Yangtze River Economic Belt based on gray water footprint. International Journal of Environmental Research and Public Health, 19(3): 1703. DOI: 10.3390/ijerph19031703.

[33]
Yang H, Zhou Y, Abbaspour K C. 2010. An analysis of economic growth and industrial wastewater pollution relations in China. Consilience, (4): 60-79.

[34]
Zhang C, Quan B, Tang J, et al. 2023. China’s wastewater treatment: Status quo and sustainability perspectives. Journal of Water Process Engineering, 53: 103708. DOI: 10.1016/j.jwpe.2023.103708.

[35]
Zhang P, Yang D, Zhang Y, et al. 2020. Re-examining the drive forces of China's industrial wastewater pollution based on GWR model at provincial level. Journal of Cleaner Production, 262: 121309. DOI: 10.1016/j.jclepro.2020.121309.

[36]
Zhao P, Zeng L, Lu H, et al. 2020. Green economic efficiency and its influencing factors in China from 2008 to 2017: Based on the super-SBM model with undesirable outputs and spatial Dubin model. Science of the Total Environment, 741: 140026. DOI: 10.1016/j.scitotenv.2020.140026.

Outlines

/