Human Activities and Sustainable Development

Coupling Characteristics between Ecological Security and High-quality Economic Development in the Yangtze River Delta, China

  • HUANG Muyi , 1, 2, 3 ,
  • GUO Qin , 4, * ,
  • TANG Yuru 4 ,
  • WU Xue 1 ,
  • DING Yixuan 1
Expand
  • 1. School of Environment and Energy Engineering, Anhui Jianzhu University, Hefei 230601, China
  • 2. Anhui Provincial Key Laboratory of Environmental Pollution Control and Resource Reuse, Hefei 230601, China
  • 3. Anhui Institute of Ecological Civilization, Hefei 230601, China
  • 4. School of Architecture and Urban Planning, Anhui Jianzhu University, Hefei 230601, China
* GUO Qin, E-mail:

HUANG Muyi, E-mail:

Received date: 2024-11-03

  Accepted date: 2025-01-12

  Online published: 2025-05-28

Supported by

Philosophy and Social Science Planning Key Project of Anhui Province(AHSKD2023D039)

Key Science and Technology Projects under the Science and Technology Innovation Platform(202305a12020039)

Abstract

The coordinated development of ecological security (ES) and high-quality economic development (HQED) is of great significance to the integrated sustainable development of the Yangtze River Delta (YRD) urban agglomeration. In this study, the entropy weight-TOPSIS model and the improved coupling coordination degree (CCD) model were used to analyze the coupling coordination mechanism of ES and HQED. The results indicate that the level of ES in the YRD showed a fluctuating upward trend from 0.475 in 2000 to 0.481 in 2020, while HQED continued to rise from 0.097 in 2000 to 0.232 in 2020, and the coordinated development index of ES and HQED increased from 0.293 in 2000 to 0.795 in 2020, highlighting an obvious trend of balanced development. Notably, the eastern coastal cities exhibited superior HQED and ES levels, with a better CCD, compared to the inland cities. The multi-scale geographically weighted regression model (MGWR) analysis shows that industrial structure, production efficiency and urbanization rate were key factors in the imbalanced development of the YRD. Finally, policy suggestions are proposed from the aspects of strengthening technological and industrial innovation and comprehensively promoting new urbanization.

Cite this article

HUANG Muyi , GUO Qin , TANG Yuru , WU Xue , DING Yixuan . Coupling Characteristics between Ecological Security and High-quality Economic Development in the Yangtze River Delta, China[J]. Journal of Resources and Ecology, 2025 , 16(3) : 603 -617 . DOI: 10.5814/j.issn.1674-764x.2025.03.001

1 Introduction

High-level protection of the ecological environment and high-quality socio-economic development are important elements of sustainable development (Xie et al., 2020). Exploring the coordinated development mechanism of ecological security (ES) and high-quality economic development (HQED) is a concrete step in implementing the national major strategy, with the aim of improving the regional socio- economic development level under the premise of protecting the ecological environment. The Yangtze River Delta (YRD) region, a coastal economic open area, is the strongest economic center in China and has an important impact on the strategic layout of China’s long-term development (Shao et al., 2017). The socioeconomic status of the YRD has experienced significant growth over the past two decades. In 2021, the GDP of the YRD region accounted for 24.1% of the national GDP, accelerating its trajectory to become a robust economic growth pole. The integrated development within the YRD constitutes a pivotal aspect of the “14th Five-Year Plan (2021-2025)” for Jiangsu, Zhejiang, and Anhui provinces, as well as Shanghai city. However, studies have revealed that urban development in the YRD has led to negative ecological effects that severely impact ecosystem function (Ma et al., 2022). In the past 20 years, the ecosystem health index of the YRD region has declined by 17.6% (Ou et al., 2018). Regional ES serves as a cornerstone for sustainable development (Wang et al., 2007), and high-quality development of the YRD with ecological priority and green development as the orientation is needed in these times. Investigating the interaction mechanisms between ecological and economic systems holds significance for achieving high-quality and sustainable synergistic development in cities. ES contributes substantially to theories and methodologies in territorial and spatial planning and ecological restoration (Wu et al., 2020). However, our understanding of ecosystem change processes remains inadequate. Therefore, systematic research on the coupling relationship between ES and HQED, which can harmonize the regional development contradictions, is of significant theoretical and practical importance to the sustainable synergistic development of urban agglomerations.
In the context of China’s path to modernization, topics such as the mechanisms of high-quality development (Chen et al., 2021; Liu et al., 2024), green urbanization, and coordinated development (Liao et al., 2019; Wang et al., 2021; Chen et al., 2022) have gained prominence. ES and economic development are perceived as complementary dualistic systems, with HQED representing an advanced stage of economic development, while ES denotes an environment where the survival and development of human society face minimal threats (Xiao et al., 2004). The relationship between ecological security and economic development has garnered significant scholarly attention. One approach is to take system coordination as an entry point for exploring the coupling relationship between different systems, which mainly includes three aspects: the economic-resource-environment system (Hui and Guo, 2019), the economic-social-environment system (Weng et al., 2022), and the economic-social-ecological system (Liu et al., 2022). Another important area of research involves examining the relationship between urbanization and ecosystems in terms of coordinated development (Ma and Tang, 2022; Yang and Niu, 2022). In terms of measurement methods, scholars from various disciplines have used different methodologies to evaluate the interdependent coordination between ecosystems and the socioeconomic system. Research methods have progressed from simple indicator evaluation systems to complex mathematical and theoretical models, and the Environmental Kuznets Curve (EKC) theory and the coupling coordination degree (CCD) model are the most widely used. Moreover, the focus has broadened from individual administrative regions to trans-administrative scopes.
Research on the relationship between ecological security and economic development is now relatively abundant. These studies indicate that the systematic coordination of the ecological environment and socio-economy is essential for sustainable urban development. However, several shortcomings persist in the current research. First, contemporary research primarily emphasizes the analysis of coupling dynamics between ecological environmental quality and economic development, while insufficiently addressing the safety concerns of ecological systems and the context of high-quality development in China. Second, most research focuses on singular scales while neglecting multi-scale analyses, thereby limiting the conclusiveness of the findings. In summary, many contemporary studies on ES and economic development exhibit a unilateral approach, lacking both theoretical and empirical analyses within a unified framework. In addition, research on ecological protection and economic development lacks spatial matching patterns and precise detection analysis. Therefore, situated within the context of China’s economic transformation towards high-quality development, this study examines the coupling and coordination between ES and HQED in urban agglomerations. It also explores the intrinsic driving mechanisms and evolutionary patterns of their coordinated development, with the aim of achieving a win-win outcome for both ES and HQED in the YRD. Moreover, it seeks to provide a theoretical foundation for the sustainable and coordinated development of these agglomerations.

2 Study area and methods

2.1 Study area

The YRD boasts China’s most extensive river network, comprising over 200 lakes (Zhang et al., 2022), and it is composed of 26 municipalities spanning Jiangsu, Zhejiang, Shanghai, and Anhui (Figure 1). This region is characterized by abundant water systems, primarily consisting of flat plains. The YRD region is positioned as a coastal economic hub and stands as the foremost economic nucleus of China, significantly influencing the country’s long-term developmental strategy. Rapid urbanization and industrialization are underway, particularly in the eastern part of the Delta, where economic advancement is more pronounced than in its western counterpart. The rapid economic progress in the YRD region has resulted in heightened ecological and environmental vulnerability, which has made it a new focal point of environmental susceptibility in China.
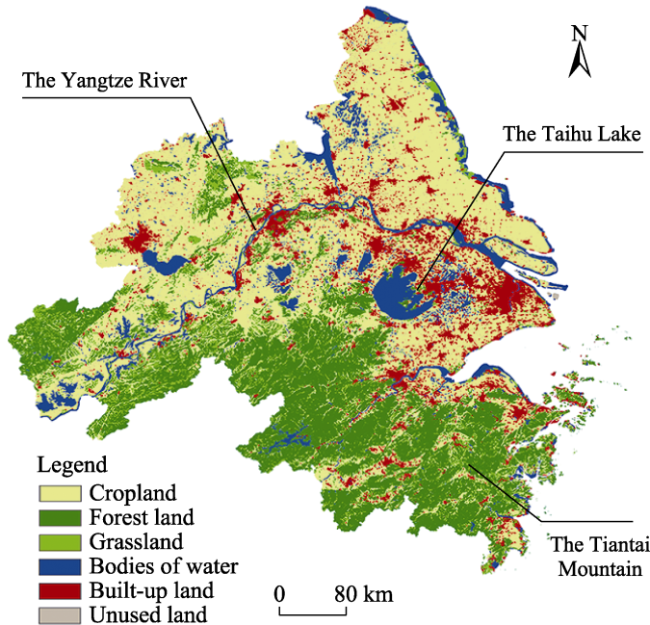
Figure 1 Location and land use types of the Yangtze River Delta

2.2 Research methodology

2.2.1 Data sources and processing

The data were mainly obtained from the statistical yearbooks. Normalization techniques were employed to standardize the raw statistical data, and linear interpolation methods were applied to estimate missing values.

2.2.2 Construction of the evaluation index system

A sustainable development strategy provides theoretical guidance for ES and HQED, while ES and HQED are the fundamental pillars of sustainable development. ES guarantees the health and stability of ecosystems, thereby providing essential environmental conditions for sustainable development, while HQED provisions social capital and power to provide the material basis for sustainable development. The coupled development of ES and HQED will play an important role in the realization of China’s 2030 Sustainable Development Strategy (Figure 2). On this basis, an evaluation system for ES and HQED was constructed (Table 1). Notably, the regional ES subsystem employs the PSR model (Ye and Rey, 2013; Wen et al., 2020; Shan et al., 2022; Shao et al., 2022; Lu et al., 2023) structured across three dimensions: pressure, state, and response. For the HQED subsystem, the report of the 19th National Congress of China stated that HQED has become the dominant force in China’s economic development, consequently, referring to the relevant domestic and international literature (Huang and Ye, 2022; Wang et al., 2022; Wei et al., 2023; Yin et al., 2023). The construction of the evaluation index system of HQED was based on the five dimensions of the concept of HQED.
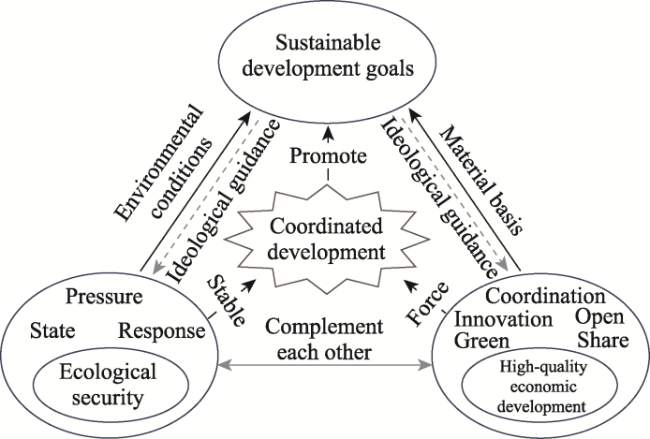
Figure 2 Pathway to sustainable development in the YRD
Table 1 ES and HQED evaluation system for the Yangtze River Delta
System Target level Indicator layer Type Weight
ES evaluation
indicator system
Pressure A1 Population density - 0.013
A2 Natural population growth rate - 0.088
A3 Industrial wastewater discharge - 0.011
A4 Industrial fumes and dust emissions - 0.032
A5 Industrial sulphur dioxide emissions - 0.007
State A6 Road land per capita in the city + 0.148
A7 Park land per capita + 0.095
A8 GDP per capita + 0.276
A9 Share of secondary sector output in GDP - 0.058
A10Green coverage rate of built-up area + 0.025
Response A11 Share of tertiary sector output in GDP + 0.117
A12 Comprehensive utilization rate of general industrial solid waste + 0.037
A13 Centralized treatment rate of sewage treatment plants + 0.048
A14 Treatment rate of living waste + 0.045
HQED evaluation indicator system Innovation B1 Expenditure on science and technology + 0.175
B2 Expenditure on education + 0.146
B3 Patent grants + 0.107
Coordination B4 Ratio of primary sector output to secondary sector output + 0.062
B5 Ratio of primary sector output to tertiary sector output + 0.088
B6 Urbanization ratio + 0.013
Green B7 Energy consumption per unit of GDP 0.002
B8 Power consumption per unit of GDP 0.005
B9 Air quality compliance rate + 0.012
B10 Landscaping coverage + 0.006
Open B11 Actual amount of utilized foreign capital + 0.106
B12 Total foreign trade imports and exports + 0.163
Share B13 Thousands of hospital beds per capita + 0.041
B14 Average wage of employed workers + 0.053
B15 Urban registered unemployment rate 0.022

Note: “-” indicates negative indicators and “+” indicates positive indicators.

2.2.3 Entropy weighting

(1) Standardized treatment of evaluation indicators
Given the different roles and varying magnitudes of the evaluation indicator data, the evaluation indicators were first standardized to their extreme values (Wen et al., 2022).
For positive indicators:
Y i j = X i j min X i j max X i j min X i j + 0.00001
For negative indicators:
Y i j = max X i j X i j max X i j min X i j + 0.00001
where Xij is the indicator before standardization, max X i jis the maximum value in the j-th index of the i-th evaluation object, minXij is the minimum value in the j-th index of the i-th evaluation object, and Yij denotes the standardized indicator data.
(2) Entropy method for determining indicator weights
The entropy method was used to assess the system indicators scientifically and determine the indicator weights. The procedural steps are outlined below:
g j = 1 e j
W j = g j j = 1 m g j
where ej is the entropy; gj is the coefficient of variation; Wj is the weight; i is the evaluation object, and j is the indicator.

2.2.4 Ecological safety evaluation model

This study introduced the entropy weight-TOPSIS model to assess the ES. The normalization matrix serves as a fundamental component in the TOPSIS evaluation framework, and it is primarily employed to distinguish between superior and inferior evaluation targets. This is achieved by determining the distance of each evaluation index within defined intervals, enabling the calculation of proximity to the ideal solution (Li et al., 2018). Subsequently, the TOPSIS approach was employed to calculate the closeness C, resulting in more precise and reasonable outcomes.
Z = Z i j m × n = Y i j × W j
where Yij is obtained from equations (1) and (2); Wj is weight, i=1, 2, , m, and j=1, 2, , n. The Z+ and Z- in the evaluation metrics were selected from the normalized evaluation matrix Z:
Z j + = max Z i j i = 1 , 2 , 3 , , m
Z j = min Z i j i = 1 , 2 , 3 , , m
where max Z i jis the maximum value of the normalized matrix Z, and min Z i jis the minimum value of the normalized matrix Z.
The Euclidean-weighted distances and relative proximity were calculated as:
D i + = j = 1 n Z i j Z j + 2
$D_{i}^{-}=\sqrt{\sum_{j=1}^{n}\left(Z_{i j}-Z_{j}^{-}\right)^{2}}$
where D i +and D i are the Euclidean distances of the positive and negative ideal solutions.
The relative fit was then calculated from the above equations:
C i = D i D i + + D i
where the value of Ci is between 0 and 1, and the ES is categorized into five levels according to the closeness C (Xie et al., 2023) (Table 2).
Table 2 Ecological security evaluation level of the Yangtze River Delta
Safety Unsafe Relatively unsafe Moderately safe Relatively safe Safe
Ci (0, 0.2] (0.2, 0.4] (0.4, 0.6] (0.6, 0.8] (0.8, 1]
Level V IV III II I

2.2.5 Calculation of HQED

The HQEDI synthetic index was calculated as follows:
F i = j = 1 15 W j × Y i j
where Fi represents the HQEDI of the i-th evaluation unit, Wj denotes the weight of the j-th evaluation indicator, and Yij is the data normalized for the indicator, which is obtained from equations (1) and (2).

2.2.6 Improved CCD model

The CCD model assesses the degree of interdependence among systems and the beneficial cyclic relationships inherent in system coordination. However, the conventional CCD model lacks sufficient validity and has other shortcomings. Therefore, this study drew on related studies and enhanced the differentiation of the coupling degree (C) value by distributing it in the range of 0 to 1 (Wang et al., 2021).
C = 1 i > j , j = 1 n U i U j 2 m = 1 n 1 m × i = 1 n U i max U i 1 n 1
T = i = 1 n a i × U i , i = 1 n a i = 1
D = C × T
where C is the coupling degree, Ui and Uj are ESI and HQEDI, m is the adjustment factor, T is the integrated development index, a iis the weight, the D-values such as (0, 0.1], (0.1, 0.2], (0.2, 0.3], (0.3, 0.4], (0.4, 0.5], (0.5, 0.6], (0.6, 0.7], (0.7, 0.8], (0.8, 0.9] and (0.9, 1] represent high dysfunctionality, severe dysfunctionality, moderate dysfunctionality, mild dysfunctionality, verging on dysfunctionality, minimal coordination, primary coordination, moderate coordination, good coordination, and high-quality coordination (Dong et al., 2023).

2.2.7 MGWR model

The multi-scale geographically weighted regression model (MGWR) model, derived from the geographically weighted regression (GWR) model, incorporates variations across diverse spatial scales, integrates spatially stationary variables, and assigns distinct bandwidths to independent variables to capture varying scales of influence on the dependent variable. This study used MGWR to explore the driving mechanism of ES-HQED system development in the YRD, as shown in equation (15):
Y i = β 0 u i , v i + j = 1 k β b w j u i , v i x i j + ε i
where Yi is the dependent variable; β0 is the intercept; xij is the independent variable; (ui, vi) is the coordinates of the center of gravity; εi is the chance error; k is the number of spatial units involved in the analysis; and βbwj(ui, vi) is the local regression coefficient.

2.2.8 Technical roadmap

This study focused on the YRD urban agglomeration and conducted a comprehensive assessment of ES and HQED, aiming to explore the driving mechanism of sustainable development. The technical roadmap of this study is shown in Figure 3.
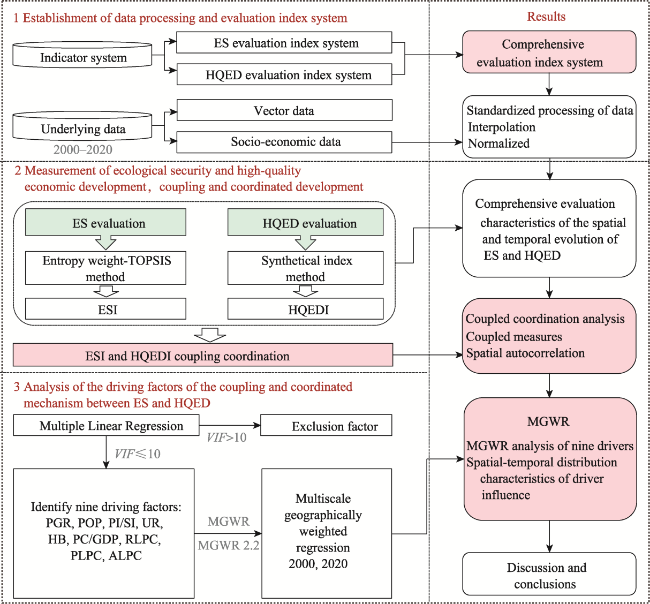
Figure 3 Technical roadmap of this study

3 Results and analysis

3.1 Comprehensive evaluation

3.1.1 ES evaluation

As shown in Figure 4, The ES level exhibited frequent fluctuations from 2000 to 2020, but it displayed an overall wave-like upward trend, with the mean ESI value increasing from 0.475 in 2000 to 0.481 in 2020. Concurrently, the disparities in ES levels among prefecture-level cities declined, with the east-central YRD exhibiting a higher ESI than the western region, indicating an improvement in the regional ES landscape. The ESI for the YRD region increased from 0.239 in 2000 to 0.701 in 2020, enabling the classification of the 26 prefectural-level cities into three tiers based on safety levels: relatively unsafe, moderately safe, and relatively safe, as per the ES evaluation criteria. This differentiation reveals significant variations in the evolutionary pattern of ES among these cities. Notably, cities classified at the safe level include Nanjing, Wuxi, Suzhou, and Shanghai, indicating their superior ecological development and favorable ecological conditions. In contrast, cities deemed less safe are mainly concentrated in Anhui Province. The main factor behind this is rapid urbanization that resulted in increasing pollution emissions and extensive construction activities, which exert significant pressure on the urban ecological environment. During the study period, only Shanghai, Nanjing, Wuxi, Suzhou, Zhenjiang, and Ningbo reached a moderate level of ES. None of the cities had ES levels classified as either unsafe or safe.
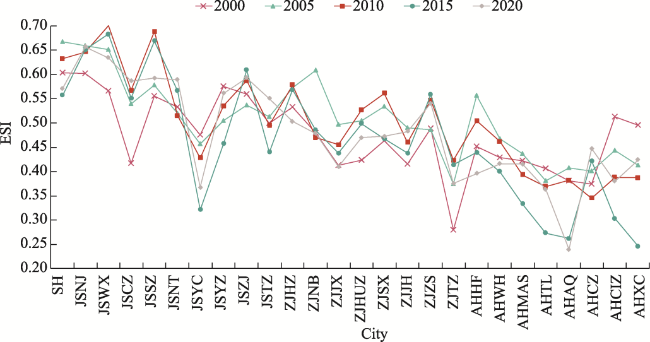
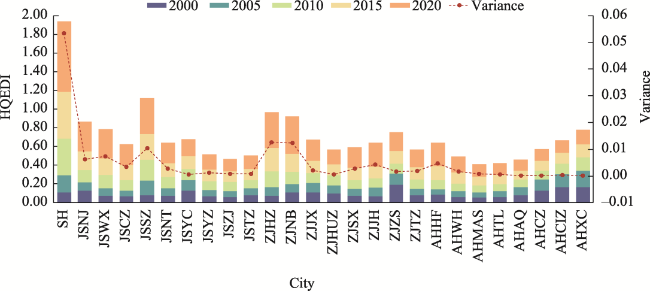
Figure 4 Comprehensive evaluation of the ES level

Note: SH=Shanghai; JSNJ=Nanjing City in Jiangsu; JSWX=Wuxi City in Jiangsu; JSCZ=Changzhou City in Jiangsu; JSSZ=Suzhou City in Jiangsu; JSNT=Nantong City in Jiangsu; JSYC=Yancheng City in Jiangsu; JSYZ=Yangzhou City in Jiangsu; JSZJ=Zhenjiang City in Jiangsu; JSTZ=Taizhou City in Jiangsu; ZJHZ=Hangzhou City in Zhejiange; ZJNB=Ningbo City in Zhejiang; ZJJX=Jiaxing City in Zhejiang; ZJHUZ=Huzhou City in Zhejiang; ZJSX=Shaoxing City in Zhejiang; ZJJH=Jinhua City in Zhejiang; ZJZS=Zhoushan City in Zhejiang; ZJTZ=Taizhou City in Zhejiang; AHHF=Hefei City in Anhui; AHWH=Wuhu City in Anhui; AHMAS=Maanshan City in Anhui; AHTL=Tongling City in Anhui; AHAQ=Anqing City in Anhui; AHCZ=Chuzhou City in Anhui; AHCIZ=Chizhou City in Anhui; AHXC=Xuancheng City in Anhui. The same below.

3.1.2 HQED evaluation

The results of the YRD from 2000 to 2020 are shown in Figure 5, based on the calculation of the comprehensive HQED subsystem index. Note that the mean value of HQEDI increased from 0.097 to 0.232. Overall, the standard error of the HQEDI exhibits an ascending trend, with Zhejiang recording the highest value, Jiangsu following closely, and Anhui demonstrating the lowest standard error. However, note that Shanghai was excluded from this comparison due to its status as a special provincial administrative region, thus highlighting significant inter-provincial discrepancies. Furthermore, the degree of dispersion of HQEDI among Zhejiang Province's prefectural-level cities surpasses those of Jiangsu and Anhui. As illustrated in Figure 6, Shanghai, Hangzhou, and Ningbo exhibited the most rapid average HQEDI growth rates from 2000 to 2020, at 10.6%, 9.1%, and 7.1%, respectively. These findings underscore the superior and more rapid development of coastal cities, as evidenced by their higher HQEDI growth rates compared to their inland counterparts. At the provincial level, the average annual growth rates of HQEDI in Shanghai, Zhejiang, Jiangsu and Anhui were 10.6%, 5.4%, 4.9% and 2.1%, respectively, so the coastal cities generally exhibit higher HQEDI levels and growth rates. The YRD metropolitan area is a pivotal driver of China’s economic progress, with Shanghai at the forefront of this development. While the influence of Shanghai radiates throughout the entire YRD region, the cities closer to Shanghai benefit from a stronger pull effect, resulting in higher economic vitality and more favorable assessments of HQED.
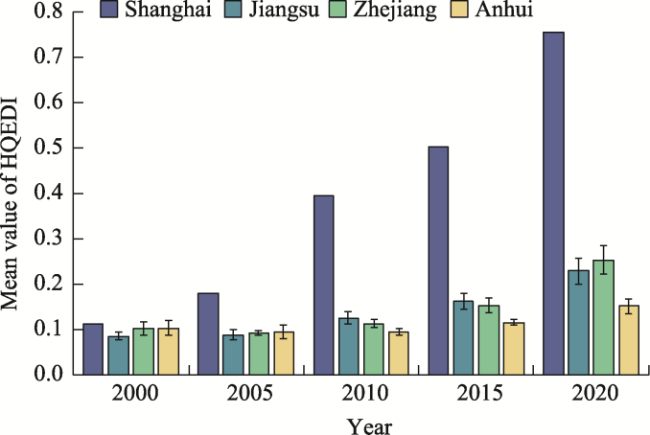
Figure 5 The means and standard errors of HQEDI
Figure 6 Results of the evaluation of HQED

3.1.3 Comparative analysis of ES and HQED

The comparative analysis of the ESI and HQEDI depicted in Figure 7 reveals frequent fluctuations from 2000 to 2020. These fluctuations are generally characterized as “lagging ESI-synchronous development-lagging HQEDI.” For example, from 2000 to 2005, Shanghai experienced simultaneous increases in both ESI and HQEDI, while from 2010 to 2020, they exhibited synchronous development trends. Overall, ESI displays a fluctuating upward trajectory, whereas HQEDI demonstrates a consistent upward trend. In terms of timing, ESI consistently outpaced HQEDI until 2010, after which ESI began to lag. This indicates a shift in the focus of development within the YRD urban agglomeration. In the early period, there was a strong emphasis on economic development, but this then shifted toward a more balanced approach.
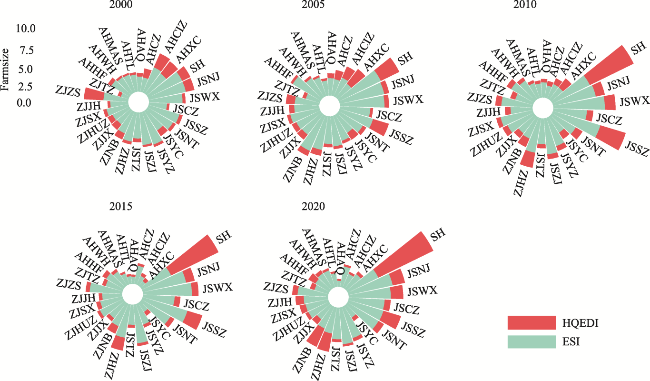
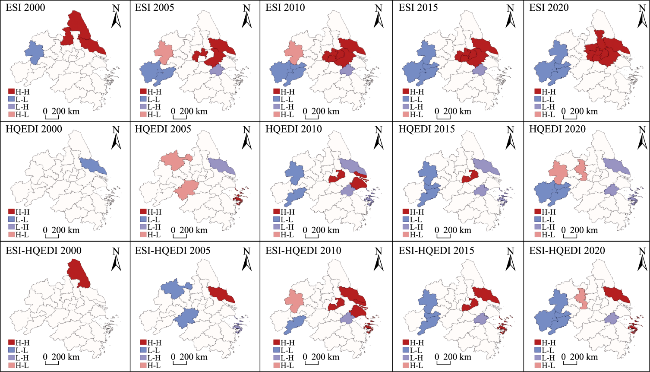
Figure 7 Comprehensive evaluation of ESI and HQEDI

3.2 Patterns and spatial heterogeneity

3.2.1 Results of CCD between ES and HQED

The YRD coordination index increased from 0.293 (moderate dysfunctionality) in 2000 to 0.795 (moderate coordination) in 2020 (Table 3 and Figure 8). At the interprovincial level, Shanghai exhibited the highest coupling coordination level between ES and HQED, followed by Zhejiang, Jiangsu, and Anhui. As the economic core of the YRD metropolitan area, Shanghai benefits from ample economic development resources and ecological protection capacity, which fosters coordinated development between its economic system and ecosystem. Similarly, as pivotal cities in the YRD metropolitan area with superior ecological resources and a more developed economy, Zhejiang and Jiangsu achieve relatively coordinated levels between their ecological and economic systems. Conversely, Anhui’s overall ecological resources and economic development capacity are comparatively weaker within the YRD metropolitan area, indicating the need for enhanced coordinated development efforts. At the prefecture level, (Taizhou, Zhejiang), Changzhou, Maanshan, Jinhua, and Hangzhou demonstrated the highest average growth rates of 17.62%, 7.40%, 5.67%, 5.37%, and 5.34%, respectively. Furthermore, Shanghai had achieved a high-quality coordination level by 2020, reaching a D-value of 0.94.
Table 3 The coupled coordination index of ESI and HQEDI
Year Coupling C-value D-value Level of coordination Degree of coupling coordination
2000 0.581 0.293 3 Moderate dysfunctionality
2005 0.199 0.315 4 Mild dysfunctionality
2010 0.793 0.651 7 Primary coordination
2015 0.289 0.260 3 Moderate dysfunctionality
2020 0.907 0.795 8 Moderate coordination
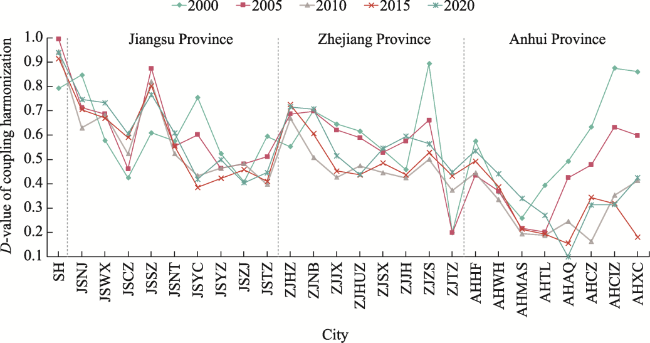
Figure 8 Degree of coupling coordination between ESI and HQEDI

3.2.2 Spatial heterogeneity characteristics

The GeoDa software was employed to conduct a local Moran’s I analysis of ESI, HQEDI (univariate), and ESI- HQEDI (bivariate). The results indicate that the ESI had a positive spatial correlation distribution (Table 4). Conversely, HQEDI and ESI-HQEDI (bivariate) exhibited spatial correlation distributions encompassing both positive and negative values. In other words, the spatial distributions of ESI, HQEDI and ESI-HQEDI among the 26 prefectural- level cities do not occur randomly, but show obvious spatial agglomeration or discrete characteristics.
Table 4 Local Moran's I statistical value
Moran’s I 2000 2005 2010 2015 2020
ESI Moran’s I 0.136 0.124 0.319 0.434 0.467
HQEDI Moran’s I -0.011 -0.003 0.104 0.049 0.099
ESI-HQEDI Moran’s I -0.079 0.119 0.241 0.290 0.261
The LISA aggregation maps in Figure 9 illustrate the pronounced spatial agglomeration of ESI and HQEDI within the YRD, primarily characterized by H-H and L-L clusters. The H-H clusters of ESI were mainly distributed in Jiangsu Province, gradually shifting from the northern to southern regions within the study area. The number of cities exhibiting H-H clusters increased from three to six, while the total area increased from 3.16×10⁶ ha to 3.53×10⁶ ha, indicating a trend of expansion. Conversely, the L-L clusters were concentrated in Anhui Province, where the number of cities increased from one to four and the total area expanded from 1.14×10⁶ ha to 3.63×10⁶ ha over the same period. Furthermore, the spatial agglomeration patterns of HQEDI were prominent, and characterized by L-L and L-H clusters. Between 2005 and 2015, the H-H clusters of HQEDI exhibited a gradual shift from the coastal to inland areas. This was accompanied by a lack of change in the number of affected cities but an expansion in the total area from 0.14×10⁶ ha to 0.46×10⁶ ha, indicating a growing influence. Cities with L-L clusters were mainly distributed in Anhui Province, with an increase from one city in 2000 to three cities in 2020, the total area expanding from 0.8×10⁶ ha to 2.49×10⁶ ha, and a shift from a dispersed to centralized distribution.
Figure 9 Spatial autocorrelation clustering results
The study presents a comprehensive analysis of the spatial transfer of ES and HQED coupling coordination levels from 2000 to 2020 (Figure 10), which indicates that the level of coupling coordination improved in 11 cities. Shanghai transitioned from primary coordination to high- quality coordination, and Suzhou progressed from primary coordination to moderate coordination, while Wuxi, Ningbo, and Hangzhou advanced from minimal coordination to moderate coordination, indicating enhanced overall development. However, some cities experienced declines in their coordination levels, notably Chizhou, Xuancheng, and Chuzhou, which exhibited the most significant downward trends that were directly correlated with the fluctuating declines in their levels of HQEDI. Nevertheless, the overall trend indicates positive progress in the degree of coordination throughout the study period.
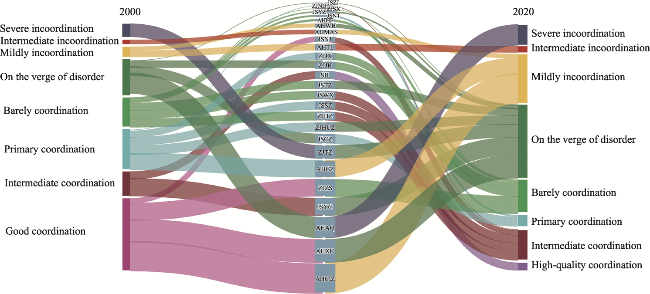
Figure 10 Coupling coordination degree spatial transfer Sankey diagram
The LISA aggregation map of ESI-HQEDI (bivariate) in the YRD (Figure 9) reveals that the H-H clusters of ESI- HQEDI were mainly distributed in Nantong, Zhoushan, Shanghai, and Wuxi. The total area of cities showing this pattern decreased from 1.7×10⁶ ha in 2000 to 0.94×10⁶ ha in 2020. Overall, there was a trend of gradual transition from inland regions to coastal cities. The distribution of L-L clusters was like ES and HQED, with a concentration in Anhui Province. The total area of cities showing this pattern increased by 3.63×10⁶ ha, indicating expansion and a shift toward a more centralized distribution. In contrast, there were no significant spatial distribution characteristics in the H-L clusters or L-H clusters. Coastal cities, such as Nantong, Zhoushan, Shanghai, and Wuxi, primarily exhibited positive synergistic development relationships between ES and HQED, while the western study area demonstrated a negative synergistic development relationship. The presence of a trade-off development relationship was not evident in spatial autocorrelation, necessitating further investigation in subsequent studies.

3.3 Analysis of the driving factors

3.3.1 Model construction and analysis

Multiple Linear Regression (MLR) was used to test the significance of various factors and determine the primary factors influencing the coupling coordination mechanism, and 12 factors that may be related to the CCD index were selected to drive the MGWR model. These factors were grouped into three categories: population, socioeconomic, and ecological quality. The relevant indicators were calculated using the MGWR model (Table 5). The MGWR model fits for 2000 and 2020 were 0.68 and 0.80, respectively, indicating that a driver analysis could be performed.
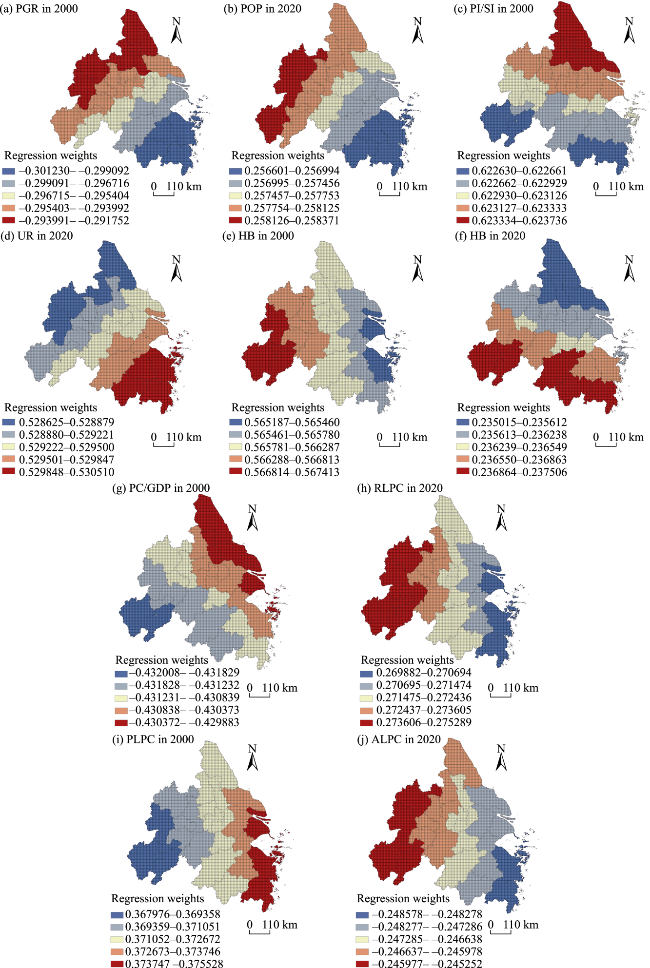
Table 5 Descriptive statistical results of the standardized regression coefficients
System 2000 2020
Variable Mean SD P Variable Mean SD P
Population PGR -0.296 0.002 0.038 POP 0.258 0.001 0.036
Socio-economic PI/SI 0.623 0.000 <0.001 UR 0.529 0.001 0.002
HB 0.566 0.001 0.001 HB 0.236 0.001 0.033
Ecological quality PC/GDP -0.431 0.001 0.009 RLPC 0.272 0.001 0.030
PLPC 0.372 0.000 0.003 ALPC -0.247 0.001 0.010

Note: PGR denotes the natural population growth rate, POP represents population density, PI/SI indicates the ratio of primary sector output to secondary sector output, UR stands for urbanization ratio, HB signifies thousands of hospital beds per capita, PC/GDP denotes power consumption per unit of GDP, RLPC represents road land per capita in the city, PLPC signifies park land per capita, and ALPC indicates arable land per capita.

3.3.2 Mechanism of influence

The spatial distribution of the regression coefficients for each driving factor was obtained by running the MGWR model (Figure 11). The value of a regression coefficient represents the contribution of each explanatory variable to the dependent variable. When the absolute value of a regression coefficient is larger, it indicates that the explanatory variable has a greater contribution to the model and that the explanatory variable has a stronger relationship with the dependent variable (Huang et al., 2020).
Figure 11 Spatial distribution of standardized regression coefficients for the MGWR model
In terms of population factors, the primary factor influencing the coupling coordination mechanism of ES and HQED shifted from PGR in 2000 to POP in 2020, emphasizing the increasing importance of population density in driving the synchronized advancement of ES and HQED within the YRD urban agglomeration. The regression coefficients of PGR are negative (Figure 11a), indicating that the population growth rate has some negative impact on the coupling coordination mechanism of the ES-HQED system. Conversely, POP demonstrates a positive impact across the entire study area (Figure 11b). Its coefficient values range from 0.256 to 0.258, with a similar northwest-to-southeast declining pattern, albeit with greater overall volatility. The elevated values for the PGR and POP regression coefficients are primarily concentrated in Anhui and northern Jiangsu, while the lower values are prevalent in coastal Shanghai and southern Zhejiang.
In terms of socio-economic factors, the main factors shifted from PI/SI and HB in 2000 to UR and HB in 2020. PI/SI has a significant positive effect (Figure 11c), with the greatest effect observed in the Jiangsu region, where coefficient values range from 0.622 to 0.624. In contrast to PI/SI, UR exhibits a spatially decreasing trend in its influence on the coupling coordination mechanism (Figure 11d), and the primary high-value area is situated in southern Zhejiang (0.529 to 0.531). Overall, UR consistently exerted a positive influence on the coupling coordination mechanism of the YRD, which became increasingly significant over the study period. The impacts of HB in both 2000 and 2020 were predominantly positive, promoting positive outcomes in both aspects (Figure 11e, Figure 11f). However, the overall influence demonstrated a declining trend, with the mean coefficient value decreasing from 0.566 in 2000 to 0.236 in 2020. In addition, the high-value area gradually expanded from the Anhui region to the southern part of Zhejiang.
In terms of ecological quality factors, the main influencing factors shifted from PC/GDP and PLPC in 2000 to RLPC and ALPC in 2020, indicating an increasing significance of urban roads and cultivated land elements in the coordinated development of the YRD. In 2000, the PC/GDP had a negative impact on the coordination mechanism (Figure 11g), with the value of the coefficient decreasing from -0.432 to -0.429. Spatially, there is a decreasing trend from north to south, which initially caused damage to the coordinated development of the YRD. The coefficient for PLPC exhibited a range of values between 0.367 and 0.375 (Figure 11i), and showed a notable reduction from the coastal provinces of Shanghai and Zhejiang to the inland province of Anhui, indicating strong spatial heterogeneity. In 2020, RLPC promoted the coordinated development of the ES-HQED system, and the coefficient value increased from 0.269 to 0.275 (Figure 11h), predominantly concentrated in Anhui. Conversely, ALPC had a negative impact on the coordination mechanism in the YRD, with the value of the coefficient increasing from -0.248 to -0.245 (Figure 11j). The negative impact of ALPC was more pronounced in southern Zhejiang due to the larger proportion of cultivated land in Anhui Province. Consequently, this led to lower sensitivity to the negative impacts and hence it caused less damage compared to the situation in southern Zhejiang Province.
The coordination mechanism of the ES-HQED system in the YRD is influenced by various driving factors, which collectively shape their spatiotemporal evolution. Changes in the magnitude of each driving force characterize the coordinated development state. A regression analysis using the MGWR model over the two representative years showed a mean PI/SI coefficient of 0.623 in 2000 and a mean UR of 0.529 in 2020. This suggests that the coordinated development of ES and HQED in the YRD during the study period was affected by a variety of driving factors, with the dominant driver shifting from PI/SI to UR. This shift underscores the significant influence of the urbanization rate on ES and HQED in the YRD.

4 Discussion

This study aimed to reveal the coupling and coordination mechanism of ES and HQED from 2000 to 2020 in the YRD, which will complement previous studies on this topic. The ESI showed an increasing upward trend. Notably, the higher ESI in the eastern region indicates that the eastern part of the YRD has made greater efforts to protect the regional ecological environment in the process of urbanization. Although the YRD experienced rapid HQED between 2000 to 2020, the regional HQED is not balanced, with the eastern coastal areas having a significantly higher HQED, which is consistent with the conclusions drawn by other scholars (Li et al., 2020; Feng et al., 2021). Building upon this foundation, we investigated the coupling coordination relationship between ES and HQED. The results revealed a transformation and development stage, from moderate dysfunctionality in 2000 to moderate coordination in 2020. These results are consistent with previous studies on the interactions between economic systems and ecosystems, indicating an overall moderate level of coordinated development amidst the rapid urbanization and industrialization of China (Lin et al., 2022). The spatiotemporal characteristics of the coordinated development level of the ES-HQED system are similar to previous findings in the YRD region, underscoring significant spatial disparities within the YRD urban agglomeration (Shan and Yang, 2017). This study revealed a joint influence between coastal cities in the eastern YRD and core cities, fostering integration between socioeconomic systems and ecosystem-related production factors (Xue, 2022). The radiating influence of core and coastal cities drives the development of nearby cities, shaping a distinctive spatial distribution pattern.
In 2000, PGR and PC/GDP had negative effects on the ES-HQED system in the YRD. Conversely, PI/SI, HB, and PLPC showed positive correlations with the coupling coordination mechanism. By 2020, ALPC exhibited a significant negative effect, while POP, UR, HB, and RLPC had positive influences. During the study period, the negative impacts shifted from PGR and PC/GDP to ALPC. Moreover, the ALPC coefficient demonstrated a declining trend from western Anhui to eastern Zhejiang, indicating that the detrimental effects of ALPC on the coordinated development of ES and HQED are more pronounced in economically advanced regions compared to economically disadvantaged regions. In the economically advanced regions, the impacts were approximately 1.01 times more severe than in economically disadvantaged regions. Conversely, the positive impacts primarily shifted toward UR, which is closely tied to the swift progress of urbanization in the YRD. Throughout the study period, the primary driver of the coupling coordination mechanism between ES and HQED shifted from PI/SI to UR, highlighting the growing significance of the urbanization ratio in fostering coordinated development within the YRD. This transition has contributed to promoting intensive and well-coordinated development in the YRD.
The YRD urban agglomeration is renowned for its high economic vitality, openness, and innovation capacity in China, and it holds an important strategic position in the nation’s modernization and development. However, robust economic growth has compromised the ecological health of this region. A symbiotic relationship between HQED and ES is essential for achieving sustainable development in urban agglomerations. The primary driver of the ES-HQED system coupling coordination mechanism shifted from PI/SI to UR, highlighting the growing significance of the urbanization ratio in fostering coordinated development within the YRD. An analysis of the results concerning ES and HQED indicates three key considerations that can be considered to promote the sustainable development of the YRD region. The first is population dynamics, as overcrowding is harmful to coordinated development. Hence, the government should implement policies that foster balanced population development and solidly promote a new urbanization strategy focusing on human beings. In the case of Anhui, a province characterized by significant population outflow, land system reforms should be accelerated to facilitate the integration of agricultural migrants into urban citizenship; while for Zhejiang, Jiangsu and Shanghai, regions with large population inflows, the settlement policy should be appropriately lowered to promote the citizenship of the foreign population. Furthermore, the region should prioritize scientific and technological innovation and explore efficient development models centered around specialized industries to enhance its core competitiveness and attract talent. Second, concerning socio-economic aspects, the urbanization rate, industrial structure, and healthcare contribute positively to the coupled coordination mechanism of ES and HQED, with the urbanization rate and industrial structure exerting more pronounced influences. Therefore, vigorously promoting integrated urban and rural planning and industrial upgrading is imperative. Communication and cooperation among different regions should be enhanced to facilitate the efficient flow of various resources. Key resources, including advanced technologies and industries in the eastern region, as well as labor resources in the central region, should be integrated and strategically planned to maximize their utilization. Furthermore, this approach should accelerate industrial transformation and upgrading, develop a strategy for transitioning the economic development model, and promote high-quality economic growth. Finally, regarding ecological quality, both power consumption and arable land area have detrimental effects on coordinated development. A strategy of "increasing income and reducing expenditure" entails reducing reliance on non-renewable energy sources and promoting the development of renewable energy alternatives. The control of arable land should be strictly enforced to prevent the unreasonable occupation of arable land.
In summary, the coordination of ecological and economic development within urban agglomerations is a multifaceted process that requires considering the intricacies and variations in decision-making among the various local governments. This study examined the relationship between ES and HQED in the YRD urban agglomeration, and revealed the intrinsic interaction mechanisms between the regional ecological and economic systems. This approach can help to balance the contradictions between ecological environmental protection and social development, thereby promoting the high-quality development of the YRD urban agglomeration.

5 Conclusions

Ecological and economic systems exhibit intricate interconnections. This study examined the spatiotemporal heterogeneity of ES and HQED, which contributes to advancing a scientific and precise understanding of the underlying basis and mechanisms governing the interactions and coupling between ES and HQED in the YRD of China, thereby aiding in the promotion of regional sustainable development.
The overall ES level of the YRD region has shown positive development from 2000 to 2020. Notably, the areas with high ESI values are predominantly located in Zhejiang, Jiangsu, and Shanghai. The HQEDI demonstrated a consistent upward trend, with Shanghai attaining the highest HQEDI score, followed by Jiangsu, Zhejiang, and Anhui Province. The coordination of the ES-HQED system in the YRD exhibited a normal distribution, transitioning from moderate dysfunctionality in 2000 to moderate coordination in 2020. The coordination level demonstrated a fluctuating upward trend over time, with better coordination in the southeastern part of the YRD. A multitude of factors, including population, socioeconomic, and ecological variables, collectively influence the coupling coordination mechanism of ES-HQED system. The primary driving factor has changed from PI/SI to UR during the study period, suggesting that the urbanization ratio is progressively assuming greater significance in shaping the coupling coordination mechanism of ES and HQED.
In summary, based on an analysis of the coordinated development relationship between ES and HQED in the YRD urban agglomeration, as well as the factors influencing the coupling and matching mechanism of the two, this study proposes a sustainable development strategy of the urban agglomeration in terms of population, socio-economics and ecological quality. This strategy is crucial for the integrated development of the YRD’s ecological and economic systems and will contribute to advancing sustainable regional integrated development. However, this study has several limitations. First, it primarily employed the entropy weight method to objectively assign the indicator system, without accounting for subjective factors. Future research should incorporate the influences of subjective factors in the indicator assignments along with the objective method. Second, the selection of indicators was, to some extent, limited by the availability of data, and thus the indicator system used here may be imperfect and requires further refinement.
[1]
Chen F, Shi H, Chen Q. 2022. Spatio-temporal evolution and influencing factors of coupling coordination degree regarding green urbanization level in Yangtze River Delta. Journal of Central South University of Forestry and Technology (Social Sciences), 16(2): 26-35. (in Chinese)

[2]
Chen W, Sun W, Liu C G, et al. 2021. Regional integration and high-quality development in the Yangtze River Delta region. Economic Geography, 41(10): 127-134. (in Chinese)

DOI

[3]
Dong G L, Ge Y B, Liu J J, et al. 2023. Evaluation of coupling relationship between urbanization and air quality based on improved coupling coordination degree model in Shandong Province, China. Ecological Indicators, 154: 110578. DOI: 10.1016/j.ecolind.2023.110578.

[4]
Feng J H, Zhang L L, Tang M. 2021. Research on coupling coordination in ecology-economy-society system—Taking Shaanxi Province as an example. Chinese Journal of Systems Science, 29(3): 92-96. (in Chinese)

[5]
Huang D P, Ye L. 2022. Comprehensive evaluation of high-quality economic development of cities in the Yellow River Basin. Statistics and Decision, 38(19): 103-106. (in Chinese)

[6]
Huang M Y, Zhong Y, Feng S R, et al. 2020. Spatial-temporal characteristic and driving analysis of landscape ecological vulnerability in water environment protection area of Chaohu Basin since 1970s. Journal of Lake Sciences, 32(4): 977-988. (in Chinese)

[7]
Hui T Y, Guo X. 2019. Measurement of the level of coordinated economic-resource-environmental development in the western region. Statistic and Decision, 35(11): 124-128. (in Chinese)

[8]
Li W W, Yi P T, Zhang D N, et al. 2020. Assessment of coordinated development between social economy and ecological environment: Case study of resource-based cities in Northeastern China. Sustainable Cities and Society, 59: 102208. DOI: 10.1016/j.scs.2020.102208.

[9]
Li Z, He W, Pan H Y, et al. 2018. Dynamic prediction and early warning of cultivated land ecological security in Sichuan Province based on improved TOPSIS method and ARIMA model. Research of Soil and Water Conservation, 25(3): 217-223. (in Chinese)

[10]
Liao M L, Chen Y, Wang Y J, et al. 2019. Study on the coupling and coordination degree of high-quality economic development and ecological environmet in Beijing-Tianjin-Hebei region. Applied Ecology and Environmental Research, 17(5): 11069-11083.

DOI

[11]
Lin Y Z, Peng C, Chen P, et al. 2022. Conflict or synergy? Analysis of economic-social-infrastructure-ecological resilience and their coupling coordination in the Yangtze River Economic Belt, China. Ecological Indicators, 142: 109194. DOI: 10.1016/j.ecolind.2022.109194.

[12]
Liu M Y, Xie H Z, Zhu T. 2024. The impetus for RCEP in facilitating the high-quality development of the tourism service trade in Yunnan Province, China. Journal of Resources and Ecology, 15(4): 966-976.

DOI

[13]
Liu Y B, Kong L Q, Lu F, et al. 2022. Evaluation of ecological-economic-social synergy in urban area of China. Chinese Journal of Applied Ecology, 33(10): 2822-2828. (in Chinese)

[14]
Lu G Z, Pang X Y, Hou J W, et al. 2023. Evaluation and prediction of ecological security in Shizuishan City based on PSR model. Journal of Safety and Environment, 23(10): 3784-3792. (in Chinese)

[15]
Ma C X, Yang R X, Ke X L, et al. 2022. Multi-scale correlation analysis of ecological land use pattern and ecological efficiency under urban expansion. Ecological Science, 41(5): 1-10. (in Chinese)

[16]
Ma M Y, Tang J X. 2022. Interactive coercive relationship and spatio-temporal coupling coordination degree between tourism urbanization and eco-environment: A case study in Western China. Ecological Indicators, 142: 109149. DOI: 10.1016/j.ecolind.2022.109149.

[17]
Ou W X, Zhang L J, Tao Y, et al. 2018. A land-cover-based approach to assessing the spatio-temporal dynamics of ecosystem health in the Yangtze River Delta region. China Population, Resources and Environment, 28(5): 84-92. (in Chinese)

[18]
Shan H Y, Yang J L. 2017. Evolutionary analysis of coupled and coordinated ecological and economic systems in the Yangtze River Delta region. Statistics and Decision, 33(24): 128-133. (in Chinese)

[19]
Shan Y J, Wei S K, Miao Y, et al. 2022. Evaluation of land ecological security in the Yellow River Golden Triangle of Shanxi, Shaanxi and Henan based on PSR-TOPSIS model. Ecological Economy, 38(7): 205-211. (in Chinese)

[20]
Shao S, Tian Z H, Yang L L. 2017. High speed rail and urban service industry agglomeration: Evidence from China’s Yangtze River Delta Region. Journal of Transport Geography, 64: 174-183.

[21]
Shao Y H, Yang D D, Tan C F. 2022. Ecological security evaluation of Gansu section of Weihe River based on DPSIR model. Bulletin of Soil and Water Conservation, 42(3): 166-170. (in Chinese)

[22]
Wang G, Wang L, Wu W. 2007. Ecological security evolvement trend of drinking water source areas along Liaohe River. Chinese Journal of Applied Ecology, 18(11): 2548-2553. (in Chinese)

[23]
Wang S J, Kong W, Ren L, et al. 2021. Research on misuses and modification of coupling coordination degree model in China. Journal of Natural Resources, 36(3): 793-810. (in Chinese)

[24]
Wang Y Y, Li J, Wang Y D, et al. 2022. Regional social-ecological system coupling process from a water flow perspective. Science of the Total Environment, 853: 158646. DOI: 10.1016/j.scitotenv.2022.158646.

[25]
Wei Y H, Wang B S, Zhu L. 2023. Measurement of economic high-quality development level based on spatio-temporal entropy weighted TOPSIS evaluation method—Taking Guangdong Province as an example. Statistics and Decision, 39(8): 91-95. (in Chinese)

[26]
Wen X, Zhu J X, Gao W X. 2020. Empirical analysis on cooperative efficiency of ecological security in nine cities of Guangdong-Hong Kong-Macao Greater Bay Area under the heterogeneous system: Based on PSR and GIS-DEA combined model. Ecological Economy, 36(4): 200-205. (in Chinese)

[27]
Wen Y, Xiao T, Tan S H, et al. 2022. Study on ecological security evaluation and countermeasure of Shanghai based on entropy and catastrophe progression method. Ecological Science, 41(3): 124-132. (in Chinese)

[28]
Weng Q Q, Lian H H, Qin Q D. 2022. Spatial disparities of the coupling coordinated development among the economy, environment and society across China’s regions. Ecological Indicators, 143: 109364. DOI: 10.1016/j.ecolind.2022.109364.

[29]
Wu J S, Luo K Y, Ma H K, et al. 2020. Ecological security and restoration pattern of Pearl River Delta, based on ecosystem service and gravity model. Acta Ecologica Sinica, 40(23): 8417-8429. (in Chinese)

[30]
Xiao R B, Ouyang Z Y, Han Y S, et al. 2004. Evaluation of the ecological safety of Hainan Island. Journal of Natural Resources, 19(6): 769-775. (in Chinese)

[31]
Xie B, Jones P, Dwivedi R, et al. 2023. Evaluation, comparison, and unique features of ecological security in southwest China: A case study of Yunnan Province. Ecological Indicators, 153: 110453. DOI: 10.1016/j.ecolind.2023.110453.

[32]
Xie H Y, Jia Y P, Yang C P. 2020. Path of realizing the coordinated development of ecological civilization and economic construction. Macroeconomic Management, (5): 30-36. (in Chinese)

[33]
Xue Y G. 2022. Research on spatial convergence, dynamic evolution and innovation impact of high quality economic development in urban agglomeration—A comparative analysis of Pearl River Delta and Yangtze River Delta. Management Review, 34(12): 131-145. (in Chinese)

[34]
Yang X Y, Niu F Q. 2022. Spatio-temporal coupling process of urbanization and resource-environmental pressure in Liaoning Province. World Regional Studies, 31(2): 317-328. (in Chinese)

DOI

[35]
Ye X, Rey S. 2013. A framework for exploratory space-time analysis of economic data. The Annals of Regional Science, 50: 315-339.

[36]
Yin P W, Xie P, Lei H Z. 2023. Evaluation and differences analysis on high-quality economic development of national central cities. Economist, (3): 68-78. (in Chinese)

[37]
Zhang Z, Nie T T, Gao Y, et al. 2022. Ecological security assessment and spatio-temporal transition characteristics in the Yangtze River Delta urban agglomeration. Scientia Geographica Sinica, 42(11): 1923-1931. (in Chinese)

DOI

Outlines

/