Ecotourism

Spatiotemporal Evolution Characteristics and Driving Factors of Museums in Beijing

  • WU Liyun , 1, 2, * ,
  • XU Jiayang 1, 2
Expand
  • 1. China Academy of Culture and Tourism, Beijing International Studies University, Beijing 100024, China
  • 2. School of Tourism Science, Beijing International Studies University, Beijing 100024, China
* WU Liyun, E-mail:

Received date: 2024-02-20

  Accepted date: 2024-05-30

  Online published: 2025-03-28

Supported by

The National Social Science Foundation Art Project of China(21BH157)

Abstract

Based on data from Beijing museums spanning 1980 to 2020, this study employs spatial analysis methods such as geographical concentration index, imbalance index, kernel density and standard deviation ellipse characterize the temporal and spatial evolution of Beijing museums and analyze their influencing factors. The research shows that the museum development in Beijing has undergone three stages: a slow start, high-speed development and high-quality upgrading. The development of cultural relics and industrial museums tends towards balance, and the market-oriented development of museums continues to improve. The “single core” concentration distribution of Beijing museums is prominent, showing a typical “center edge” distribution with a trend of new core formation during expansion. Temporally, Beijing museums exhibit an inverted “L” evolution pattern, trending from north to east with Haidian and Chaoyang districts poised to become new centers. Distribution across intervals is uneven, yet the overall pattern is evolving towards a balanced distribution. The research on factors influencing the spatial distribution of museums, including population, resources, economy, and transportation, innovatively introduces educational factors. It shows that Beijing museums are transforming from “population driven” and “resource driven” to “education driven” over time.

Cite this article

WU Liyun , XU Jiayang . Spatiotemporal Evolution Characteristics and Driving Factors of Museums in Beijing[J]. Journal of Resources and Ecology, 2025 , 16(2) : 580 -592 . DOI: 10.5814/j.issn.1674-764x.2025.02.025

1 Introduction

Museums are important carriers of cultural spaces and venues for transmitting a city’s cultural heritage (Li, 2018; Zhang, 2021). Their construction and development reflect the city’s cultural soft power, stimulating public cultural sharing and memory maintenance (Luo, 2017), and shaping the city’s unique cultural lineage. In 2020, the “Medium- and Long-Term Plan for Beijing to Promote the Construction of a National Cultural Center (2019-2035)” was issued, proposing that Beijing evolve into a world historical culture city and a global cultural icon, transforming into a city of museums. As a significant hub for museums, studying the spatio-temporal evolution and driving factors of museums in Beijing can help explore the logic behind their spatial distribution, scientifically guide the rational distribution of museums, enhance their cultural demonstration effect, and provide insights and references for the planning and construction of museums in other cities.
Since 1970, museums worldwide have grown rapidly and undergone new developments (Liu et al., 2021). International research on museums has shifted from supply perspectives, such as museum management (Tufts and Milne, 1999; Griffin et al., 2000), market-oriented operation (Kawashima, 1998; Bradburne, 2001), and value communication (Boukas and Ioannou, 2020), to demand perspectives focusing on visitor experience, perception, and attraction mechanisms (Gil et al., 2019; Araujo et al., 2020). High-quality museum development is also a research highlight, emphasizing heritage preservation, cultural innovation, international diplomacy, brand building, technology application and educational functions (Varvin et al., 2014; Absalyamova et al., 2015; Marek, 2017; Chaney et al., 2018; Braden and Teekens, 2020; Bertacchini et al., 2021; Bovcon, 2021). Domestic scholars began focusing on the relationship between tourism and museums in the late 1980s, viewing museums as tourism resources and exploring the balance between their social benefits and the economic benefits of tourism (Wu, 1986). Recent domestic research on museums has been conducted from four main perspectives: the development of museum tourism products in an integrated context, revitalization of museum heritage and cultural values, visitor perceptions and cultural experience quality, and efficiency of museum services and spatial effects (Yang, 2019; Deng and Niu, 2020; Hu, 2020; Zhao and Xu, 2021; Zheng, 2020; Huang, 2021; Jia, 2021; Liu et al., 2021; Wang and Yan, 2021). Some scholars have studied the distribution pattern of museums and influencing factors from a geospatial perspective (Liu and Chen, 2011; Ma et al., 2017; Liu et al., 2019a; Li and Peng, 2020; Zhuang et al., 2020), but relatively few studies have examined the distribution dynamics of museums from both spatial and temporal dimensions. Early studies on Beijing museums were few in number and mainly focused on service quality and visitor experience (Yang and Zhang, 2009; He et al., 2017; Wang and Wang, 2017). There is a lack of research on the dynamic evolution of museums from a spatio-temporal perspective. This paper takes the Beijing museums as the research object, exploring their evolution and influencing factors from a spatial-temporal perspective to provide crucial references for optimizing the spatial pattern of museums in Beijing and promoting their scientific development.

2 Data sources and research methodologies

2.1 Data sources

This study focuses on the 172 registered and operational museums located in Beijing’s 16 districts (Figure 1). The data on Beijing museums were sourced from the list published on the official website of the Beijing Municipal Bureau of Cultural Heritage. A spatial attribute database was created using ArcGIS, with coordinate projection transformation. Additional data on the economy, historical and cultural resources, education, population, etc., ware obtained from the Beijing Regional Statistical Yearbook 2021, as well as official government and related department website. Traffic data was sourced from OpenStreetMap.
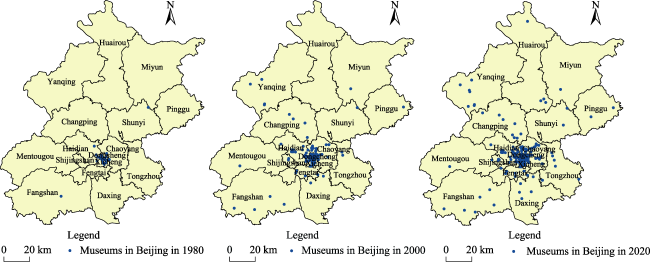
Figure 1 Spatial distribution of museums in Beijing in 1980, 2000 and 2020

2.2 Research methodologies

Considering the characteristics of the Beijing museum data, this study employs the kernel density, geographic concentration index, imbalance index, regional center of gravity, and standard deviation ellipse tools to quantitatively analyze the spatial layout of museum locations. The standard deviation ellipse and kernel density are commonly used methods for single-scale point pattern analysis, expressing the spatial distribution characteristics of museums in both macro and micro perspectives within the municipal area (Zhang et al., 2013). Combined with multi-year comparisons, these methods facilitate the discovery of the temporal evolutionary characteristics of Beijing’s museums. The geographic concentration index presents the clustering of Beijing’s museums on a multi-regional scale, while the imbalance index reflects the degree of geographic connectivity of Beijing’s museums (Xie et al., 2018; Wang and Liu, 2020). The Geodetector tool assesses the influence of factors affecting the spatial differentiation of museums (Wang and Xu, 2017).

2.2.1 Kernel density analysis

Kernel Density Analysis calculates the density of elements in their surrounding neighborhood, reflecting the distributional dynamics, extensibility, and polarization trends of the museum (Ma and Ma, 2021). The formula used is:
${{f}_{n}}(x)=\frac{1}{nh}\underset{i=1}{\overset{n}{\mathop{\mathop{\sum }^{}}}}\,k\left( \frac{{{X}_{i}}-x}{h} \right)$
Where ${{f}_{n}}(x)$ is the kernel density function, h is the bandwidth greater than zero, n is the number of museums within the bandwidth range,${{X}_{i}}-x$ is the Euclidean distance from the estimated point to the sample point. Larger values of $f(x)$ indicate a denser spatial distribution of museums. The kernel density visualization is presented as a heat map. In this study, a bandwidth value of 3 km is used to fully reflect the spatial clustering characteristics of museums in Beijing.

2.2.2 Geographic concentration index (GCI) and imbalance index

The GCI measures the degree of concentration of research objects within a given area (Yue et al., 2020). The formula is:
$G=100\times \sqrt{\underset{i=1}{\overset{n}{\mathop{\mathop{\sum }^{}}}}\,{{\left( \frac{{{x}_{i}}}{T} \right)}^{2}}}$
where G represents GCI of museums in Beijing, n is the number of sub-districts in Beijing, xi is the number of museums in the i-th district, and T is the total number of museums in Beijing. The value of G ranges from 0 and 100, with higher values indicating a more centralized the distribution of museums, and lower values indicating a more dispersed distribution.
The imbalance index reflects the degree to which museums are evenly distributed within a given region (Yue et al., 2020). It is calculated by the formula:
$S=\frac{\underset{i=1}{\overset{n}{\mathop{\mathop{\sum }^{}}}}\,{{Y}_{i}}-50(n+1)}{100n-50(n+1)}$
where S is the imbalance index of museums in Beijing, n is the number of sub-districts in Beijing, and Yi is the cumulative percentage of museums in each district of Beijing, sorted from largest to smallest. S ranges from 0 and 1, with values closer to 0 indicating a more balanced distribution of museums, and values closer to 1 indicating a more concentrated distribution.

2.2.3 Standard deviation ellipse

The standard deviation ellipse is a typical method for analyzing the directional characteristics of spatial distribution. It reflects the centrality and aggregation of objects from a global perspective and can depict the central tendency, the discrete direction, and the trend of the spatial characteristics of museums. The core elements for quantitatively interpreting the spatial distribution of museums are the center of gravity, the angle of rotation θ, the long axis, and the short axis. These are calculated using the following equations:
$\begin{matrix} SD{{E}_{x}}=\sqrt{\frac{\underset{i=1}{\overset{n}{\mathop{\mathop{\sum }^{}}}}\,{{\left( {{x}_{i}}-\bar{X} \right)}^{2}}}{n}} \\ SD{{E}_{y}}=\sqrt{\frac{\underset{i=1}{\overset{n}{\mathop{\mathop{\sum }^{}}}}\,{{\left( {{y}_{i}}-\bar{Y} \right)}^{2}}}{n}} \\\end{matrix}$
$\begin{matrix} \tan \theta =\frac{A+B}{C}\ \\ A=\underset{i=1}{\overset{n}{\mathop{\mathop{\sum }^{}}}}\,\tilde{x}_{i}^{2}-\underset{i=1}{\overset{n}{\mathop{\mathop{\sum }^{}}}}\,\tilde{y}_{i}^{2},\ B=\sqrt{{{A}^{2}}+{{C}^{2}}},\ C=2\underset{i=1}{\overset{n}{\mathop{\mathop{\sum }^{}}}}\,{{{\tilde{x}}}_{i}}{{{\tilde{y}}}_{i}} \\ \end{matrix}$
where n is the number of museums in Beijing, xi and yi are the horizontal and vertical coordinates of the i-th museum, respectivily.$\left\{ \bar{X},\bar{Y} \right\}$ denotes the mean center of the elements, $\tilde{x}_{i}$ and $\tilde{y}_{i}$ are the difference between the mean center and the i-th museum coordinate. The rotationθrefers to the angle between the major axis direction of the ellipse and the coordinate axis.

2.2.4 Geodetector

Geodetector is a tool for detecting and utilizing spatial variability, explaining the extent to which a factor affects the spatial variability of an element’s attributes (Wang and Xu, 2017). Its expression is as follows:
$q=1-\frac{1}{N{{\sigma }^{2}}}\underset{h=1}{\overset{L}{\mathop{\mathop{\sum }^{}}}}\,{{N}_{h}}\sigma _{h}^{2}$
where q is the probe value, L is the stratification of the variable Y or the factor X, N and Nh are the number of cells of the full region and layer h, respectively. ${{\sigma }^{2}}$ and $\sigma _{h}^{2}$ are the variances of the Y values for the whole region and layer h, respectively. The range of q is [0,1], with higher values indicating more pronounced spatial differentiation of Y. If the stratification is generated by X, a higher q indicates that X has a stronger explanatory power for Y, and vice versa.

3 Characteristics of the temporal evolution of museums in Beijing

Beijing is a well-known ancient capital and the city with the largest concentration of historical and cultural resources and relics. In 1912, China’s first national museum, the National Museum of History, was established at the former site of the National Academy of Sciences in Beijing, marking the beginning of museum construction across the country. Based on the number of museums in Beijing and the introduction of important policies, the temporal evolution of museums in Beijing can be divided into three stages (Figure 2).
Figure 2 Changes of the number of museums in Beijing by nature and by region, 1980‒2020
(1) Slow start phase (before 1980). After the founding of the People’s Republic of China, several new museums were built in Beijing for the purpose of cultural relics protection and inheritance. However, due to the Cultural Revolution, the development of museums was slow. By 1979, there were 19 museums in Beijing, 68% of which were built in the 1960s or earlier. These museums were state-owned and managed by government departments and their subordinate units. During this period, Beijing’s museums were spatially distributed in the Dongcheng and Xicheng districts, clustering around Tiananmen Square and the Forbidden City (Li et al., 2019). The museums primarily focused on cultural relics, serving educational and display functions, reflecting and carrying a specific national ideologies and significance (Zhao and Xu, 2020).
(2) High-speed development phase (1980-2000). After the reform and opening up, the introduction of market-oriented mechanism has promoted the transformation of Beijing museums from a solely state-owned entity to the coexistence of state-owned and privately-run entities. Museums entered a period of rapid growth. By 2000, there were 95 museums in Beijing, five times the number in 1979. In 1993, Beijing was the first city in the country to introduce the “Interim Measures for the Registration of Museums in Beijing”. In 1996, private museums were legally allowed to register, leading to the emergence of several privately-run museums, such as the Guanfu Museum and the Rosewood Museum. During this stage, with social and economic development, industrial museums displaying historical achievements in various fields rapidly emerged, including the Chinese Space Museum, the China Science and Technology Museum, and the China Printing Museum. Suburban museums developed more rapidly, with districts like Changping, Fangshan, Yanqing starting from scratch, expanding Beijing museums from the center to the entire region.
(3) Quality enhancement phase (2001 to present). In 2001, Beijing’s successful bid for the Olympic Games provided a new opportunity for museum development. To present a more diversified Chinese culture to the world, the Beijing Municipal Government increased in museums and issued the “Beijing Municipal Museum Regulations”. These regulations encourage the establishment of museums by all sectors of society and individual citizens, and prioritize the development of museums that fill the gaps in Beijing’s museum categories. Under the dual promotion of policies and regulations, Beijing museums entered a new stage of flouring and high-quality development. By 2020, there were 172 operational museums in Beijing, with 17% being privately-run, indicating increasing marketization. The category structure, spatial layout and marketization of museums continue to be optimized. The number of industry museums representing various industry achievements, is rapidly growing, matching the number of cultural relics museums. The construction of suburban museums have accelerated, with the number of museums in suburban areas from 21% in 2000 to 25%, ensuring all suburban areas of Beijing have museums. The proportion of privately-run museums rose from 9% in 2000 to 17% in 2020, making a new period of high-quality development for Beijing’s museums.

4 Spatial evolution of museums in Beijing

4.1 Characteristics of spatial agglomeration: “Single-core” agglomeration features are prominent

Museums serve as microcosm of a city’s historical and cultural transformations. The evolution of their distribution patterns reflect changes in the cultural landscape over time (Liu et al., 2019b). Applying formula (1) and ArcGIS, we conducted a kernel density analysis to generate a distribution map of Beijing museums (Figure 3). The map reveals that the distribution of museums in Beijing exhibits a clear “single-core” agglomeration, forming a high-density area concentrated in the Dongcheng and Xicheng districts. Over time, this single-core agglomeration has continuously expanded. As Beijing optimizes its urban layout and constructs museums around comprehensive functional areas and densely populated zones, the high-density core area of museums shows a tendency to develop new nuclei in the directions of Haidian and Chaoyang. This trend suggests a potential evolution into a multi-core agglomeration distribution. At the same time, with the enhancement of cultural functions and the increasing demand in suburban areas, suburban museums are gradually clustering to form several sub-cores. New clustering nuclei are expected to be formed in Huairou, Yanqing and Tongzhou in the future.
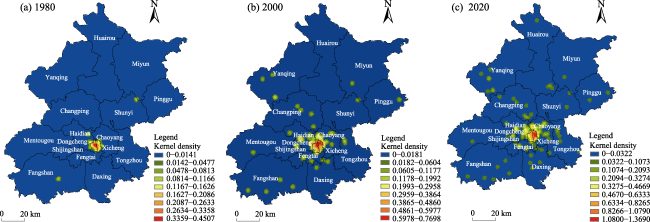
Figure 3 Distribution of kernel density in Beijing's museums

4.2 Characteristics of spatial equilibrium: Spatial concentration and uneven regional distribution

Applying formula (2), we calculated the geographic concentration index of museum distribution in Beijing (Table 1). The results show that the geographic concentration index of museums in Beijing has increases year by year, from 6.58 in 1980 to 35.92 in 2020, indicating a trend toward a more concentrated spatial distribution. We also calculated the imbalance index of museums in Beijing based on formula (3). Although the imbalance index has decreased over time, it still reached 0.55 in 2020, signifying an uneven distribution of museums across different districts. Museums are more concentrated in the city center, while the number of museums in the suburbs, despite rapid growth, remains relatively limited due to their initial smaller base.
Table 1 Geographic concentration index and imbalance index of Beijing museums
Category 1980 2000 2020
Geographic concentration index 6.58 20.95 35.92
Imbalance index 0.67 0.56 0.55
Furthermore, we plotted the Lorenz curve of the district-level distribution of museums in Beijing for the years 1980, 2000, and 2020 (Figure 4). The horizontal axis represents the number of museums in each district in descending order, while the vertical axis shows the cumulative share of museums in each district as a percentage of the city’s total, ranked from largest to smallest. In 1980, museums distribution was least balanced across Beijing’s districts, with museums mainly concentrated in Dongcheng, Xicheng and Chaoyang, which together accounted for 75% of all museums. By 2000, the balance had improved, with museums primarily located in Dongcheng, Xicheng, Chaoyang and Haidian, making up 72% of the total. In 2020, the distribution was the most balanced, though museums were still mainly concentrated in the same four districts, their combined share had decreased to 69%. Analysis of the Lorentz Curve indicates that the over-concentration of museums in Beijing’s central areas is diminishing, and the suburbs are expected to become significant growth areas for museums in the future.
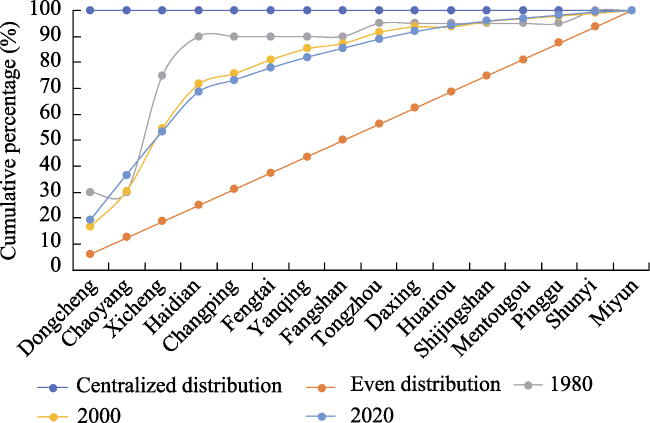
Figure 4 Lorenz curve of the spatial distribution of Beijing’s museums

4.3 Characteristics of spatial evolution: Shifting northwards and a tendency towards balanced distribution

To elucidate the dynamics and direction of the spatial evolution of the museums in Beijing, we analyzed the spatial distribution of the center of gravity and standard deviation ellipse for the years 1980, 2000, and 2020 using ArcGIS marketization (Figure 5). In 1980, due to the extremely small number of museums in both southern and northern suburbs it was impossible to conduct relevant calculations regarding spatial evolution. This analysis allowed us to further explore the trends in the spatio-temporal evolution of Beijing’s museums.
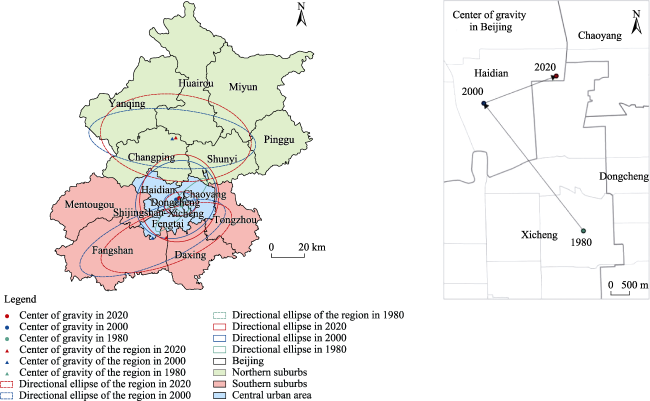
Figure 5 Ellipse distribution of center of gravity and standard deviation of the Beijing’s museums

4.3.1 Change in center of gravity

From 1980 to 2020, the center of gravity of museums in Beijing has shifted noticeably northward, moving from Xicheng to Haidian, indicating an “inverted L” type development. In 1980, the center of gravity was located in Xicheng District. By 2000, it had moved 4.4 km northwest to Haidian District. In 2020, the center of gravity shifted again, moving 2.1 km northeast, still within the Haidian District but closer to the junction of the Haidian, Xicheng and Chaoyang districts. This shift reflects a transition from a historical clustering in the east and west of the city to new clusters driven by economic and consumer activity (Yang and Zhang, 2009). Influenced by the developed economy and active cultural consumption demand, Haidian and Chaoyang are becoming new centers for museum concentration in Beijing.
The center of gravity of museums in the central city has followed a similar pattern, shifting from Xicheng District to Haidian District. In recent years, the thematic focus of Beijing’s Museums has expanded from historical and cultural resources to diverse arts, economic and social development. Haidian, with the highest GDP in Beijing, a significant concentration of university resources, and a dynamic young consumer base, has become a key area for museum cluster development. In the northern suburbs, the center of gravity has moved eastward within Changping District, which borders Haidian and Chaoyang, benefiting from industrial transfers from the city center and increasing cultural demand due to the presence of university branches. In the southern suburbs, the center of gravity has shifted eastward from the junction of Fangshan and Fengtai to the junction of Fangshan and Daxing, indicating a new trend towards Daxing and Tongzhou. The operation of Daxing International Airport has enhanced Daxing’s cultural appeal. As Beijing’s urban sub-center of, Tonzhou has emerged as a significant driver in the relocation of museum focus in the southern suburbs due to its rapid development of cultural facilities.

4.3.2 Direction of movement

From 1980 to 2020, the flatness of the standard deviation ellipse for Beijing’s museums decreased dramatically from 0.77 to 0.13 (Table 2), indicating a reduction in the “Northeast-Southwest” directional bias of spatial distribution. The convergence of the long and short semi-axes suggests a move towards a more directionally neutral and evenly distributed spatial pattern. The rotation angle of the central city’s ellipse decreased from 143.24 degree in 1980 to 86.85 degree in 2020, reflecting a shift in museum distribution from a “northwest-southeast” orientation to a more balanced “west- east” spread, highlighting balanced development across Dongcheng, Xicheng, Haidian, and Chaoyang. In both the northern and southern suburbs, there is a tendency for the flatness to decrease, indicating a weaking of the directional characteristics of museums distribution. In the northern suburbs, museums are distributed along a “northwest-southeast” axis across district like Yanqing, Huairou, Miyun, Changping, Shunyi and Pinggu. In the southern suburbs, museums exhibit a “northeast-southwest” distribution, clustering towards Tongzhou, Daxing, and Fangshan, though the scope of this clustering has narrowed over time.
Table 2 Parameters of the standard deviation ellipse of the Beijing museum, 1980-2020
District Year Longitude of the center of gravity (°E) Latitude of the center of gravity (°N) Long axis (km) Short axis (km) Angle of rotation (o) Flatness Ellipse area (km2)
Beijing 1980 116.38 39.93 22.63 5.25 47.68 0.77 373.06
2000 116.35 39.96 26.45 22.81 53.17 0.14 1895.58
2020 116.37 39.97 27.77 24.12 16.93 0.13 2104.05
Southern suburbs 2000 116.14 39.77 47.97 16.73 71.34 0.65 2521.17
2020 116.24 39.76 42.57 16.87 72.95 0.60 2256.32
Central urban area 1980 116.38 39.93 5.47 3.25 143.24 0.41 55.77
2000 116.37 39.94 9.99 7.49 96.13 0.25 235.07
2020 116.38 39.94 10.39 7.49 86.85 0.28 244.48
Northern suburbs 2000 116.40 40.31 53.77 19.26 100.36 0.64 3252.80
2020 116.42 40.31 47.48 27.92 102.42 0.41 4164.59

Note: In 1980, due to the extremely small number of museums in both southern and northern suburbs, it was impossible to conduct relevant calculations regarding spatial evolution.

5 Drivers of spatial distribution of museums in Beijing

The spatial distribution of museums results from the interplay of various factors. Scholars have identified multiple drivers of museum spatial distribution, including the economy, resources, policy, population, transportation, historical inertia, and tourism (Liu and Chen, 2011; Li and Peng, 2020; Zhuang et al., 2020; Liu et al., 2022a; Liu et al., 2022b). Building on these research findings, this paper conducts a prior exploratory study on the driving factors influencing the spatial distribution of museums in Beijing. Through correlation analysis, factors such as policy, tourism, and historical inertia, which have an insignificant impact on the distribution of museums in Beijing or are difficult to analyze quantitatively, were excluded. Considering that museums are increasingly becoming places for cultural learning, insights, scientific research, and parent-child interaction (He et al., 2017), educational factors were integrated into the analysis. Ultimately, five drivers and corresponding indicators were identified: resources, education, economy, population, and transportation (Table 3). Using Geodetector, the main factors driving the distribution of museums in Beijing were analyzed based on available data for the years 2000, 2010, and 2020. The indicators of the influencing factors were categorized into 6 groups using the natural breakpoint method in Arcgis 10.2. Smaller classification values correspond to smaller amounts of the respective indicator within each grid. The importance of each driver is shown in Figures 6, 7, and 8.
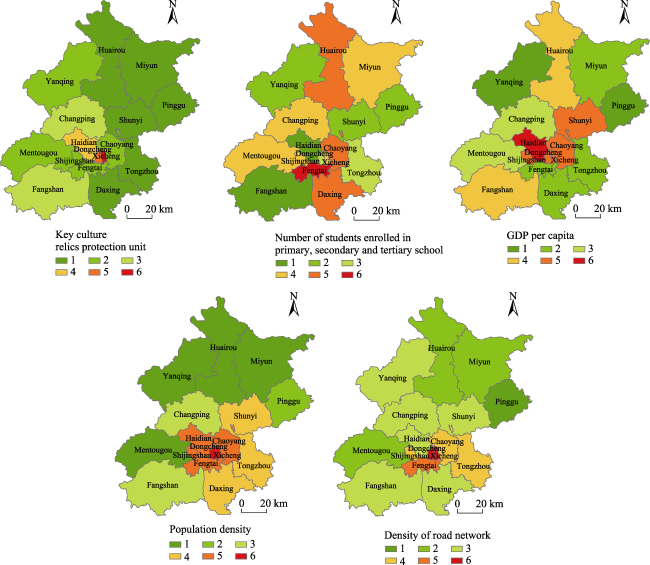
Table 3 Influencing factors of spatial distribution of museums in Beijing
Influencing factors Index Data source
Resource Key cultural relics protection unit Beijing Municipal Bureau of Cultural Heritage Official Website
Education Number of students enrolled in primary, secondary and tertiary schools Beijing Regional Statistical Yearbook 2021
Economy GDP per capita Beijing Regional Statistical Yearbook 2021
Population Population density Beijing Regional Statistical Yearbook 2021
Transportation Road network density (highway and metro) OpenStreetMap
Figure 6 Classification results of spatial distribution driving factors of museums in Beijing in 2000

Note: The classification criteria are introduced in the article. The same below.

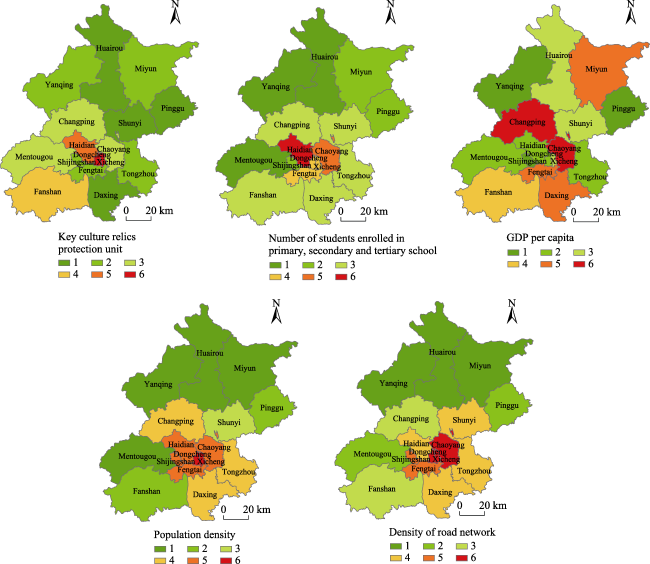
Figure 7 Classification results of spatial distribution driving factors of museums in Beijing in 2010
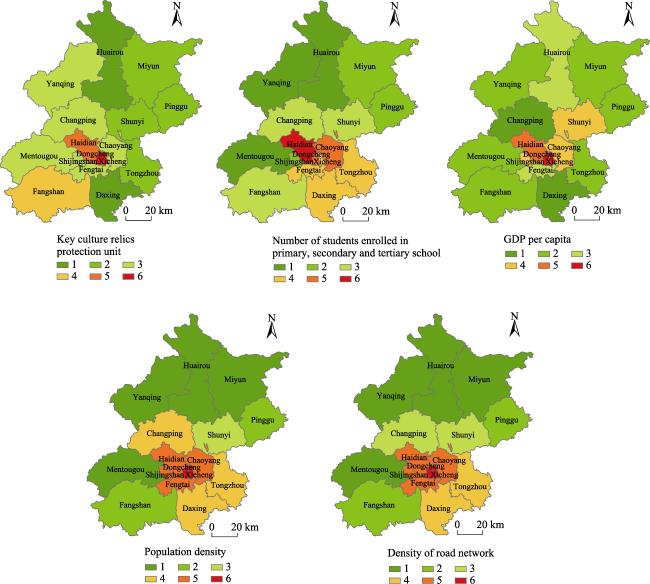
Figure 8 Classification results of spatial distribution driving factors of museums in Beijing in 2020

5.1 Factor detection results

Using Geodetector to analyze each factor, all drivers were significantly correlated at 99% confidence interval for all three years. The results are shown in Table 4. In 2000, the explanatory power of each factor was as follows: population density > key cultural relics protection units > road network density > number of students in primary and secondary schools and colleges > GDP per capita. This indicates a “population-oriented” spatial distribution pattern of museums. Museums, aspublic cultural venues serving the spiritual civilization of the people, have their spatial distribution influenced by population size (Yang, 2019; Zhuang et al., 2020). In 2000, 62.67% of Beijing’s population was concentrated in the central six urban areas, with significant planning and resource investment focused on urban construction. During this period, these six urban areas housed 78.95% Beijing’s museums, demonstrating a strong demographic association in their spatial distribution.
Table 4 Detection results of spatial distribution driving factors of museums in Beijing in 2000, 2010 and 2020
Year Factor detection Resource Education Economy Population Transportation
2000 q statistic 0.707 0.308 0.284 0.719 0.463
P value <0.001 <0.001 <0.001 <0.001 <0.001
2010 q statistic 0.277 0.569 0.380 0.374 0.529
P value <0.001 <0.001 <0.001 <0.001 <0.001
2020 q statistic 0.497 0.513 0.252 0.461 0.311
P value <0.001 <0.001 <0.001 <0.001 <0.001

Note: Resource=Key cultural relics protection unit; Education=Number of students enrolled in primary, secondary and tertiary schools; Economy= GDP per capita; Population=Population density; Transportation=Road network density.

In 2010, the explanatory power of each factor was ranked as follows: the number of students enrolled in primary, secondary and tertiary schools > road network density > GDP per capita > population density > key cultural heritage conservation units. In 2020, the explanatory power of each factor is ranked as follows: the number of students enrolled in schools and colleges > key cultural heritage protection units > population density > road network density > GDP per capita. The “education-oriented” spatial distribution pattern of museums in 2010 and 2020 highlights their growing role as places for people’s spiritual and cultural consumption, with increasing relevance to education (He et al., 2017). As special educational carriers, museums are important for reflecting the city’s cultural heritage and serving the spiritual and cultural needs of residents (Lu et al., 2019). In 2006, Beijing issued a “plan for the development of cultural relics and museums during the Eleventh Five-Year Plan period”, emphasizing the social functions of museums in terms of publicity and education, as well as their advanced level of utilization. In 2015, “Beijing’s Opinions on Accelerating the Construction of a Modern Public Cultural Service System” explicitly stated that regular visits to museums should be incorporated into primary and secondary school education programs. Under policy guidance, the construction of museums around educational population increased significantly, and showcasing university research became a path for museum innovation. This led to the emergence of thematic research museums, such as the Media Museum at the Communication University of China, the Art Museum in Tsinghua University, and the Museum of Family Letters in Renmin University of China.
Key cultural relics protection units were the second strongest explanatory factor in both 2000 and 2020, indicating certain “resource-oriented” characteristics in the spatial distribution of museums. There is a strong correlation between the distribution of museums and cultural relics resources in Beijing, with many museums themselves being key cultural relics protection units (Liu et al., 2022a). Beijing has built numerous museums around key cultural relics protection units such as former residences of celebrities, memorial halls, historical buildings and ruins, 42% of which are of a cultural relic nature. Over the years, the influence of single factor on the spatial distribution of museums in Beijing has shown an overall decreasing trend, indicating that the spatial distribution of museums is increasingly driven by multiple factors.

5.2 Interaction detection results

In order to further explore the influence of multiple factors on the distribution of museums in Beijing, an interaction detector was used to analyze the data from 2000, 2010 and 2020. The results are shown in Table 5, Table 6 and Table 7. From these results, it can be seen that the explanatory power of all factors on the dependent variable under the two-factor interaction is enhanced in 2000, 2010 and 2020, indicating that the spatial distribution of museums in Beijing is the result of the joint action of multiple factors.
Table 5 Detection results of the interaction of driving factors of spatial distribution of museums in Beijing in 2000
Factors Key cultural relics protection unit Number of students enrolled in primary, secondary and tertiary schools GDP per capita Population density Road network
density
Key cultural relics protection unit 0.707
Number of students enrolled in primary, secondary and tertiary schools 1.0 0.308
GDP per capita and consumption
expenditure per capita
0.949 0.778 0.284
Population density 0.823 1.0 0.948 0.719
Road network density 0.949 0.828 0.948 0.948 0.463
Table 6 Detection results of the interaction of driving factors of spatial distribution of museums in Beijing in 2010
Factors Key cultural relics protection unit Number of students enrolled in primary, secondary and tertiary schools GDP per
capita
Population density Road network density
Key cultural relics protection unit 0.277
Number of students enrolled in primary, secondary and tertiary schools 0.996 0.569
GDP per capita and consumption expenditure per capita 0.876 0.997 0.380
Population density 0.653 0.620 1.0 0.374
Road network density 0.989 0.735 0.955 0.756 0.529
Table 7 Detection results of the interaction of driving factors of spatial distribution of museums in Beijing in 2020
Factors Key cultural relics protection unit Number of students enrolled in primary, secondary and tertiary schools GDP per capita Population density Road network density
Key cultural relics protection unit 0.497
Number of students enrolled in primary, secondary and tertiary schools 0.745 0.513
GDP per capita and consumption
expenditure per capita
0.621 0.745 0.252
Population density 0.717 0.722 0.475 0.461
Road network density 0.717 0.545 0.495 0.488 0.311
From the results of the interaction between factors for each year, in 2000, the driving factors for the spatial distribution of museums in Beijing were characterized by “two factors”. In 2000, the interaction between key cultural relics protection units and road network density, among other factors, was the strongest, showing the double-driven characteristics of “resources” and “transportation”. The strongest interaction was found between key heritage conservation units and the number of students enrolled in schools and colleges (1.0), followed by with GDP per capita (0.949), and road network density (0.949). The interaction of road network density with GDP per capita (0.948) and population density (0.948) also showed a strong enhancement effect. Transportation accessibility significantly affects the museum’s patronage and range of influence (Zhuang et al., 2020). In the early days, museums were mostly established to protect and exhibit material heritage. Meanwhile, convenient transportation is a prerequisite for consumers to visit museums, enhancing the public's willingness to engage with museums. As a result, the construction of museums has been more dependent on heritage resources and transportation accessibility (He et al., 2017).
In 2010, the interaction between GDP per capita and other factors was the strongest, indicating an “economic” drive in the distribution of museums in Beijing. GDP per capita had the strongest interaction with population density (1.0), followed by the interaction with the number of students enrolled in schools and colleges (0.997) and road network density (0.955). The level of economic development has a direct impact on the scale of museums (Li et al., 2019). Using SPSS25.0 to conduct Pearson correlation analysis between the number of museums and the level of economic development in Beijing, the results showed that the Pearson correlation coefficient between the number of museums and the level of economic development was 0.866**①(①** represents significant correlation at the 0.01 level, and ** in this article has the same meaning.). This indicates a strong correlation between the spatial distribution of museums and the level of economic development in each district. The top three districts in terms of per capita GDP, namely Dongcheng, Xicheng and Haidian, accounted for 52% of the museums in Beijing.
In 2020, the influence of factor interactions declined, and while interactions still enhanced the explanatory power, it was much less pronouned than in 2010 and 2000. The strongest interactions were found between the number of students enrolled in primary, secondary and tertiary schools and the factors of key cultural heritage units (0.745), GDP per capita (0.745) and population density (0.722). This indicates that the distribution of museums in Beijing is primarily “education-driven” due to a combination of factors. Economic development and rising demand of residents for spiritual culture have increased the role of museums in the “second classroom”, study tours, public popularization of science, and the display of scientific research. The spatial distribution of museums is increasingly characterized by their proximity to educational populations.

6 Discussion and conclusions

The “City of Museums” strategy provides new opportunities for museum construction in Beijing. To explore the spatiotemporal evolution of museums in Beijing, this study uses GIS spatial analysis methods to examine the characteristics of this evolution and driving factors behind the spatial distribution of museums. The following conclusions are drawn:
(1) The development of museums in Beijing has undergone three stages: slow start, rapid development and quality enhancement. During these stages, the structure of museum types has continuously improved and the degree of marketization has increased.
(2) The spatial distribution of museums in Beijing is evolving from a “single-core” agglomeration in the central city to a multiple-core fission (Wu et al., 2023). The distribution of museums in the central urban area is relatively concentrated, while the spatial distribution across various districts is uneven, showing typical “center-edge” characteristics.
(3) From a of spatial evolution perspective, Beijing’s museums are tending to develop “to the north and to the east”, with Haidian and Chaoyang expected to become new centers. The northern suburbs show a tendency to cluster at the intersection of various districts, while the southern suburbs show economic and policy-driven clustering, particularly in Tongzhou and Daxing.
(4) The uneven spatial distribution of museums in Beijing is influenced by multiple factors such as resources, education, economy, population, and transportation. Over time, the primary driving factors have shifted from being “population-driven” and “resource-driven” to “education-driven”.
This study examines the spatial distribution patterns and driving factors of museums in Beijing from both temporal and spatial perspectives, aiming to provide a reference for the future planning and construction of museums in Beijing and other cities. Due to Limitation in pages and data acquisition, the evolutionary characteristics of different types of museums were not analyzed in depth, suggesting that future research could classify and study these characteristics more thoroughly. The spatial distribution of museums in Beijing is influenced by a variety of factors and carries a strong historical imprint, with the influence of these factors varying at different development stages. Additionally, institutional change is also a significant factor affecting museum development. Future research could further explore these elements.
[1]
Absalyamova A, Absalyamov T, Absalyamova S. 2015. Private museums as a form of preservation of cultural heritage. Procedia Social and Behavioral Sciences, 188: 218-221.

[2]
Araujo O S C C, Smith K H, Cachioni. 2020. Education and the relationships between museums and older audiences: A scoping review protocol. International Journal of Educational Research, 102: 101591. DOI: 10.1016/j.ijer.2020.101591.

[3]
Bertacchini E, Nuccio M, Durio A. 2021. Proximity tourism and cultural amenities: Evidence from a regional museum card. Tourism Economics, 27(1): 187-204.

[4]
Boukas N, Ioannou M. 2020. Co-creating visitor experiences in cultural heritage museums: The avenue towards sustainable tourism development. International Journal of Tourism Policy, 10(2): 101-122.

[5]
Bovcon N. 2021. Virtual museums: Interpreting and recreating digital cultural content. Neohelicon, 48: 23-38.

[6]
Bradburne J M. 2001. A new strategic approach to the museum and its relationship to society. Museum Management and Curatorship, 19(1): 75-84.

[7]
Braden L E A, Teekens T. 2020. Historic networks and commemoration: Connections created through museum exhibitions. Poetics, 81: 101446. DOI: 10.1016/j.poetic.2020.101446.

[8]
Chaney D, Pulh M, Mencarelli R. 2018. When the arts inspire businesses: Museums as a heritage redefinition tool of brands. Journal of Business Research, 85: 452-458.

[9]
Deng C, Niu Y. 2020. Research on tourism experience of Yuncheng Museum based on ASEB method. Journal of Yuncheng University, 38(3): 37-42. (in Chinese)

[10]
Gil S M, Ritchie J R B, Santana A A. 2019. Museum tourism in Canary Islands: Assessing image perception of directors and visitors. Museum Management and Curatorship, 34(5): 501-520.

[11]
Griffin D, Abraham M. 2000. The effective management of museums: Cohesive leadership and visitor-focused public programming. Museum Management and Curatorship, 18(4): 335-368.

[12]
He D, Li X Y, Zhou A H. 2017. Museum tourism experience in Beijing—Based on internet text content analysis of Dianping.com. Resource Development & Market, 33(2): 233-237. (in Chinese)

[13]
Hu H Y. 2020. Regional differences in operation efficiency of provincial museums in China: Trend, reasons, and implications. Journal of Shenzhen University (Humanities & Social Sciences), 37(6): 64-71. (in Chinese)

[14]
Huang X K. 2021. Driving force, strategy and path of integrated development of culture and tourism in new era. Journal of Beijing Technology and Business University (Social Sciences), 36(4): 1-8. (in Chinese)

[15]
Jia Y. 2021. Museum tourism development strategy based on resource characteristics. Tourism Today, 19(8): 18-19. (in Chinese)

[16]
Kawashima N. 1998. Knowing the public: A review of museum marketing literature and research. Museum Management and Curatorship, 17(1): 21-39.

[17]
Li J L, Peng K L. 2020. Research on spatial distribution characteristics and influencing factors of museums in Anhui Province. Resource Development & Market, 36(11): 1307-1312. (in Chinese)

[18]
Li S. 2018. Private museums: An important field for the transmission of Chinese outstanding traditional culture. Journal of South-Central Minzu University (Humanities and Social Sciences), 38(4): 48-51. (in Chinese)

[19]
Li X G, Xiao P N, Wu Q, et al. 2019. Research on influence factors and temporal-spatial evolution of public library in China. Human Geography, 34(1): 140-150. (in Chinese)

[20]
Liu H L, Liu M T, Hu X H, et al. 2022a. Temporal and spatial evolution of Chinese museums and their causes analysis. Tropical Geography, 42(3): 469-480. (in Chinese)

[21]
Liu N, Chen Y. 2011. Study on the spatial distribution features of cultural venues in Xi’an. Journal of Qufu Normal University (Natural Science), 37(3): 103-107. (in Chinese)

[22]
Liu R, Ren X L, Yang Y C, et al. 2021. Research on the process, characteristics and spatial effect of the development of Chengdu’s museums. Geographical Research, 40(1): 279-291. (in Chinese)

[23]
Liu S J, Yang Z, Cheng H, et al. 2019a. Characterization of the evolution of the spatio-temporal distribution pattern of museums in the provincial area—A case study of Anhui Province. Journal of Beijing Union University, 33(4): 38-45. (in Chinese)

[24]
Liu S J, Yang Z, Liu Y T, et al. 2022b. The spatial distribution of museums and the associated factors in the Yangtze River Delta Region. Journal of South China Normal University (Natural Science Edition), 54(1): 91-99. (in Chinese)

[25]
Liu Y C, Zheng L, Jin Y P. 2019b. Spatial and temporal evolution of museum in Jiangxi Province. Jiangxi Science, 37(1): 55-63. (in Chinese)

[26]
Lu C Y, Xu Y T, Lin X Q, et al. 2019. Study of spatio-temporal evolution of the circum-Bohai urban agglomeration based on DMSP/OLS night-time light data. Remote Sensing for Natural Resources, 31(4): 218-226. (in Chinese)

[27]
Luo X J. 2017. Social roles of the museum in the context of public cultural service. Southeast Culture, (4): 85-88. (in Chinese)

[28]
Ma H L, Wang H Z, Li X G, et al. 2017. Multi-scale analysis of spatial distribution characteristics of museums in China. Human Geography, 32(6): 87-94.

[29]
Ma Y L, Ma Y P. 2021. Study on regional differences and convergence of the allocation efficiency of scientific and technological resources in China. Journal of Quantitative & Technological Economics, 38(8): 83-103. (in Chinese)

[30]
Marek P. 2017. The administration system of French museums. Museology and Cultural Heritage, 5(1): 159-168.

[31]
Tufts S, Milne S. 1999. Museums: A supply-side perspective. Annals of Tourism Research, 26(3): 613-631.

[32]
Varvin G, Fauskerud H, Klingvall I, et al. 2014. The journey as concept for digital museum design. Digital Creativity, 25(3): 275-282.

[33]
Wang J, Wang Y X. 2017. The researches on quality improvement of service in museum cultural tourism in Beijing. Journal of Beijing Union University (Humanities and Social Sciences), 15(3): 26-30. (in Chinese)

[34]
Wang J F, Xu C D. 2017. Geodetector: Principle and prospective. Acta Geographica Sinica, 72(1): 116-134. (in Chinese)

DOI

[35]
Wang X W, Yan S N. 2021. The integration of culture and tourism of museums from the perspective of value co-creation: Connotations, structure, and trends. Studies of Culture and Art, 14(3): 16-24, 112. (in Chinese)

[36]
Wang Z F, Liu Q F. 2020. Spatial differentiation and the forming factors of sports and leisure characteristic towns under the background of industry convergence. Scientia Geographica Sinica, 40(8): 1310-1318. (in Chinese)

DOI

[37]
Wu L Y, Li Y, Xu J Y, et al. 2023. Spatio-temporal evolution and influencing factors of cultural and leisure venues in Beijing. Journal of Resources and Ecology, 14(5): 1001-1014.

DOI

[38]
Wu W G. 1986. Museums and tourism. Chinese Museum, (2): 4-6. (in Chinese)

[39]
Xie H, Li Y H, Wei Y Y. 2018. Influencing factors and spatial distribution of the characteristic towns in Zhejiang Province. Scientia Geographica Sinica, 38(8): 1283-1291. (in Chinese)

DOI

[40]
Yang Y. 2019. Study on quality evaluation and optimization strategy of tourism experience in comprehensive museum—Taking the Yangtze River Delta as an example. Diss., Shanghai, China: Shanghai Normal University. (in Chinese)

[41]
Yang Y P, Zhang J Q. 2009. The analysis of spatial distribution features of museums in Beijing City. Human Geography, 24(5): 52-54. (in Chinese)

[42]
Yue J, Dai X Y. 2020. Temporal and spatial pattern of cultural heritage in Beijing-Tianjin-Hebei Region and its influencing factors: A case study of cultural relic protection unit. Economic Geography, 40(12): 221-230. (in Chinese)

[43]
Zhang X, Zhong E S, Zhang X H, et al. 2013. Spatial distribution and clustering of commercial network in Beijing during 2004-2008. Progress in Geography, 32(8): 1207-1215. (in Chinese)

DOI

[44]
Zhang Y. 2021. Museum as a media of memory: The narratives and communication of public events. Fudan Journal (Social Sciences Edition), 63(3): 97-104. (in Chinese)

[45]
Zhao G X, Xu Y Z. 2020. Discussion on the public function of modern Beijing museums: Focusing on press publications and literature. Journal of National Museum of China, (10): 152-160. (in Chinese)

[46]
Zhao Y F. 2021. Thesis on the innovative development of museum tourism in the context of tourism integration. Dongyue Tribune, 42(5): 14-22. (in Chinese)

[47]
Zheng Q. 2020. International comparison and suggestions on countermeasures for the innovative development of museum heritage resources. Chinese Museum, (3): 63-67. (in Chinese)

[48]
Zhuang L, Tian N, Zhao B. 2020. Spatio-temporal characteristics and impact factors of museums in Shanghai. Tropical Geography, 40(3): 539-550. (in Chinese)

DOI

Outlines

/