Ecotourism

Measurement and Mechanism of the Integration of Culture and Tourism: A Case Study of Anhui Province in China

  • WANG Naiju , 1 ,
  • WANG Sai , 2
Expand
  • 1. School of Tourism and Exhibition, Hefei University, Hefei 230601, China
  • 2. School of Geography, South China Normal University, Guangzhou 510631, China
* WANG Sai, E-mail:

WANG Naiju, E-mail:

Received date: 2024-03-28

  Accepted date: 2024-07-10

  Online published: 2025-03-28

Supported by

The Anhui Province Philosophy Social Science Planning General Project(AHSKY2022D135)

The Anhui University Discipline (Professional) Top Talents Academic Funding Project(gxbjZD2021015)

Abstract

This study employs the comprehensive index method and the coefficient of variation method to explore the integration mechanism of regional culture and tourism. It measures the integration development degree of culture and tourism subsystems in 16 prefecture-level cities in Anhui Province. Additionally, the decision-making trial and evaluation laboratory (DEMATEL) method is used to investigate the integration mechanism. The results indicate the following: From 2012 to 2021, the comprehensive index, integration degree, and integration development degree of cultural subsystems in the 16 prefecture-level cities in Anhui Province exhibited noticeable periodic changes. Between 2015 and 2019, the growth rate in eastern prefecture-level cities was significantly faster than that in central and western cities. In 2019, all regions—eastern, central, and western—experienced a downward trend, and the spatial difference in recovery growth in 2020 was minimal. Within the cultural and tourism integration system, the industry foundation and activity scale of the cultural subsystem are interdependent, while the industry foundation of the tourism subsystem results from the market scale. The central factors are primarily focused on the industrial base and the activity or market scale of the criterion layer of both subsystems. Conversely, the economic contribution of the criterion layer of the two subsystems has a minimal impact on centrality.

Cite this article

WANG Naiju , WANG Sai . Measurement and Mechanism of the Integration of Culture and Tourism: A Case Study of Anhui Province in China[J]. Journal of Resources and Ecology, 2025 , 16(2) : 513 -523 . DOI: 10.5814/j.issn.1674-764x.2025.02.019

1 Introduction

1.1 Foreign research

In Western countries, research on the integration of culture and tourism primarily focuses on three key aspects: the relationship between culture and tourism, the development of cultural tourism products, and the strategies for advancing the cultural tourism industry. The exploration of the relationship between culture and tourism originated with the concept of cultural tourism. In 1977, Smith posited that cultural tourism is a lifestyle (Smith, 1977). McIntosh and Prentice (1999) suggested that cultural tourism encompasses all activities and behaviors related to tourism that can influence individuals’ patterns of thought. The World Tourism Organization (1985) provided a specific definition of cultural tourism, emphasizing spatial movements motivated by culture, such as visiting historical sites, attending artistic performances, participating in folk activities, undertaking religious pilgrimages, and engaging in cultural study tours. The impact of culture on tourism is both evident and profound. In cultural tourism, culture serves as a central element, while tourism is merely a medium (Macintosh and Gerbert, 1985). Local culture can enhance the image of a tourism destination (Larson et al., 2013). From an industry perspective, the tourism and cultural sectors are interdependent, closely linked, and capable of mutually promoting development (Taylor, 2001; Connell, 2012). Culture tourism products products are presented in various formats, including cultural heritage sites, history museums, festivals, and film and television communication. The cultural tourism products associated with heritage sites have been widely studied in academic circles (Apostolakis, 2003; Kim, 2015; Corsale, 2017). Research on the development pathways of the cultural tourism industry is extensive. Richards (1996) highlighted that improving the quality of practitioners within the cultural tourism sector is a key factor in promoting the integrated development of cultural heritage and tourism. Taylor (2006) argued that tourists are the driving force behind the integrated development of heritage and tourism. Creative activities represent an important method for producing cultural tourism products and a vital pathway for advancing the growth of the cultural tourism industry (Juzefovič, 2015; Richards et al., 2018).

1.2 Domestic research

In China, the study of the relationship between culture and the tourism industry or economy has a long history and has produced extensive results. However, research on the integration of culture and tourism began later, in the 2010s. The theoretical foundation of culture and tourism integration has consistently been a focal point of academic discourse. Some scholars, drawing parallels with physiwwcal industries, argue that technological advancements and market forces have resulted in increasingly blurred boundaries between the cultural and tourism sectors. Sociological and cultural theories, including field theory, identity theory, cultural stratification, and symbiosis theory, have also garnered significant attention in the exploration of cultural and tourism integration (Wu, 2013; Chen and Xie, 2019; Ma and Tong, 2019; Zhang and Zhu, 2020; Chai et al., 2022).
Additionally, the integration mechanism of culture and tourism is a prominent and challenging area of research. The theory of industrial integration posits that industrial transformation is the driving force behind the convergence of culture and tourism (Cheng and Zhu, 2012; Zhao and Chen, 2020). Furthermore, the modes and pathways of culture and tourism integration represent another significant area of study. Based on the integration process, it can be categorized into penetration, reorganization, and extension types (Cheng and Zhu, 2012; Zou, 2017). According to outcomes, it can be classified into leisure, novelty, educational, ideal, and developmental types (Tao and Xu, 2019). Beyond high-level design, such as institutional frameworks, factors such as products, business models, markets, services, technology, and talent constitute the primary pathways for the integration of culture and tourism (Li, 2022; Li et al., 2022).
Currently, the integration of culture and tourism is predominantly at a preliminary stage, characterized by a focus on heritage sites, historical districts, and cultural venues. Cultural travel, performances, and studies are the primary forms of this integration. This approach exhibits noticeable signs of rigid splicing and blending. However, there is a growing emphasis on the comprehensive, multi-level deep integration of the cultural tourism industry chain, innovation chain, and value chain (Zhang, 2019; Liu et al., 2023). In addition to research on the theories, mechanisms, models, and pathways of cultural and tourism integration, there has been an increasing volume of literature addressing the integration or measurement of the culture and tourism industries in recent years (Xu et al., 2017; Liu et al., 2020; Cui et al., 2022).

1.3 Review of domestic and international research

The theoretical foundation for studying the integration of culture and tourism is inadequate. Industrial integration theory posits that technological advancement is the primary driver behind the blurring of industrial boundaries; however, this perspective falls short when applied to the mechanisms of culture and tourism integration. The public welfare aspect of cultural tourism cannot be analyzed solely through the lens of industrial boundaries. Furthermore, the intangible and dynamic nature of non-material cultural tourism products contrasts sharply with the physical forms of conventional industrial products. While technology serves as a catalyst for the integration of culture and tourism, cultural creativity is the fundamental force driving this integration. Therefore, placing excessive emphasis on the economic attributes of culture and tourism integration, without fully elucidating the underlying mechanisms, is likely to result in biased conclusions in future research on integration models and pathways.
Although there have been notable advancements in quantitative research regarding the level of integration between culture and tourism and the measurement of this integration within the cultural and tourism sectors, the predominant focus has been on the economic aspects. It is essential to also consider the public welfare implications of culture and tourism, wherein various entities possess the capital and influence necessary to facilitate the integration process. The challenge lies in utilizing these subjective behaviors as measurable indicators for evaluation, indicating that the assessment of culture and tourism integration extends beyond the industrial level.
In conclusion, there is an urgent need for further theoretical and methodological innovation and development in research on the integration of culture and tourism at the provincial level, particularly in Anhui Province.

2 Research methods

2.1 Construction of indicator system

2.1.1 Introduction theory

Pierre Bourdieu defined a field as a network or configuration of objective relations among various positions. The network of relationships within a field exists objectively, independent of the actors, but is related to the actors' positions, the capital they possess, and their strategies for action. A field serves as a battleground of forces where actors compete for capital and power, utilizing their capital to acquire additional capital, thereby gaining greater and more dominant influence within the field (Pierre and Hua, 2015).
Drawing on Bourdieu’s theory of fields, the cultural and tourism field (cultural-tourism field) operates within a defined material context (geographical space) and is influenced by factors such as positions, capital, and power, creating a complex network of cultural and tourism relationships. Actors within this network engage in actions aimed at controlling and expanding capital, with a focus on exercising power. Their endeavors seek to achieve comprehensive benefits across economic, ecological, and social dimensions.

2.1.2 System construction

Drawing from existing achievements and considering the principles of scientific validity and data availability, and following Bourdieu’s field theory, indicators for the two major subsystems of culture and tourism are selected based on three criteria: industry foundation, activity or market scale, and economic contribution.
The industrial foundation of the cultural and tourism subsystems characterizes the network of relationships among all stakeholders in the cultural and tourism fields. The activity scale of the cultural subsystem and the market scale of the tourism subsystem, along with the economic contributions of both subsystems, represent the competition for capital and power within the integrated cultural and tourism system. This competition, in turn, influences habitual actions within the system, reflecting the activity scale of the cultural subsystem and the market scale of the tourism subsystem. In consideration of the public welfare aspects of cultural institution services and to distinguish characteristics beyond pure economics, the industrial foundation of the cultural subsystem incorporates public welfare and its market scale is referred to as the activity scale. In total, 14 indicators were selected for the cultural industry subsystem in Anhui Province, and 15 for the tourism industry subsystem, totaling 29 indicators (Table 1).
Table 1 Evaluation index system of integration development degree of culture and tourism
Overall
objective
Target layers Criterion layers Indicator layers (units) Weights Codes
Development degree of cultural and tourism
integration
Development level of cultural subsystem Industry
foundation
Art performance group (number) 0.0801 ${{C}_{1}}$
Number of cultural museums (number) 0.1146 ${{C}_{2}}$
Museum number (number) 0.0722 ${{C}_{3}}$
Number of public libraries (number) 0.0701 ${{C}_{4}}$
Non-private culture, sports, and entertainment employees (number) 0.0720 ${{C}_{5}}$
Culture and related industry employees (number) 0.0580 ${{C}_{6}}$
Cultural-related industrial fixed asset investment (10000 yuan) 0.0735 ${{C}_{7}}$

Activity scale
Art performance audience (10000 people) 0.0666 ${{C}_{8}}$
Training at the Museum of Mass Art and Cultural Museum (number) 0.0650 ${{C}_{9}}$
Literature and art activities of the Museum of Art and Cultural Museum (number) 0.0541 ${{C}_{10}}$
Total circulation of the library (10000 people) 0.0823 ${{C}_{11}}$
Economic
contribution
Cultural industry operating income (10000 yuan) 0.0617 ${{C}_{12}}$
The added value of the cultural industry (100 million yuan) 0.0603 ${{C}_{13}}$
The value-added of the cultural industry accounts for GDP (%) 0.0695 ${{C}_{14}}$
Development level of tourism subsystem Industrial foundation
Travel agency (number) 0.0657 ${{T}_{1}}$
Number of star hotels (number) 0.0662 ${{T}_{2}}$
Number of guest rooms (number) 0.0644 ${{T}_{3}}$
The number of employees (number of people) of accommodation and catering
industry units (number)
0.0660 ${{T}_{4}}$
Market scale Total tourism income (100 million yuan) 0.0665 ${{T}_{5}}$
Total domestic tourism income (100 million yuan) 0.0665 ${{T}_{6}}$
Foreign tourism receipts (10000 USD) 0.0649 ${{T}_{7}}$
Total tourism revenue accounts for GDP proportion (%) 0.0653 ${{T}_{8}}$
Economic
contribution
Domestic tourism average per person (yuan) 0.0686 ${{T}_{9}}$
Shopping and catering costs (yuan) 0.0678 ${{T}_{10}}$
Tour overnight (10000 people) 0.0673 ${{T}_{11}}$
Night tourist income (100 million yuan) 0.0663 ${{T}_{12}}$
Average number of days (number of days) 0.0712 ${{T}_{13}}$
The number of domestic tourists (10000 people) 0.0670 ${{T}_{14}}$
Number of receiving entry tourists (10000 people) 0.0663 ${{T}_{15}}$

2.2 Data source and processing

2.2.1 Data source

In this study, data pertaining to the cultural and tourism industries in Anhui Province and its 16 prefecture-level cities from 2012 to 2021 were collected. The data sources are as follows: 1) Statistical Yearbooks: These include the Urban Statistical Yearbook (2013-2022) for the 16 prefecture-level cities, as well as the China Urban Statistical Yearbook (2013-2022), the China Culture and Related Industries Yearbook (2013-2022), and the China Tourism Statistical Yearbook (2013-2022). 2) National Economic and Social Development Statistics Bulletin: This includes the National Economic and Social Development Statistics Bulletin of the 16 prefecture-level cities from 2012 to 2021. 3) Consultation: Data were obtained online through various government service platforms in Anhui Province, including the Anhui Provincial Bureau of Statistics, the Anhui Provincial Department of Culture and Tourism, the statistical bureaus of the prefecture-level cities, and the cultural and tourism bureaus of the prefecture-level cities. 4) Trend extrapolation: Due to discrepancies in statistical standards among local cities, some data were missing. Time or spatial trend extrapolation methods were employed to interpolate the missing data.

2.2.2 Data processing

The initial step in data preprocessing involves dimensionless processing. Firstly, it is ensured that all relevant indicators are positive, with higher values corresponding to more favorable evaluations. Subsequently, range standardization is applied to render the data dimensionless. To prevent zero values from influencing subsequent numerical processing, a small constant of 0.001 is added. The equation is as follows:
$\begin{align} & {{{{C}'}}_{ij}}=\left( {{C}_{ij}}-{{C}_{j\min }} \right)/\left( {{C}_{j\text{max}}}-{{C}_{j\text{min}}} \right)+0.001; \\ & {{{{T}'}}_{ij}}=\left( {{T}_{ij}}-{{T}_{j\min }} \right)/\left( {{T}_{j\text{max}}}-{{T}_{j\min }} \right)+0.001 \\ \end{align}$
In Equation (1), ${{C}_{ij}}$ represents a certain value of the original cultural industry indicator for the j-th indicator in the i-th year, and ${{C}_{j\max }}$,${{C}_{j\min }}$ are the maximum and minimum values of this indicator, respectively. ${{{C}'}_{ij}}$ is the standardized value, with a range of [0.001,1.001]. ${{T}_{ij}}$ is the value of a certain indicator of the original tourism industry for the j-th indicator in the i-th year, and Tjmax and Tjmin are the maximum and minimum values of the indicator, respectively. ${{{T}'}_{ij}}$ is the standardized value, with a range of [0.001,1.001].

2.3 System analysis

2.3.1 Weight determination

Using the entropy method to determine the weights of each indicator, the average weight calculation for each indicator across 16 prefecture-level cities in Anhui Province is as follows:
$H_{j}^{C}(l)=-\frac{1}{\text{ln}m}\sum\limits_{i=1}^{m}{S_{ij}^{C}}\text{ln}S_{ij}^{C}; H_{j}^{T}(l)=-\frac{1}{\text{ln}m}\sum\limits_{i=1}^{m}{S_{ij}^{T}}\ln S_{ij}^{T}$
$A_{j}^{C}(l)=1-H_{j}^{C}(l); A_{j}^{T}(l)=1-H_{j}^{T}(l)$
$W_{j}^{C}(l)={A_{j}^{C}(l)}/{\sum\limits_{j=1}^{n}{A_{j}^{C}(l)}}\;; W_{j}^{T}(l)={A_{j}^{T}(l)}/{\sum\limits_{j=1}^{n}{A_{j}^{T}}}\;(l)$
$W_{j}^{C}\text{=}\frac{1}{16}\sum\limits_{l=1}^{16}{W_{j}^{C}(l)}; W_{j}^{T}\text{=}\frac{1}{16}\sum\limits_{l\text{=1}}^{16}{W_{j}^{T}(l)}$
In Equations (2) to (5), $S_{ij}^{C}$and $S_{ij}^{T}$ are the standardized values of the j-th indicator of the cultural and tourism industry subsystems, respectively, $m$ is the year number, ranging from 1 to 10 natural numbers, and $H_{j}^{C}(l)$ and $H_{j}^{T}(l)$ are the entropy values of the j-th indicator of the $l$-th prefecture-level city in the cultural and tourism industry subsystems, respectively.$A_{j}^{C}(l)$ and $A_{j}^{T}(l)$ are the redundancies of the j-th indicator of the cultural and tourism industry subsystems, respectively. $W_{j}^{C}(l)$ and $W_{j}^{T}(l)$ are the weight coefficient of the j-th indicator of the l-th prefecture-level city in the cultural and tourism industry subsystems, respectively. $W_{j}^{C}$ and $W_{j}^{T}$ represent the average weight coefficient of the j-th indicator in the cultural industry and tourism industry subsystems, respectively.

2.3.2 Composite index

A comprehensive index model for the development level of the cultural industry and tourism industry subsystems is constructed based on the indicator system and weights.
$C_{j}^{m}(l)=\sum\limits_{m=1}^{10}{W_{j}^{C}}S_{mj}^{C};\begin{matrix} \begin{matrix} {} & {} \\\end{matrix} \\\end{matrix}T_{j}^{m}(l)=\sum\limits_{m=1}^{10}{W_{j}^{T}}S_{mj}^{T}$
In Equation (6),$C_{j}^{m}(l)$ and $T_{j}^{m}(l)$ represent the comprehensive evaluation index of the development level of cultural and tourism industries in the m-th year of the l-th prefecture-level city, respectively. $W_{j}^{C}$ and $W_{j}^{T}$ represent the mean weight coefficients of the j-th indicator in the cultural and tourism industry subsystems, respectively. $S_{mj}^{C}$ and $S_{mj}^{T}$ are the standardized values of the j-th in the m-th year indicator for the cultural industry and tourism industry subsystems, respectively.
For ease of discussion regarding this issue, the comprehensive index for both the cultural and tourism industry subsystems is categorized into nine grades. This classification is based on the principle of 10% equidistant intervals, with the exception of the lowest level, which starts at 20% (Table 2).
Table 2 Stage division of comprehensive index (integration development degree)
Composite index (integration development degree) 0-0.1999 0.2000-0.2999 0.3000-0.3999 0.4000-0.4999 0.5000-0.5999
Gradation Extremely low Very low Lower Moderate to low Moderate
Composite index (integration development degree) 0.6000-0.6999 0.7000-0.7999 0.8000-0.8999 0.9000-1.0000 -
Gradation Moderate to high Higher Very high Extremely high -

2.3.3 Integration development

The integration system judges the coordinated development level of two and above systems. This study used the mutation coefficient method and deduced the integration model.
$CV=\frac{S}{\overline{X}}=\sqrt{\frac{{{(C+T)}^{2}}-4CT}{{{(C+T)}^{2}}}}=\sqrt{1-\frac{4CT}{{{(C+T)}^{2}}}}$
In the Equation (7), the larger the $\frac{4CT}{{{(C+T)}^{2}}}$, the smaller the $CV$, and the higher the system integration. The integration degree can be expressed in the following equation.
$\begin{align} & O_{m}^{l}={{\left\{ \frac{C_{m}^{l}\times T_{m}^{l}}{{{\left[ \left( C_{m}^{l}+T_{m}^{l} \right)/2 \right]}^{2}}} \right\}}^{\theta }}; \\ & OD_{m}^{l}=O_{m}^{l}\times D_{m}^{l}; \\ & D_{m}^{l}=\alpha \times C_{m}^{l}+\beta \times T_{m}^{l} \\ \end{align}$
In Equation (8), $O_{m}^{l}$ represents the integration degree of the cultural industry and tourism industry in the l-th prefecture-level city in the m-th year, $O_{m}^{l}\in [0,1]$; $\theta $ is the adjusting coefficient, set at 0.5 according to relevant research; $OD_{m}^{l}$ is the integration development degree of cultural and tourism industry in the l-th prefecture-level city in the m-th year;$D_{m}^{l}$ is the development level of the cultural and tourism industry in the l-th prefecture-level city in the m-th year. In this study, the mean value of m and n is set at 0.5.
The degree of integration development encompasses both the average development levels of the cultural and tourism industry subsystems, as well as the level of integration between these two subsystems. Based on existing research findings, the degree of integration development is classified into nine progressive stages (Table 2).

2.4 Mechanism exploration

2.4.1 Building a direct impact matrix

According to Bourdieu’s field theory, within the cultural and tourism integration system, each index of the cultural and tourism subsystem contributes to the integration process. This indicates that the integration subjects vie for field interests, guided by their network positions and the connections formed through capital and power. The strength of interaction for each index can be assessed by its proportion within the cultural and tourism integration system. Consequently, this study employs the weighted index of each indicator within the cultural and tourism integration system of Anhui Province and its 16 prefecture-level cities as the baseline for comparison. It further constructs the degree of influence among each index. The matrix $Z$ is constructed by the direct influence between the two factors, where ${{z}_{ij}}$ represents the degree of direct influence of ${{S}_{i}}$ on ${{S}_{j}}$. Here, ${{S}_{i}}$ and ${{S}_{j}}$ represent the weights of the i-th and j-th indicators, respectively.

2.4.2 Direct matrix normalization processing

The normalization matrix is obtained by using the sum of row elements in the matrix, selecting the maximum value, and dividing it by the directly affecting matrix (Cai et al., 2020; Liu et al., 2020).
$C=\frac{Z}{\underset{1\le i\le n}{\mathop{\max }}\,\sum\limits_{j=1}^{n}{{{z}_{ij}}}}$
In Equation (9), $\underset{1\le i\le n}{\mathop{\max }}\,\sum\limits_{j=1}^{n}{{{z}_{ij}}}$ is the maximum value of the sum of rows, and after normalization,${{z}_{ij}}\in [0,1]$.

2.4.3 Calculate the comprehensive impact matrix

The comprehensive impact matrix accumulates direct and indirect impacts among factors to explore the final influence of each factor on the highest-level factor in the system. The calculation equation to represent the comprehensive impact matrix is as follows (Cai et al., 2020):
$T=C+{{C}^{2}}+\cdots +{{C}^{n}}=C{{(I-C)}^{-1}}$
In Equation (10), $I$ is the identity matrix, $T$ is programmed and calculated using Matlab 2016a.

2.4.4 Identification of influencing factors

According to the comprehensive influence matrix T, Equations (11) and (12), used to calculate the influence degree ei as the sum of row elements, indicate the influence of the cultural and tourism integration factor s on other factors. The degree of influence fi is calculated by summing the column elements, calculating the influence of other factors on the integration of culture and tourism. Centrality di is determined by adding the influence degree and the affected degree, reflecting the factor’s position in the evaluation index system and the size of its role. The reason degree gi is calculated as the difference between the influence degree and the affected degree. gi>0, signifies significant influence of factors on others, while gi< 0 indicates a substantial impact by other factors (Cai et al., 2020; Liu et al., 2020).
$\begin{align} & {{e}_{i}}=\sum\limits_{j=1}^{n}{{{c}_{ij}}\begin{matrix} {} & {} \\\end{matrix}}(i=1,2,\cdots,n); \\ & {{f}_{j}}=\sum\limits_{i=1}^{n}{{{c}_{ij}}}\begin{matrix} {} & {} \\\end{matrix}(j=1,2,\cdots,n) \\ \end{align}$
$\begin{align} & {{d}_{i}}={{e}_{i}}+{{f}_{j}}(i=j,\ i,j=1,2,\cdots,n); \\ & {{g}_{i}}={{e}_{i}}-{{f}_{j}}(i=j,\ i,j=1,2,\cdots,n) \\ \end{align}$

3 Result analysis

3.1 Comprehensive index

The calculation results from Equations (1) to (6) are depicted in Figures 1 and 2, illustrating the time series changes in the development levels of the cultural and tourism subsystems across 16 prefecture-level cities in Anhui Province from 2012 to 2021.
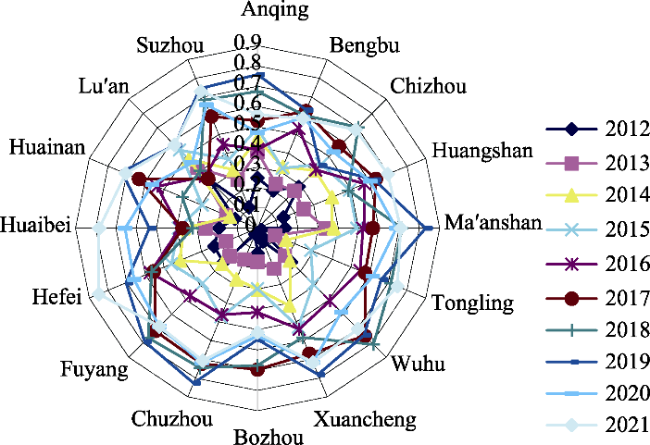
Figure 1 Development level of culture subsystems in 16 prefecture-level cities in Anhui Province from 2012 to 2021
Figure 2 Development level of tourism subsystems in 16 prefecture-level cities in Anhui Province from 2012 to 2021
From a spatiotemporal perspective, the comprehensive index of the cultural subsystem across the 16 prefecture-level cities in Anhui Province from 2012 to 2021 exhibits distinct phased changes. The first phase, characterized by slow growth at a low-to-moderate level, generally spans from 2012 to 2015. During this period, there was notable variation in the timing when different cities’ comprehensive indices for the cultural industry subsystem reached a medium level. For instance, Lu’an reached a medium level of 0.4191 in 2013, followed by Anqing, Chizhou, Ma’anshan, Xuancheng, and Lu'an collectively achieving this level by 2014. By 2015, eight cities had attained this status. The second phase, from 2016 to 2019, marks a period of moderate-to-high level growth. In 2016, fifteen cities reached a medium or higher comprehensive index level. By 2017, Wuhu, Chuzhou, and Fuyang’s comprehensive indices achieved relatively high levels, with six cities attaining higher levels in 2018, including Wuhu reaching a high level. In 2019, nine cities attained relatively high levels, with Ma’anshan and Chuzhou reaching high levels, and Xuancheng and Fuyang approaching this status. The third phase, spanning from 2019 to 2020, represents a rapid decline from high to medium levels, with most cities experiencing a drop of approximately 10 percentage points in their comprehensive indices—from high or relatively high to medium or relatively high levels. The fourth phase includes a period of rapid recovery and growth from medium to high levels. Cities transitioned from medium to relatively high levels, with notable instances such as Hefei achieving a high level or experiencing growth and fluctuations across three sub-stages (lower-medium, medium, upper-medium).
The comprehensive index of the tourism industry subsystem across the 16 prefecture-level cities in Anhui Province from 2012 to 2021 exhibits distinct phased changes. The first phase, spanning from 2012 to 2014, is characterized by slow growth at a low level. In 2013, Chizhou and Huangshan each reached a medium level, with indices of 0.4763 and 0.4769, respectively. By 2014, five cities— Anqing, Chizhou, Huangshan, Hefei, and Huaibei—attained a medium level. The second phase, from 2015 to 2019, marks a period of moderate-to-high level growth. By 2016, all 16 cities reached a medium level in the comprehensive index. In 2017, Wuhu, Xuancheng, Huainan, and Lu’an achieved relatively high levels in their comprehensive indices, and by 2019, six cities attained a high level, with Chuzhou reaching a very high level. The third phase, from 2019 to 2020, signifies a steep decline from high to low levels. During this period, most cities in the province experienced a substantial drop in the comprehensive index of the tourism industry, ranging from 30% to 50%, shifting from high or relatively high levels to low levels. The fourth phase represents a rapid recovery from low to medium levels. Generally, cities witnessed growth within the low-level range, with Bozhou, Chuzhou, Fuyang, Lu’an, and Suzhou—five cities in total—recovering to a medium level.

3.2 Integration development degree

Using Equations (7) and (8), the results are presented in Figure 3, which illustrates the phased characteristics of the integration development degree between the cultural and tourism subsystems across the 16 prefecture-level cities in Anhui Province from 2012 to 2021. The initial phase, spanning from 2012 to 2013, is characterized by rapid growth at a low level. During this period, the integration development degree typically ranged from 0.1000 to 0.3999, indicating very low to low levels of integration.
Figure 3 Integration development degree of cultural and tourism subsystems in 16 prefecture level cities in Anhui Province from 2012 to 2021
The second phase, spanning from 2014 to 2019, reflects moderate to high levels of growth. By 2016, the integration development degree of all 16 cities reached a medium level. In 2017, Wuhu achieved a relatively high level of integration development. By 2018, Wuhu, Chuzhou, and Fuyang also attained relatively high levels. In 2019, four cities reached high levels, with Chuzhou recording the highest integration development degree at 0.8719. The third phase, from 2019 to 2020, signifies a rapid and significant decline from high to medium levels. During this period, most cities experienced a decrease in the integration development degree of their cultural and tourism industries, transitioning from high or relatively high levels to slightly below medium, with some cities falling to even lower levels. The fourth phase indicates a medium-level recovery, where cities generally experienced growth within the medium-level range (Figure 3).
To further delineate the spatial disparities in the integration development degree of culture and tourism among the 16 prefecture-level cities in Anhui Province, temporal and spatial changes in the integration development degree for the years 2012, 2015, 2018, 2019, 2020, and 2021 are illustrated in Figure 4, referencing the standards in Table 2. The year 2012 serves as the baseline year for the study period, characterized by predominant hues of teal or dark blue, indicating a low or very low level of cultural and tourism integration development across the 16 cities. By 2015, notable changes occurred as the overall color tone of the province shifted from teal-blue to light blue, green, or yellow, suggesting an elevation to a medium level of cultural and tourism integration development. This improvement was particularly evident in cities such as Hefei, Lu’an, Anqing in central Anhui, and Ma’anshan and Huangshan in southern Anhui. In 2018 and 2019, two consecutive years reflected continued growth in the province’s cultural and tourism integration development, reaching its peak value prior to the onset of the pandemic. The color tone transitioned to yellow-red in 2019, indicating that the integration development degree had surpassed a medium level province-wide. Cities such as Chuzhou, Wuhu, Ma’anshan, and Xuancheng in eastern Anhui reached higher levels, with a gradual decrease observed from east to central and western regions. The year 2020, impacted by the pandemic, saw the dominant color tone shift to green, signifying that all cities experienced a decline to below-medium or lower levels of cultural and tourism integration development. In 2021, a significant color change occurred, with yellow becoming predominant. This indicates that, except for Bozhou, Huaibei, Anqing, Chizhou, and Ma’anshan, all other cities recovered to a medium level of integration development degree.
Figure 4 Temporal and spatial changes of the integration development degree of culture and tourism in 16 prefecture-level cities from 2012 to 2021

3.3 Mechanism exploration

The evaluation system for the integration development degree of culture and tourism in the 16 prefecture-level cities of Anhui Province encompasses two main subsystems: culture and tourism. The culture subsystem comprises 14 indicators, while the tourism subsystem includes 15 indicators, totaling 29 indicators overall. The calculations, as detailed in Equations 9 to 12 above, yield the results presented in Table 3.
Table 3 Relationship between cultural and tourism integration system factors in 16 prefectural cities in Anhui Province
City Centrality Cause degree: Cause factors (gi>0) Cause degree: Result element (gi<0, compared with absolute value )
Anqing C2>T2>T10>C10>C6>T4>T12>T13>T1>C1 C2>T2>T12>T1>C1>C12>T8>C5>C4>T5 T10>C10>C6>T4>C14>T13>C11>T3>C13>C7
Bengbu C4>T4>C2>T13>C5>C9>C14>T1>T3>T11 C4>C2>C5>C9>T1>T11>C8>C1>T12>T14 T4>T13>C14>T3>C10>C6>C13>T6>T8>T5
Bozhou C14>C4>T1>T4>T13>C6>C9>C5>T2>T15 C14>T1>C9>T15>T10>C10>C7>T8>C1>C12 C4>T4>T13>C6>C5>T2>T9>T11>T7>C2
Chizhou T3>C3>C2>C1>C5>T9>T2>T5>C9>T14 T3>C2>C1>C5>C7>C10>C14>T11>T6>C13 C3>T9>T2>T5>C9>T14>T13>C4>C12
Chuzhou C5>C2>C3>T13>C14>T10>C4>C11>C1>T1 C5>C2>T10>C11>C1>T1>T2>C8>C9>T12 C3>T13>C14>C4>C12>T8>C13>C10>T9>T7
Fuyang C11>T8>C4>C14>T13>C12>C7>T10>C1>T2 C11>T8>C4>C7>T2>C9>C8>C5>T4>T5 C14>T13>C12>T10>C1>C2>T14>C6>T7>C13
Hefei C11>C2>C6>T10>T13>C10>T12>C3>T3>C1>T4 C11>C6>T12>T3>T4>T8>C5>C7>T11>T2 C2>T10>T13>C10>C3>C1>C12>T9>C14>T15
Huaibei C2>C4>C7>T15>C1>T7>C10>T3>T9>C13 C2>C7>C1>T3>C12>T14>T8>T6>T5>T2 C4>T15>T7>C10>C13>T9>T13>T10>C14>C3>T11
Huainan C3>T3>T13>T1>C1>C7>C2>T15>C9>T7 C3>C1>C7>C2>C13>C10>T8>T5>C14>T12 T3>T13>T1>T15>C9>T7>T9>C12>C5>T2>T11
Huangshan C2>C6>T15>C12>C4>T8>T13>T2>C10>C1 C2>T15>T2>C1>T4>C11>C5>T3>T5>T14 C6>C12>C4>T8>T13>C10>T9>T7>T10>T11
Lu’an C4>C2>T3>C10>T13>C7>C11>T14>C1>T11 C4>C2>T3>C11>C1>T2>C9>C3>C14>T1 T13>C10>C7>T14>T11>C13>C6>T10>T8>T5
Ma’anshan C4>T4>C2>C3>C8>T3>T13>C11>C9>C10 C4>T4>C3>C8>T15>T8>C13>C7>T6>T10 C2>T3>T13>C11>C9>C10>C6>C5>T9>C12
Tongling C3>C10>T13>T4>C4>T15>C2>T9>C7>T7 C3>T4>C2>T9>C1>T8>C11>T1>T12>T11 C10>T13>C4>T15>C7>T7>C12>T2>C8>C6
Wuhu T15>T2>C6>C4>T10>T13>C3>T8>T9>C8 T15>C6>T8>C7>C10>C9>C2>C14>C12>C13 T2>C4>T10>T13>C3>T9>C8>T3>T11>C11
Suzhou T7>T4>T13>C10>C1>C2>C5>T11>T2>C4 T7>C1>C5>C3>T3>T10>C12>T9>C14>C13 T4>T13>C10>C2>T11>T2>C4>T15>T14>T1
Xuancheng C4>C12>T13>C5>C2>C7>C11>T9>T7>C9 C12>C2>C7>C11>T7>T8>T15>T5>C13>C14 C4>T13>C5>T9>C9>C3>C6>T3>C1>T4
Frequency C1=10;C2=13;C3=7;C4=12;C5=6;C6=5;C7=6;C9=6;C10=8;C11=6;C12=3;C14=4;T1=5;T2=7;T3=7;T4=7;T7=5;T9=5;T10=5;T11=3;T13=14;T15=6 C1=11;C2=11;C3=5;C4=5;C5=8;C7=9;C8=4;C9=6;C10=4;C11=7;C12=6;C13=6;C14=7;T1=6;T2=7;T3=6;T4=5;T5=6;T6=3;T8=10;T10=4;T11=4;T12=6;T14=3;T15=5 C2=5;C3=6;C4=9;C5 =4;C6=9;C7=3;C9=4;C10=10;C11=3;C12=8;C3=9;C13=6;C14=6;T2=6;T3=6;T4=5;T5=3;T7=7;T8=4;T9=10;T10=7;T11=7;T13=16;T14=4;T15=5
First, the degree of causes is analyzed. The cause degree of gi>0 serves as the causal factor. An analysis of the 16 prefecture-level cities in Anhui Province reveals that both the cultural and tourism subsystems exhibit specific indicators as significant causal factors, as detailed in Table 3. In the cultural subsystem, indicators such as the number of cultural institutions (C1, C2), the number of employees (C5), the scale of cultural activities (C9, C11, C13), and their operating income (C14) emerge as crucial factors. These primarily relate to the industry foundation and activity scale. Conversely, within the tourism subsystem, indicators such as tourism infrastructure (T1, T2, T3, T5) and domestic tourists’ consumption ability (T8, T12) play pivotal roles, which are predominantly associated with the tourism industry’s foundational elements.
The cause degree gi<0 is the result factor. Analysis of 16 prefecture-level cities in Anhui Province reveals that both the cultural subsystem and the tourism subsystem include certain indicators as result factors. Table 3 shows their respective frequencies. In the cultural subsystem, significant outcome factors include the number of cultural institutions (C3, C4) and the number of employees (C6) and the scale of cultural activities (C10, C12). These factors primarily relate to the industry foundation and activity scale. Conversely, in the tourism subsystem, crucial outcome factors encompass the scale of domestic and international tourists (T7, T9, T10, T11) and economic contribution (T14). These factors predominantly reflect market size considerations.
In the cultural and tourism integration system, the primary cause factors and result factors originate from the two criterion layers of the cultural subsystem: industry foundation and activity scale. These factors exhibit mutual causality. Similarly, in the tourism subsystem, causal factors derive from the industrial base criterion layer, while resultant factors pertain to the market scale criterion layer, indicating a sequential relationship between the two.
Furthermore, centrality is analyzed as a pivotal factor influencing the integrated development of culture and tourism across prefecture-level cities in Anhui Province. An analysis of 16 prefecture-level cities reveals specific indicators within both the cultural and tourism subsystems that contribute to centrality, as illustrated in Table 3. The findings indicate that within the cultural subsystem, key centrality factors include industry foundation (C1, C2, C3, C4, C5, C6, C7), activity scale (C9, C10, C11, C12), and economic contribution of the cultural industry (C14). Thus, the industry foundation and activity scale emerge as the primary factors. In the tourism subsystem, the industrial base (T1, T2, T3, T4), market size (T7, T9, T10, T13), and economic contribution (T15) underscore the critical role played by industrial base and market size factors within the tourism subsystem.
Based on the overall centrality analysis, the key factors influencing the cultural and tourism integration system are primarily concentrated within two criterion layers: the industrial foundation and the activity or market scale of both subsystems. The economic contribution criterion layer of the two subsystems demonstrates minimal impact on centrality due to constraints imposed by the degree of causation.

4 Discussion and conclusions

4.1 Discussion

Measuring the integration of the culture and tourism subsystems through a comprehensive index reveals the temporal evolution of synergistic development between these systems, highlighting several key distinctions.
First, it is essential to differentiate between integration and the degrees of integration among systems. Integration refers to the synergistic development of two or more systems, akin to a specialized "field" in physics, involving the transformation and exchange of energy or matter. In contrast, the degrees of integration involve the merging of two or more systems into a unified entity; during this process, the original subsystems’ material or energy coalesces into a newly formed integrated system, thereby constituting a novel material entity or energy field.
Second, this study encompasses the 16 prefecture-level cities of Anhui Province, with each city serving as an independent research subject featuring its own set of indicators requiring individual weighting and standardization. This approach reveals that some cities may not exhibit a high level of integrated development in culture and tourism, yet still demonstrate a relatively high degree of integration development. This discrepancy arises because the comprehensive index method used to measure subsystem development is constrained by the relative changes in comprehensive indices within each city’s system from 2012 to 2021, making direct horizontal comparisons between the 16 cities challenging. To address these challenges, adopting a unified standardization method across all 16 cities would significantly reduce the standardized values, thereby enhancing the clarity of horizontal comparisons between cities. However, this approach may distort the actual self-development indices of individual cities. Therefore, this study employs a compromise: it first individually standardizes each city’s indicator system, then calculates the average value of weights across all 16 cities. This method helps mitigate the impact of individual element fluctuations and improves the comparability between cities on a horizontal scale.
This research focuses on the interplay between capital (power) and action, examining the field of cultural and tourism integration and the strategies of actors within the study area. Culture serves as the pathway, while tourism extends its reach, with cultural capital playing a pivotal role in their integration. Economic capital profoundly influences the deep integration of culture and tourism. Social capital manifests through diverse administrative relationships. Ecological capital, which lies beyond the scope of this study, represents a key direction for future research.

4.2 Conclusions

There are three main conclusions of this study. The first is the comprehensive index evaluation results. The comprehensive index of the cultural and tourism industry subsystems across 16 prefecture-level cities in Anhui Province from 2012 to 2021 reveals distinct phases of change. During the third phase (2019-2020), the cultural industry experienced a sharp decline that was notably more severe than that of the tourism industry. The fourth phase (2020-2021) marked a period of slow, low-level recovery, which lagged behind the pace of recovery in the tourism sector. The degree of integrated development of the culture and tourism industries in these 16 prefecture-level cities in Anhui Province from 2012 to 2021 demonstrates significant phased changes. Influenced by the comprehensive effects of both industries, the decline observed during the third phase (2019-2020) and the subsequent recovery in the fourth phase fluctuated between these two sectors.
The second is the measurement result of integration development degree. From 2012 to 2021, the integration development degree of culture and tourism in the 16 prefecture-level cities of Anhui Province underwent notable stage changes. The comprehensive impacts of the cultural and tourism industries influenced the degree of fluctuation during the third stage (2019-2020), characterized by a decline period followed by a recovery in the fourth stage. In 2019, the integration development degree of culture and tourism in the province reached its peak during the research period. However, in 2020, there was a sharp, cliff-like decline in this degree. Subsequently, the integration development degree of culture and tourism began to experience significant recovery in 2021.
The third is the conclusion of the fusion mechanism. On the one hand, from the degree of reason to analyze,the cultural and tourism subsystems in the 16 prefecture-level cities of Anhui Province reveals various indicators that serve as causative factors. Specifically, within the cultural subsystem, critical aspects include the number of cultural institutions and their employees, the scale of cultural activities, and their operating income. Similarly, within the tourism subsystem, significant factors include tourism infrastructure and the spending capacity of domestic tourists.
Moreover, both cultural and tourism subsystems in these cities exhibit specific indicators as resultant factors. Notably, within the cultural industry subsystem, key outcomes include the number of cultural institutions, the number of employees, and the scale of cultural activities. In contrast, within the tourism industry, the scale and economic contributions of domestic and international tourists are essential outcomes.
On the other hand, the analysis of centrality indicates that both the cultural and tourism subsystems of the 16 prefecture-level cities in Anhui Province feature specific indicators as centrality factors. Within the cultural industry subsystem, important factors include its foundational industry, activity scale, and economic contribution. Conversely, the tourism industry subsystem prioritizes factors such as its industrial base, market scale, and economic contribution.
The rationale behind this finding is the significant contribution of the cultural subsystem to the integrated development of culture and tourism, which surpasses that of the tourism subsystem.
[1]
Apostolakis A. 2003. The convergence process in heritage tourism. Annals of Tourism Research, 30(4): 795-812.

[2]
Cai Y Z, Guo L P, Xu J J. 2020. Study of the influencing factors of the installation willingness to residents’ roof photovoltaic equipment based on DEMATEL-ISM model. Mathematics in Practice and Theory, 50(1): 27-36. (in Chinese)

[3]
Chai S S, Kong L Y, Shan J. 2022. The development mechanism and empirical study of the integration of red literature and tourism from the perspective of symbiosis theory—Taking Taierzhuang Ancient City as an example. Dong Yue Tribune, 43(4): 121-130. (in Chinese)

[4]
Chen B, Xie D. 2019. Research on tourism development of folk literature resources from cultural stratification perspective—Taking the legend of Mulan in Huangpi as an example. Journal of Central China Normal University (Humanities and Social Sciences), 58(6): 130-138. (in Chinese)

[5]
Cheng X L, Zhu Y W. 2012. The integration of tourism industry and culture industry in Anhui Province. Economic Geography, 32(9): 161-165. (in Chinese)

[6]
Connell J. 2012. Film tourism—Evolution, progress and prospects. Tourism Management, 33(5): 1007-1029.

[7]
Corsale A. 2017. Jewish heritage tourism in Bucharest: Reality and visions. The Geographical Journal, 183(3): 261-271.

[8]
Cui F J, Xu N N, Chen X F. 2022. An empirical study of an evaluation index of integrated development of county cultural and tourism. Governance Studies, 38(5): 93-101, 127. (in Chinese)

[9]
Juzefovič A. 2015. Creative tourism: The issues of philosophy, sociology and communication. Creativity Studies, 8(2): 73-74.

[10]
Kim S. 2015. Understanding the historical and geographical contexts of food festival tourism development: The case of the Tatebayashi Noodle Grand Prix in Japan. Tourism Planning and Development, 12(4): 433-446.

[11]
Larson M, Lundberg C, Lexhagen M. 2013. Thirsting for vampire tourism: Developing pop culture destinations. Journal of Destination Marketing & Management, (2): 74-84.

[12]
Li R. 2022. Deep integration and coordinated development: The theoretical logic and practical path of the integration of literature and tourism. Theoretical Monthly, (1): 88-96. (in Chinese)

[13]
Li X J, Song C Y, Yin T T. 2022. Academic rethinking on the integration and development of high-quality cultural tourism: Difficulties and paths. Tourism Tribune, 37(2): 5-6. (in Chinese)

[14]
Liu A L, Yang C Y, Ming Q Z, et al. 2020. Spatial-temporal coordination and driving forces of provincial culture industry and tourism industry in China. Economic Geography, 40(6): 203-213. (in Chinese)

[15]
Liu M F, Chen W. 2020. Research on risk impacting factors of logistics service quality of fresh cold chain front warehouse based on DEMATEL-ISM method. Safety and Environmental Engineering, 27 (1): 118-125. (in Chinese)

[16]
Liu Y J, Zou B K, Han Y J, et al. 2023. The digital economy enables high-quality cultural tourism integration: Mechanisms, channels, and empirical evidence. Tourism Tribune, 38(5): 28-41. (in Chinese)

[17]
Ma Y, Tong Y. 2019. From the region to the field: Re-understanding of the relationship between culture and tourism. Tourism Tribune, 34(4): 7-9. (in Chinese)

[18]
Macintosh R, Gerbert S. 1985. Tourism-basic principles of factor practice. Pu H translated. Shanghai, China: Shanghai Culture Publishing House. (in Chinese)

[19]
McIntosh A J, Prentice R C. 1999. Affirming authenticity consuming cultural heritage. Annals of Tourism Research, 26(3): 589-612.

[20]
Pierre B, Hua K. 2015. Introspective sociology guidance. Meng L, Li K translated. Beijing, China: The Commercial Press. (in Chinese)

[21]
Richards G. 1996. Production and consumption of European cultural tourism. Annals of Tourism Research, 23(2): 261-283.

[22]
Richards G. 2018. Cultural tourism: A review of recent research and trends. Journal of Hospitality and Tourism Management, 36: 12-21.

[23]
Smith V L. 1977. Recent research on tourism and culture change: 1976 symposium. Annals of Tourism Research, 4(3): 129-134.

[24]
Taylor C. 2006. Beyond advocacy:developing an evidence base for regional creative industry strategies. Cultural Trends, 15(1): 3-18.

[25]
Taylor J P. 2001. Authenticity and sincerity in tourism. Annals of Tourism Research, 28(1): 7-26.

[26]
Tao L P, Xu Z L. 2019. The model and path of integration and development of culture and tourism industry with precise poverty alleviation. Journal of Wuhan Polytechnic University, 38(6): 85-87. (in Chinese)

[27]
Wu X M. 2013. The three dimension structure of Mazu Culture tourism field in Meizhou Island: A perspective from anthropology. Tourism Science, 27(2): 83-93. (in Chinese)

[28]
Xu C X, Qian M T, Cheng J. 2017. The level measurement of the integration development of culture and tourism: A case study of Western Hunan. Journal of Huaihua University, 36(2): 1-5. (in Chinese)

[29]
Zhang C Z, Zhu M M. 2020. The integration of culture and tourism: Multi-understandings, various challenges and approaches. Tourism Tribune, 35(3): 62-71. (in Chinese)

[30]
Zhang S B. 2019. The internal mechanism, basic model and industrial development logic of the in-depth integration of cultural industries and tourism. Journal of China University of Petroleum (Edition of Social Sciences), 35(5): 94-99. (in Chinese)

[31]
Zhao S H, Chen T T. 2020. Dynamic analysis and mechanism research of the intergration of cultural industry and tourism industry in ethnic areas. Tourism Tribune, 35(8): 81-93. (in Chinese)

[32]
Zou Y. 2017. Fusion development of tourism and cultural creative industry mechanism—Taking Sichuan Chengdu as example. Reformation & Strategy, 33(7): 126-128, 132. (in Chinese)

Outlines

/