Ecotourism

Multi-dimensional Cultural Perceptions in River Basins: A Case Study of the Yellow River Basin

  • QIN Jing , 1 ,
  • LI Xiaomeng 1 ,
  • HAN Quan 2 ,
  • CHENG Jianquan , 3, * ,
  • TANG Mingdi 1
Expand
  • 1. School of Tourism Sciences, Beijing International Studies University, Beijing 100024, China
  • 2. Department of Hospitality, Hotel Management & Tourism, Texas A&M University, College Station 77840, USA
  • 3. Department of Natural Sciences, Manchester Metropolitan University, Manchester M15 6BH, UK
* CHENG Jianquan, E-mail:

QIN Jing, E-mail:

Received date: 2024-03-20

  Accepted date: 2024-06-20

  Online published: 2025-03-28

Supported by

The National Social Science Fund of China(24BGL137)

The Beijing Municipal Commission of Education(SM202010031004)

Abstract

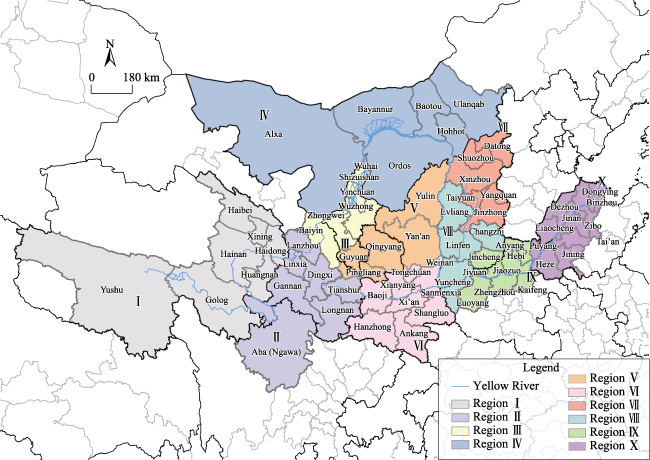
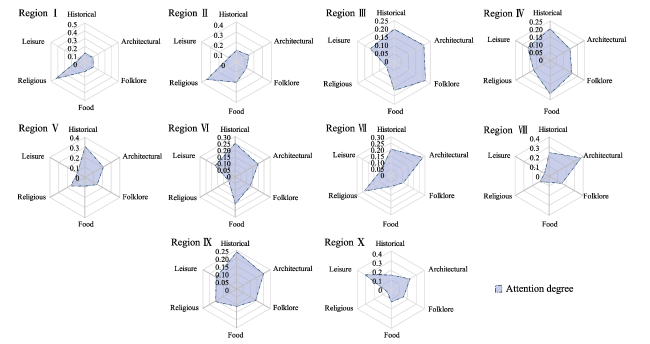
This study introduces a novel framework to dissect and understand tourists' cultural perceptions within river basins. The framework consists of two complementary parts: first, it develops a multi-dimensional system to identify cultural perceptions through textual analysis; second, it uses advanced methods like deep learning and spatial clustering to analyze and compare these perceptions across different cities and regions. The findings from the Yellow River Basin reveal six key dimensions of cultural perception: historical, architectural, folklore, food, religious, and leisure. The basin exhibits three distinct cultural patterns: an upstream polycentric network, a central ‘cultural circle’ around Xi’an, and a city-to-city pattern downstream. Furthermore, the basin is categorized into ten unique cultural perception regions, each highlighting diverse tourist perceptions. This framework not only offers a methodological beacon for future regional tourism studies but also equips managers with strategic insights to enhance the quality and cooperation in river basin tourism development.

Cite this article

QIN Jing , LI Xiaomeng , HAN Quan , CHENG Jianquan , TANG Mingdi . Multi-dimensional Cultural Perceptions in River Basins: A Case Study of the Yellow River Basin[J]. Journal of Resources and Ecology, 2025 , 16(2) : 498 -512 . DOI: 10.5814/j.issn.1674-764x.2025.02.018

1 Introduction

River basins can be viewed as independent geographical units that combine natural, economic, and cultural elements to lay the foundations of civilizations (Macklin and Lewin, 2015). The implementation of UNESCO’s Rivers and Heritage initiative (e.g., integrated river management, the relationship between rivers, and cultural heritage) faces many challenges across all river basins (Wantzen et al., 2023); however, tourism can play an important role in achieving this goal (Xu et al., 2023). In recent years, river basins have become popular tourist destinations owing to their diverse cultures and landscapes, which provide a natural platform for tourists to perceive and experience a destination (Prideaux and Cooper, 2009; Wang et al., 2018). However, the large spatial scale of the river basin makes it difficult to integrate tourism resources, and tourism activities also contribute to the homogenization of destination cultures (Liu et al., 2022). Thus, in the face of increasingly intense market rivalry, the comprehensive planning of local tourism development in the basin from an integrated viewpoint, and the construction of a unique destination image have emerged as two crucial concerns in basin’s tourism growth (Li and Zou, 2021).
The holistic development of river basin tourism emphasizes the importance of synergy and cooperation by breaking down institutional, cultural, and resource barriers between tourist destinations (Wantzen et al., 2016). Existing studies has examined the role of tourism in river basins management from the perspectives of economic cooperation or ecological conservation (Anderson et al., 2019). Although these studies produce thought-provoking results, but we can still expand our perspective, for example, by looking at culture for additional development potential. Because the diversity of cultures is often the distinguishing feature that sets river basins apart from other tourist destinations (Wantzen et al., 2016; Cao and Vazhayil, 2023). Within this unique context, tourism resources in river basins not only possess spatial integrity, cultural homology, and resource complementarity (Weidenfeld, 2013), but also embody rich heritage and regional distinctiveness. It reflects the deeper logic of tourism cooperation in river basins: considering the enduring and intrinsic value of cultural connections (Shi et al., 2014). International examples—such as Europe’s cultural routes and China’s Yellow River Cultural Tourism Belt and National Cultural Park initiatives—demonstrate the central role of culture in river basin tourism (Liu et al., 2023). While unlocking river basins’ economic potential, river basin tourism also acts as a gateway for immersive cultural experiences. Therefore, the effective coordination of these unique local cultures and tourism resources and the creation of a cohesive and appealing basin destination image are crucial challenges in river basin tourism research. Within this context, tourists’ cultural perceptions offer valuable insights.
Tourist perception is a subjective sense about the objective surroundings, which includes nature and culture (Wang et al., 2017). It refers to the process of identifying, experiencing, and disseminating a destination’s culture (Fodness, 1990; Jiang and Yu, 2020), which is also an important aspect in shaping the destination image of a river basin (Mao and Liu, 2006). Tourist perceptions improve their understanding of the local cultures of different cities in a river basin, form an associative “destination image” in their minds, increase their sense of place identity (Hernández et al., 2006; Wei et al., 2022), and may even change their tourism behavior (Lee, 2009; Lu et al., 2022; Ji et al., 2023). For example, Gao et al. (2021) noted that tourists’ perception about cultural heritage affects the emotional bond between tourists and heritage places, which further affects tourism consumption behavior. This human-land interaction contributes to the dynamic narrative of river basin tourism development. This human-land interaction contributes to the dynamic narrative of river basin tourism. Meanwhile, the cultural heterogeneity and homogeneity of each city in the river basin is highlighted in tourists’ cultural perceptions, which can be used to identify the strength or weakness of destination image, and to create an attractive basin brand (Margaryan et al., 2022). However, there are very few studies on tourist’s cultural perception in river basin.
The Yellow River Basin is an important cradle of Chinese civilization and has a rich cultural heritage, making it an exemplary case study. At the same time, tourism development in the Yellow River Basin has challenges such as poor regional connectivity and difficulty in creating brand image. Understanding how tourists interact with tourist destinations, and then striking a balance between “resource supply” and tourists' “cultural demand” to create a tourism brand in the basin, is the primary issue confronting the development of tourist destinations in the Yellow River Basin. This study uses the travelogues, adopts text analysis, deep learning model, spatial clustering, and co-word analysis to build an analytical framework applicable to large-scale regional tourists’ perceptions, including constructing a multi-dimensional cultural perception dimension system, revealing the local cultural perception network connection in the basin, clarifying the spatial difference of tourists' cultural perception and the local imagery of the tourist destination in the basin. This study can provide theoretical support and practical reference to promote the synergistic cooperation between cities in the basin and the construction of the destination image.

2 Literature review

2.1 Tourists’ cultural perception of river basin

The study of river basins, as a special type of tourist destination, began later compared to other places. Flanagan and Laituri (2004) found that tourism utilization of river cultural heritage by residents was an innovative breakthrough in integrated river management, which laid the ideological foundation for later studies on river basin tourism. Early studies on river basin tourism were mainly based on the tourism function of rivers (Predeaux and Cooper, 2009), exploring the resource attractiveness of river basins, tourism planning and development, and tourism experiences, and so on (Fisher, 2006; Shrestha and Stein, 2007). With the development of the experience economy and the emergence of a diversified value orientation in tourism, scholars have focused on tourists’ perceptions of destinations. It has direct implications for tourists’ experiences and satisfaction, destination place-making and influences the sustainable development of destinations (Liu et al., 2023).
Earlier studies have focused on exploring cultural perceptions within specific destination cities or blocks by assessing their perceived value (Zhang et al., 2023b) and evaluating the authenticity and satisfaction tourists derive from these perceptions (Hernández et al., 2006; Sun et al., 2015). Studies have addressed many types of cultural perceptions such as rural culture (Wang et al., 2020), food culture (Criss et al., 2020) and festival culture perceptions (Wang et al., 2021). These efforts aimed to explore destination cultural perceptions from different perspectives. However, research that focuses solely on a single cultural aspect fails to capture the full spectrum of cultural characteristics inherent in tourism destinations. Little attention has been paid to the multi-dimensional cultural perceptions of different destinations (Han et al., 2022) and spatial differentiation (Zou et al., 2022). In terms of study scale, most studies were conducted in a particular city or a small-scale destination, including cultural heritage sites, historic districts or ancient towns (Chen et al., 2022; Wang et al., 2022c), and homestay micro-spaces (Huang and Bing, 2021).
Overall, scholars have made great progress in the study of destination perceptions, but there are certain limitations: First, there is limited study on tourist perceptions in river basin environments. The majority of existing studies focus on micro and meso-scale places, such as recreational districts, scenic spots, and cities, with less studies on larger spatial scales, and the direction and universality of research conclusions must be reinforced. Second, previous studies on tourist’s cultural perception primarily focused on specific cultures, with limited investigation into the diverse cultural perceptions at tourist destinations. In-depth investigations of multidimensional cultural perceptions are required, particularly in large-scale settings such as river basins, where cultural variety of tourism is an important feature.

2.2 Spatial differences of cultural perception

Tourists’ cultural perception vary significantly among regions due to variances in geographical settings and historical cultures. However, past research on cultural perception has primarily concentrated on small-scale investigations, with few studies employing geographical divisions geographic clustering to distinguish between homogeneous and heterogeneous cultures. Some studies have investigated regional differences and structures in food culture (Jiang et al., 2021; Zhang et al., 2021), spatial variations in Chinese place-name culture (Wang et al., 2022b).
Geospatial clustering based on multiple attributes can be used to analyze the spatial differentiation of multidimensional cultural perceptions. For example, hierarchical clustering based on similarity indices is employed to explore regional differences in traditional settlement cultures (Li et al., 2020). Because this method relies on manual identification, it is less appropriate for studying regional differences in multi-cultural systems in a vast, complicated geographical setting. With the development of new geographic information technology in the context of spatiotemporal big data, new data sources and geographical analysis methods have recently been applied to study regional cultural spatial differences. Specifically, points of interest and social media data using algorithms, such as minimum spanning trees and multi-dimensional clustering, are being used to explore local cultural perceptions and disparities (Cheshire et al., 2011; Zhang et al., 2021). In the context of flow spaces, the current research relies mainly on community detection methods that separate communities based on modularity (Shi et al., 2019); however, this method inevitably introduces the ‘exclave phenomenon’ (Qin et al., 2019), where non-contiguous regions are clustered together, which violates the principle of geographically connected boundaries in geographic regionalization. To address this limitation, this study optimized complex network community segmentation methods and proposed a spatial clustering model based on a semantic similarity network. This model incorporated geographical proximity factors to eliminate the exclave effect.

3 Methodology

3.1 Study area

The Yellow River, which meanders through nine provinces and regions, is revered as the cradle of Chinese civilization. The Yellow River Basin spans an area of approximately 7.95×10⁵ km2 and is home to about 20.9% of China’s total population. This basin, with its complex geography and profound historical roots, has fostered a multitude of cultural expressions and distinctive regional identities, such as the Longshan and Yangshao civilizations as well as regional cultures from the Central Plain, Guanzhong, and Hexi corridors, making it a typical example of the complexity, diversity, and variability of river basins around the world. By the end of 2021, the Yellow River Basin was home to 20 UNESCO World Heritage Sites, 32 national-level scenic spots, and 919 national intangible cultural heritage sites, accounting for approximately 30% of similar designations nationwide. This positions the Yellow River Basin as not just a historical trove but also a rich mosaic of diverse cultures, making it a pivotal tourism route.
This study focused on an area in the Yellow River Basin delineated by the Yellow River Conservancy Commission of the Ministry of Water Resources that includes 69 prefecture-level cities (which is the third-level administrative division after provinces and autonomous regions) (Figure 1).
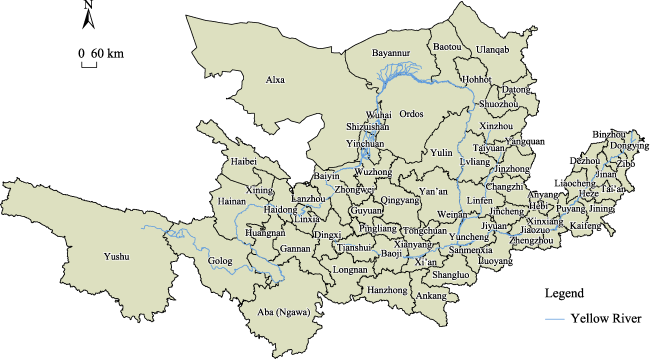
Figure 1 Scope of the study area

3.2 Data description

As a concrete representation of tourists’ perception, travelogue texts have significant advantages over visual symbols such as images. While images can convey abundant information (Deng et al., 2023), they can only reflect tourists' particular focus on certain points during their trip and lack the ability to represent the underlying process of tourists' perception formation and psychological factors such as emotions and feelings. In the process of generating travelogue texts, tourists filter, select, and refine the information they acquired before the trip, their observations and experiences during the trip, as well as their memories, thoughts, and imaginations afterwards, resulting in a focus on specific aspects of the experience. This is an ongoing process of perception that includes both cognitive information and emotional tendencies of tourists. The representation of tourists’ perceptions through travelogue texts has been widely recognized in the academic world and has been extensively applied in related research. Therefore, this study uses travelogue text data to explore the multidimensional cultural perceptions of tourists in the Yellow River Basin. Mafengwo (https://www.mafengwo.cn/), the ‘travel bible’ of young Chinese tourists, boasts a large user base. It generates approximately 3000 travel blogs daily, resulting in a massive volume of data, primarily consisting of long travelogues. These travelogues offer rich and authentic content that covers a wide range of travel experiences from folk customs, architecture and food to cultural experiences (Zhu et al., 2022). These detailed and diverse experiences make them highly suitable for our study on tourists’ multidimensional cultural perceptions. In this study, we address sampling disparity challenges among cities (e.g., provincial capitals, economically developed cities, and their counterparts) using two sampling and data supplementation methods. For cities with more than 2000 blogs, we selected travelogues from odd-dates to balance the sample size and reduce potential selection bias due to too many specific dates associated with holidays or seasonal events. For cities with fewer travelogues, we supplemented the data with travelogues prior to 1 January 2019 to create a robust multi-year dataset. We downloaded all the travelogues from January 1, 2019 to December 1, 2022. All the travelogues contained dates and times, textual captions, blog content, account usernames, and a URL links. A total of 10436 online travelogues were obtained. After excluding non-textual data, duplicate travelogues, and travelogues of low relevance, the final study sample comprised 10113 travelogues with 11171304 characters.

3.3 Analytical methods

This study builds a new framework to dissect and understand tourists' cultural perceptions within river basins. The framework is bifurcated into two distinct yet complementary parts. Firstly, we constructed a multi-dimensional cultural perception indicator system of the Yellow River Basin through a textual analysis to identify the appropriate dimensions of cultural perception. In addition, deep learning and spatial clustering methods were applied to explore similarities and differences in cultural perceptions across cities and regions in the Yellow River Basin. Figure 2 illustrates how these two parts complemented each other to achieve the study’s research objectives.
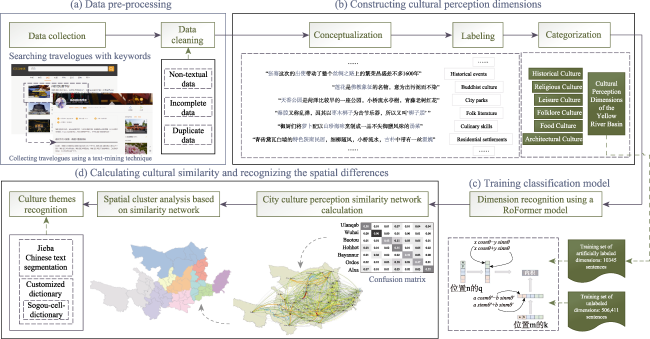
Figure 2 Framework for exploring tourist’s cultural perception

Note: The framework is composed of four parts: (a) Data pre-processing; (b) Constructing cultural perception dimensions; (c) Training classification model; (d) Calculating cultural similarity and recognizing the spatial differences.

3.3.1 Multi-dimensional cultural perception system and text classification

First, a textual analysis was conducted to construct a multi-dimensional perception system with two cycles of text coding and category supplementation. About a fifth of the travelogues were selected and coded sentence by sentence by three researchers. We synchronized and cross-validated the open coding results of the three researchers according to 80% internal code consistency and formed initial concepts
The initial concepts were further refined to distinguish between sub-dimensions and primary dimensions based on the literature (Jia, 2020) and UNESCO cultural heritage classification standards. We selected additional travelogs for inspection and category supplementation, ceasing text encoding when no new concepts or categories emerged. This process produced a multi-dimensional cultural perception system for tourism in the Yellow River Basin with six primary dimensions and 30 sub-dimensions, including historical, architectural, folk, food, religious, and leisure cultures (Table 1).
Table 1 Multi-dimensional cultural perception system in the Yellow River Basin
Primary dimension Subdimension Initial concept examples
Historical culture Historical event Chinese taishan sealing ceremony, Zhang Qian went on a mission to the Western Regions, Battle of Guandu, Princess Wencheng entered Tibet, The long march across the grassland……
Historical celebrity Bo Yi and Shu Qi, Confucius, Genghis Khan, Yue Fei……
Historical allusion To utter a sigh when seeing the vast ocean, Besiege Wei to rescue Zhao, mainstay, Thrice passing the door without entering it……
Historical sites Kaifeng City pile City Ruins site, Tang-Tibet Ancient Road, Yangguan Beacon Tower Ruins, Shuidonggou site……
Architectural culture Residential settlement Silo-Cave, Tibetan folk house, Stone building, Jinnan cave dwelling……
Palace and mansion Tianbo Yang’s Mansion, Wang’s Grand Courtyard, The East Mountain Palace……
Ritualistic buildings The Temple of Confucius in Qufu, Imperial mausoleums, Ancestral hall…
Garden Path in which the scene is always changing, Ggarden heritage of Yuan Dynasty……
Facility The first Yellow River Bridge, Road on the cliff, Water conservancy project, Granary……
Other Modern memorial tower, Ancient tower, View pavilion, The wonder of six towers riding street……
Folklore culture Local custom Go to the Temple Fair, Wedding customs, Sacrifice to the holy eagle, River Lantern Festival……
Folklore The Legend of the Snow Girl, Beast Legends, King Yu tamed the flood, The fairy of Nine lakes descend to earth……
Folk costume Kangba costume, Mongolian women’s headdress, Traditional hand towel in northern Shaanxi, A short Chinese-style coat named ‘dui menmen’……
Folk literature Classic poems, Tangut script, Oral epic of King Gesar, Maiji ballad……
Handicraft Painted pottery art, Manufacturing technique of Sheepskin raft, Lanzhou waterwheel technology, printing……
Performing art Ceremony for Confucius, Qinqiang Opera, Ansai waist Drum Dance, Kangba Song and Dance, Chinese shadow puppetry……
Folk painting and calligraphy Thangka, Mani stone painting, Woodcut……
Folk sports Tai Chi, Three Manly Skills of Mongolia……
Food culture Dietary habit No pork, Favorite Noodles ……
Diet product Mongolian eight treasures, Three representative foods of Mount Tai, 72 kinds of Shaanxi pasta……
Local drinks Highland barley wine culture, Moet liquor culture……
Tea custom Eight Treasures Tea, Zen Tea Culture, Por Tea Culture ……
Cooking skill Double-skin milk technology, fumigated six times air-dried six times……
Kitchenware Chuanshan stove, Earthenware pot……
Religious culture Buddhist culture Prayer flags flutter, Living Buddhas reincarnated, Listen to chanting, Pilgrimage……
Taoist culture Daiyue Taoist Temple, Lao-Tzu, Endless stream of pilgrims in Lao Juntang……
Mohammedanism culture Mosque, Muslim weddings……
Other Christian churches, Catholic churches, The Manihon pedestal……
Leisure culture Cultural place Museum, Art museum……
City parks Spouting Spring Park, Daquan Square, Daming Lake Park……
Leisure consumption place Kuanhouli, Bookstore Street, Quanxiang area, Teahouse
Text mining based on deep neural network models can map complex textual information to a low-dimensional continuous space, structuring fragmented information scattered throughout text materials, thereby improving the accuracy of text information classification and extraction. Based on this perception system, we used RoFormer model to recognize and classify the entire dataset. It is used for natural language processing of massive text, including classification and semantic extraction, which is developed specifically for the Chinese context. Compared to the BERT model based on Transformer, the RoFormer model excels in understanding contextual semantics and handling text at a chapter level (Su et al., 2024). Firstly, we manually labelled travelogue texts (by sentence) using six main dimensions as labels, marking about 500 sentences for each dimension to form a training dataset. Secondly, we trained the RoFormer model using the training dataset and evaluated the results using four indices: accuracy, precision, recall, and F1 score (Viñán-Ludeña and de Campos, 2022). Finally, we used this evaluation to categorize the texts.

3.3.2 Semantic similarity network

This study quantified the semantic similarity of tourists’ cultural perceptions in each city. We obtained a confusion matrix M that not only evaluated the performance of a classification model on the dataset, but also revealed similarity between categories (Wang et al., 2022a). The value at Mij denotes the number of cultural perception texts belonging to city i that are incorrectly predicted to belong to city j. The higher Mij, the more similar the multi-dimensional cultural attributes of the two cities i and j. Diagonal values represent the uniqueness of each regional cultural resource. We then introduced a normalized confusion matrix to illustrate semantic similarity in multi-dimensional cultural perceptions between cities. A key step was setting a threshold to construct a semantic similarity network. The median of all non-zero similarity values among cities is taken as the threshold for constructing the network. A similarity value below this threshold between any two cities implies negligible cultural interaction, whereas a value above this threshold suggests notable cultural commonalities.

3.3.3 Spatial clustering method

In addressing the limitations of community detection methods in flow space research, this study refines the complex network community segmentation approach by introducing a spatial clustering model based on a semantic similarity network. This novel method integrates the strength of network connections and geographic proximity, effectively countering the ‘exclave phenomenon’ by incorporating geographical proximity factors (Qin et al., 2019). The approach, therefore, ensures more geographically coherent community clustering, aligning with the principles of geographic regionalization. The four main steps include:
(1) Defining the interaction strength between cities. To achieve the clustering of a spatial network composed of OD (Origin-Destination) flows, it is necessary to determine whether any two flow nodes can be classified into the same category based on weight values. The multi-dimensional cultural perception similarity between two cities is defined as ‘semantic flow’, whose intensity depends on the magnitude of the cultural similarity value. We define the degree of this similarity between city i and city j as FSij, which equals the data in the i-th row and j-th column of the semantic similarity matrix Mij mentioned above, and the interaction strength between city i and city j as:
FS(ij)= FSij+FSji
(2) Creating a spatial adjacency matrix. To ensure spatial continuity for each region, we need to define the adjacent nodes for each node, which depend on interaction relationships and spatial proximity. As shown in Figure 3, each node Corresponds to a spatial unit. Taking node b as an example, its spatially adjacent and interacting nodes include a, c, e, and f, as shown in Figure 3b. By calculating the bidirectional semantic flow strength between node b and nodes a, c, e, and f, the node with the highest semantic flow interaction strength (assumed to be node f) is selected to form a new seed node group S = {b, f}, as shown in Figure 3c. The adjacent node set for S is the union of the adjacent node sets for seed nodes b and f, which are {a, c, e, g, h, i}. By repeating this process, we obtain a continuous region composed of multiple seed node regions.
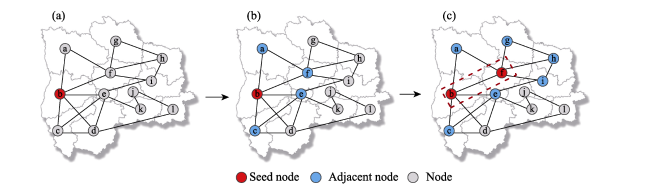
Figure 3 Spatial adjacent nodes of both single node and merged nodes group
(3) Calculating interaction strength. For seed node group S={b, f} from Figure 3c and its adjacent node a, the OD flow (semantic flow) interaction strength FS((b, f) a) is measured as:
$FS\left( \left( b,f \right)a \right)=\frac{FS\left( ba \right)+FS\left( fa \right)}{2}$
where FS(ba) and FS(fa) represent the interaction strengths between b and a, f and a, respectively. For any spatially continuous group of seed nodes, the interaction strength with the i-th adjacent node can be defined as
$FS\left( \left( i\in S \right)j \right)=\frac{1}{n}\sum\limits_{i\in S}{FS\left( ij \right)}$
where n is the number of seed nodes in the seed node group and i represents the individual node in the seed node group.
(4) Merging nodes iteratively to achieve clustering outcomes. By executing a series of iterations, two nodes (or groups) possessing the highest adjacent interaction strength are selected for merging. It is required that these two nodes (or groups) are not already in the same group. This process is repeated until the two selected nodes (groups) no longer meet the constraints, and all individual nodes are clustered into a region.

3.3.4 Co-words analysis

This study used Python to remove inactive words (including prepositions, numbers) and topic-specific high-frequency words (‘tourist areas’, ‘scenic spots’) from the original text. We used HMM algorithm-based Jieba word segmentation to extract high-frequency words related to the different dimensions. Considering that most tourists’ perceived vocabulary included nouns and adjectives, only these word categories were extracted. Finally, we used the term frequency-inverse document frequency (TF-IDF) algorithm to extract key co-words.

4 Results

4.1 Spatial differentiations in cultural perception

The target dataset of multi-dimensional cultural perception was extracted and classified by deep learning methods. The trained model achieved a test accuracy of 0.87562, precision of 0.88183, recall of 0.86615, and F1 score of 0.87230, indicating that the model performed well. As shown in Table 2, 2506411 valid data were selected from 10113 online travelogues: 104655 sentences were identified in the category for architectural culture perception, accounting for approximately 21%; 102788 sentences were identified in the category for historical culture perception, accounting for approximately 20%; 69207 sentences were identified in the category for folklore culture perception, which had the fewest sentences; and the other cultural dimension perceptions each accounted for approximately 15%. Overall, tourists’ perceptions of the different cultural dimensions were balanced. The results show that historical and architectural culture resources are the most important cultural expressions of the Yellow River Basin.
Table 2 Recognition results of deep learning model
Type Precision Recall F1 score Sentences
Historical culture 0.90361 0.80645 0.85227 104655
Architectural culture 0.86131 0.85507 0.85818 102788
Folklore culture 0.89011 0.83505 0.86170 69207
Food culture 0.96258 0.96250 0.96250 74180
Religious culture 0.84956 0.89720 0.87273 76459
Leisure culture 0.84071 0.90476 0.87156 79122
Cultural perceptions within the 69 cities of the Yellow River Basin were classified into five levels: high, medium-high, medium, medium-low, and low. The results, shown in Figure 4, revealed significant spatial differences in the perceived cultural heat of these cities. Historical culture is highly perceived in the middle and lower reaches of the Yellow River, especially in provinces known for their cultural heritage, such as Shaanxi, Henan, Shanxi, and Shandong. Xi’an and Luoyang stand out with high levels of perceptions of historical culture, significantly surpassing other regions. In contrast, perceptions of historical culture are less pronounced in Aba Prefecture and Inner Mongolia. Architectural culture received the most attention in Xi’an, followed by Shanxi, Shandong, northern Henan, Gansu, and Ningxia. Religious culture was mainly perceived in the upper reaches, especially in Tibetan populated area such as the Gannan and Yushu Tibetan Autonomous Prefecture.
Figure 4 Spatial differences in multidimensional cultural perceptions in the Yellow River Basin
In the middle and lower reaches, cities, such as Datong, Xi’an, and Luoyang, showed relatively high levels of perception of religious culture. The folklore culture was highly perceived in Xi’an, Yinchuan, and Luoyang, whereas it was more evenly distributed in other regions. Perceptions of food culture were evenly distributed throughout the Yellow River Basin, where tourists showed a strong interest in the food culture of Xi’an, Qinghai, Gansu, and Shandong. Regarding leisure culture, areas with strong perceptions were mainly concentrated in provincial capitals and neighboring cities in the lower reaches of the Yellow River, with Xi’an and Jinan featuring prominently.

4.2 Spatial clustering based on semantic similarity network

Using deep learning mothed we get a confusion matrix, based on this matrix a semantic similarity network of multi-dimensional cultural perceptions in the Yellow River Basin is drawn (As shown in Figure 5). Cultural centers in the middle and upper reaches of the Yellow River are typically represented by the central cities of their respective regions, such as Xining, Yinchuan, Xi’an, and Hohhot. These cities play an important role as hubs for the spread of regional culture, benefiting from their economic, political, or transportation advantages. Over time, the cultures of the surrounding cities merge with those of the central cities, and the influence of the central cities diffuses into the surrounding areas, gradually forming several cultural clusters with similar customs, values, and cultural landscapes.
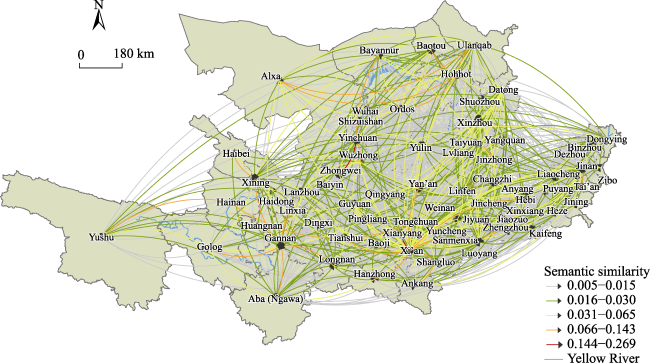
Figure 5 Multi-dimensions culture similarity network in the Yellow River Basin
In the upper reaches of the Yellow River Basin, the Gannan Tibetan Autonomous Prefecture and Xining, located on the border of the Gansu, Qinghai, and Sichuan provinces, have fused Tibetan culture with the characteristics of Longnan and Aba Tibetan Autonomous Prefectures, forming a polycentric cultural network with high similarity in tourists’ perceptions. In the agro-pastoral regions around Yinchuan, Hohhot, Ulanqab, and the Alxa League, local cultures blend and spread between cities, forming a cultural similarity network in which regional central cities are important nodes. In the middle reaches of the Yellow River basin, a ‘cultural circle’ emerged with Xi’an at its center, exerting an influence toward the east and west and radiating toward the north and south. It connects cities such as Baoji, Tianshui in the west and extends to Luoyang in the east, and integrates Yan’an, Xianyang, Baoji, Shangluo, Hanzhong, and other cities in the north and south. However, such characteristics are not evident in Shanxi or in the cities in the lower reaches. Instead, there is a high degree of cultural similarity between cities that are in close proximity, forming city pairs such as Taiyuan-Jinzhong, Linfen-Changzhi, Zhengzhou-Luoyang, and Jinan-Tai’an. This short-distance diffusion and integration of culture between central cities is related to the centrality of cities in Shanxi Province and its lower reaches. Compared to the western region in the middle and upper reaches of the Yellow River, cities in the central and eastern parts of the country have better natural and transportation conditions and a higher degree of openness. Thus, the differences in economic development among cities are smaller, resulting in lower centrality and weaker integration and cultural radiance than in cities in the middle and upper reaches of the Yellow River.
Using a spatial clustering method based on a semantic similarity network, we obtained 20 regions in the Yellow River Basin. Regions with fewer than three cities were merged if the interaction strength between the combined regions exceeded the median of all the non-zero interaction strengths. This merging process was iterated until the selected regions no longer satisfied the constraints, resulting in the final division of the Yellow River Basin into 10 regions, as shown in Figure 6. In terms of spatial distribution, Regions Ⅱ, Ⅲ, Ⅴ, Ⅷ, Ⅸ, and Ⅹ cross provincial boundaries, revealing significant intercommunication and intergradation among neighboring prefecture-level cities in the different provinces. For example, Region Ⅱ includes most of the cities in southern Gansu Province and Aba Prefecture in Sichuan Province; Region Ⅴ includes cities from Shaanxi, Gansu, and Ningxia provinces; Region Ⅷ includes four cities in southern Shanxi Province and Sanmenxia City in Henan Province; Region Ⅸ includes Jincheng City in Shanxi Province and most of the cities in northwestern Henan Province; Region Ⅹ includes Puyang City in Henan Province and nine prefecture-level cities in Shandong Province. From a human geography perspective, Regions Ⅰ and Ⅱ are located in the headwaters of the upper reaches of the Yellow River and are characterized by distinctive ethnic minorities. Regions Ⅲ and Ⅳ cover the Hetao Plain, an area in which agricultural and nomadic cultures converge. Regions Ⅴ, Ⅵ, Ⅶ, and Ⅷ cover the Fen River Basin and the Weihe River Basin, which are tributaries of the Yellow River and are characterized by typical features of the Loess Plateau. Regions Ⅸ and Ⅹ are located in the North China Plain on the lower reaches of the Yellow River, where the characteristics of the Yellow River agricultural culture are concentrated.
Figure 6 Spatial clustering results for multidimensional cultural perceptions

4.3 Differentiation in multi-dimensional cultural perceptions of different regions

To further understand the differences in the cultural perceptions of tourists from different regions, we extracted high-frequency words for each cultural dimension from each region and identified the dominant cultural perception dimensions (the results are shown in Appendix (see website www.jorae.cn for details) and Figure 7).
Figure 7 Differences in cultural perceptions in different regions
Upper reaches: Regions Ⅰ‒Ⅳ. Tourists’ cultural perception is primarily shaped by the influence of multi-ethnic cultures, especially religious and food cultures. Region Ⅰ is characterized by plateau features, where Tibetan Buddhist
cultural symbols, such as the Kumbum Monastery, Living Buddha, Lama, and Prayer Wheel hold a prominent position and leave a lasting impression on tourists. A confluence of ethnicities (such as Han, Tibetan, Hui, Tu, and Salar) has also shaped its food heritage, with standouts being Qingke wine, ‘yak meat, butter tea, and skewers of grilled lamb. Region Ⅱ is notable for landscapes related to the Silk Road. The region serves as a cultural bridge for two-way cultural exchange between the river basin and external regions. However, although there is a keen awareness of the Silk Road, its deeper cultural significance remains less explored. By contrast, richer perceptions are tied to religious aspects, such as Tibetan Buddhism, grottoes, and painted murals, and a vibrant culinary landscape of beef noodles, fermented rice soup, and Tibetan tea.
Region III, located in the Ningxia Plain, features a landscape unique for scenery of Yellow River. It's rich in history, evidenced by sites like the Western Xia Imperial Mausoleum and the Jade Emperor Pavilion. The region's cuisine, reflecting Hui customs, and its cultural offerings, including literary works and folk arts like rock art and paper-cutting, contribute to its diverse cultural identity. Region Ⅳ is known for its grasslands, where generations of ancestors have cultivated a unique culinary tradition with roasted whole sheep, siu mai, milk tea, cheese, and fried rice. Tourist perception of the region’s historical culture is prominent. Historical narratives like ‘Zhaojun married the Huns’ improving ‘Han-Hun nationality relations’ and ‘Yellow River transportation’ promoting ‘economic and trade prosperity’ are also show tourists’ deep concern and understanding of the history of the development of the Chinese nation as a pluralistic society.
Middle reaches: Regions V-IX. Tourists shown high interest in historical and architectural culture represented by ancient building and folk house. Region V has many cities that played pivotal roles in China’s revolutionary history and resonates with memories of China’s ‘Long March’ and other monumental events (e.g., ‘Revolutionary Base’ and the ‘War of Liberation’), which have had a profound impact on Chinese collective memory. Spiritual landscapes are marked by intertwining Confucianism, Taoism, and Buddhism, which resonate with tourists. Folk traditions like the Ansai waist drums dance and Xintianyou (a folksong popular in northern Shaanxi) further enrich the cultural experience.
Region VI, in the Guanzhong Plain, is renowned as the historical ‘Capital of Thirteen Ancient Dynasties’. It played a significant role as a cultural and political hub in ancient China, influencing culture along the Yellow River. Tourists are drawn to its historical sites like the Huaqing Palace, Ancient City Wall, and the Terracotta Warriors, and enjoy local specialties such as roujiamo, mutton soup flatbread, and cold noodles. Region VII, in northern Shanxi, is noted for its historical residential buildings and religious sites. It features architectural marvels from the Great Wall era, like Yanmen Pass, and structures from the Liao and Jin Dynasties, such as Ying County's Wooden Tower. The region also boasts traditional northern dwellings, including Pingyao Ancient City and mountain cave dwellings, along with religious landmarks like the Yungang Grottoes and Mount Wutai, reflecting its spiritual heritage.
Region Ⅷ is rich in historical and cultural narratives, which celebrates the culture of three sub-Jin (traditional Shanxi culture), Jin merchants, and historical figures like Guan Yu, indicating that human dimensions are also key attractions for tourists to the region. The region also boasts numerous wooden buildings from the Tang and Song dynasties, characterized by unique architectural features such as painted clay-molded double brackets and overhangs. The region’s ancient cave dwellings known as ‘silo cave buildings’ also draw significant attention.
Region IX projects a captivating historical image and is known as the Ancient Capital and China’s Origin. In recent years, the region has attracted a considerable number of tourists through the innovative activation and utilization of folk cultural tourism resources represented by Shaolin Kongfu, riverside scene at the Qingming Festival, ‘Iron Flower’ performances, and the legend of the Goddess of Luo River. Religious art like the Longmen Grottoes, ancient city ruins, and the local cuisine, such as Luoyang’s ‘Water Banquet’ and carp from the Yellow River, add to diverse cultural experiences, making this area one of the most enriching regions for tourists to explore and experience.
Lower reaches: Region Ⅹ. This region is attracting increasing attention from tourists because of its famous springs and historical culture represented by Confucianism. Cultural symbols like Mount Tai, the three Confucian sites in Qufu City, and other landmarks vividly embody the distinctive features of Qi and Lu culture. The region’s famous springs (Spouting Spring, Daming Lake, and Five Dragon Pool) and recreational blocks (Kuanhouli and Furong Street) attract many tourists. Cultural offerings are also further enriched by the presence of artistic folk customs represented by acrobatics, Binzhou paper-cutting, and Shandong Opera.

5 Discussion

This study contributes to the literature on this important topic in three ways. First, it broadens current research on destination perception to include river basins, an emerging research field, and it delves deeper into the role of tourists’ perception in destination image development and place- making. The lack of a unified image of river basins is a bottleneck in tourism development (Tang and Jang, 2010). There are limitations to top-down river basin management (Bouckaert et al., 2022). We are able to gain some insight from the market demand side by examining tourists’ cultural perceptions (Zhang and Chan, 2016). From the perspective of place-making, building a river basin’s destination cultural image (tourism branding) requires not only an understanding the overall perceptions of tourists but also knowing the differences in cultural perceptions of different regions within the basin to avoid cultural homogenization. This confirms Lew’s (2017) view that bottom-up place-making behaviors contribute to the co-shaping of tourism places. Furthermore, this study presents a novel approach to characterizing the spatial correlations of multidimensional cultural perceptions by extracting semantic flow of cultural similarity from travelogue text data using deep learning model. Cultural similarity represents the historical value and cultural status of multiple cities in a river basin, and largely determines the dynamics of the evolution of the basin’s tourism network. The similarity network of cultural perception we constructed can largely explain how the cultures of different cities in the river basin influence and connect with each other, and how to build a tourism cooperation network based on cultural connections, which is in line with the work of Krklješ and Nedučin (2023), who created a river culture network using cultural heritage sites along the Danube River to enhance the region’s tourism attractiveness.
Second, this study synthesizes qualitative and quantitative analytical methods, and constructs a framework for large-scale regional studies based on a textual analysis and deep learning, which differs from studies that choose only a qualitative or quantitative model, resulting in study cases that are limited to famous cities with high-level tourism infrastructure (Sun et al., 2015; Wang et al., 2022c). The framework we have constructed can be applied to other large regions beyond river basins, such as urban agglomeration, specific regions, and other large-scale regions studies. In addition, our proposed community detection method based on network similarity and geographic proximity can be applied to research on multidimensional tourism flow networks, city networks, and so on.
Third, this study provides a scientific and practical reference for regional cooperation and cultural synergy in river basin tourism. Li and Zou (2021) concluded that it is necessary to focus on the cultural synthesis of the river basin at a macro level but do not specify a specific path to achieve this goal. Our research examines cultural similarities and spatial differences to observe the cultural uniqueness and cooperation potential of different cities, providing a practical path for tourism development in river basins. 1) In the Yellow River Basin, cities in the upstream form a polycentric network, with Gannan, Xining, Yinchuan, Hohhot as important nodes. In the midstream, a ‘cultural circle’ is formed with Xi'an as the center. To realize the river basin’s integrated and coordinated development, cultural protection, and tourism development, priority should be given to activating the strongest radiation and driving forces of the core cities, and giving full play to their leading and central role (Wang et al., 2018). In the downstream area, there is cultural association pattern of multiple “city pairs”, making it suitable to adopt the tourism regional cooperation path of synchronized development of city groups, gradually expanding the influence of “city pairs”, so as to form multiple dual-core networks in the downstream of the river. In our view, cooperation in river basin tourism can be best developed through cultural connections. This finding is supported by other studies in different scenarios (Zhang et al., 2023a) and proves that multiple cultures are vital to tourism development in river basin (or cross-regional) destinations. 2) Despite the cultural diversity of the Yellow River Basin, tourists still tend to think of the Yellow River as a ‘historical’ river. Investigating the historical culture of the Yellow River and forming a unified cultural brand for the basin can help to shape the overall image of Yellow River tourism by integrating the unique cultural characteristics of each region and providing tourists with a coherent and more complete tourism experience. Regions dominated by composite multi-cultural types, while inheriting historical culture, can also combine the most prominent features of other cultures with diverse cultural offerings and design inter-regional tourism routes. For example, a route could begin with religious culture in Region Ⅰ and Ⅱ, move on to historical sites in Region Ⅵ, architectural art in Regions Ⅶ and Ⅷ, and culminate in expressions of folk art in Region Ⅹ, thus providing tourists with a comprehensive aesthetic and artistic tour of the Yellow River. These findings reflect King’s (2023) observation that a coherent place narrative can add meaning and increase identification.

6 Conclusions and Limitations

6.1 Conclusions

This study took Yellow River Basin as the research area, constructed a framework for the analysis of tourist’ cultural perception in large-scale region, constructed a multi-dimensional cultural perception system through textual analysis of massive travelogues posted on the Mafengwo, used the deep learning model to build a semantic similarity network, introduced the spatial clustering model for cultural perceptions, and analyzed the themes of cultural perception in different clustering regions. The main findings are as follow:
First, a multi-dimensional cultural perception system of the Yellow River Basin by including six primary dimensions and 30 subdimensions was constructed: history, architecture, folklore, food, religion, and leisure. Second, there are significant spatial differences in tourist perceptions of the six cultures in the Yellow River Basin. Marked differences in cultural perceptions across cities have led to different similarity network patterns. It shows a polycentric network pattern in the upper reaches of the river, a cultural ‘circle’ with Xi’an as the core in the middle area, and a ‘city pair’ pattern in the lower reaches. Third, using a spatial clustering model, all cities in the Yellow River Basin were grouped into 10 regions, each with different thematic cultures. Regions Ⅰ-Ⅳ mainly reflect diverse ethnic cultures, with emphasis on religious and culinary cultures. Regions Ⅴ-Ⅸ are characterized by a strong emphasis on historical culture, as well as architectural culture represented by ancient dwellings. Region Ⅹ is strongly associated with leisure culture.
Our study contributes to the literature by proposed a new framework that integrates qualitative and quantitative analyses. It can broaden the scope of tourists’ perceptions from a single destination focus to a broader, multi-city regional perspective, and by clarifying the similarities in tourists' cultural perceptions and their spatial differentiation, which is important for the development of river basin tourism. In practical terms, our study provides significant guidance for the cooperative development of tourism in the Yellow River Basin and offers insights for the sustainable development of tourism in other river basins.

6.2 Limitations and future research

Although this study attempts to provide a detailed discussion of the similarities and differences in the Yellow River Basin’s cultures from the perspective of tourists’ perceptions, which provides inspiration for tourism cooperation in the river basin, there are some limitations. First, this study focused on tourists’ perspectives. However, tourists’ perceptions of the river basin’s cultures are one-sided and may only represent the most unique and readily observed aspects of the Yellow River’s culture. Future research could be conducted from a multi-subject perspective (e.g., stakeholders) to provide multi-value references for tourism development. Especially, it may be more informative to study residents’ perception of the culture of the river basin and to explore the similarities and differences between residents’ and tourists’ perception of the characteristics of the cultural elements. How tourists’ cultural perceptions contribute to place-making in tourist destinations is also an issue that can be further studied in the future. Second, we only took Yellow River Basin as the study area, so the applicability of this research framework in other study areas needs to be further verified by comparative analysis of multiple large-scale regions to further validate the applicability of this research framework. Third, regarding research data, certain biases in travelogues (e.g. the content of travelogues tends to focus on popular tourist destinations, which may not fully reflect the cultural perceptions of lesser-known regions; users of Mafengwo likely being mainly young urban residents, and the bias of demographic characteristics of travelogue data may swim affect the research results; the subjectivity of travelogue content, etc.) might limit the depth of studies on regional tourism cultural perception. Subsequent research could be based on diverse data sources such as field research data, local chronicles, and river basin culture-related books, for in-depth analysis, thus providing a more comprehensive perspective on cultural perception.
[1]
Anderson E P, Jackson S, Tharme R E, et al. 2019. Understanding rivers and their social relations: A critical step to advance environmental water management. Water, 6(6): 1381. DOI: 10.1002/wat2.1381.

[2]
Bouckaert F W, Wei Y P, Pittock J, et al. 2022. River Basin governance enabling pathways for sustainable management: A comparative study between Australia, Brazil, China and France. AMBIO, 51(8): 1871-1888.

[3]
Cao Y X, Vazhayil A M. 2023. River culture in China and India, a comparative perspective on its origins, challenges, and applications. In: Wantzen K M (ed.): River culture—Life as a dance to the rhythm of the waters. France: UNESCO Publishing.

[4]
Chen S Y, Meng B, Liu N, et al. 2022. Cultural perception of the historical and cultural blocks of Beijing based on Weibo photos. Land, 11(4): 495. DOI: 10.3390/land11040495.

[5]
Cheshire J, Mateos P, Longley P A. 2011. Delineating Europe’s cultural regions: Population structure and surname clustering. Human Biology, 83(5): 573-598.

DOI PMID

[6]
Criss S, Horhota M, Wiles K, et al. 2020. Food cultures and aging: A qualitative study of grandparents’ food perceptions and influence of food choice on younger generations. Public Health Nutrition, 23(2): 221-230.

[7]
Deng N, Qu Y J, Cheng X B, et al. 2023. Seeing is visiting: Discerning tourists’ behavior from landmarks in ordinary photos. Current Issues in Tourism, 26(15): 2494-2512.

[8]
Fisher D G. 2006. The potential for rural heritage tourism in the Clarence Valley of Northern New South Wales. Australian Geographer, 37(3): 411-424.

[9]
Flanagan C, Laituri M. 2004. Local cultural knowledge and water resource management: The Wind River Indian Reservation. Environmental Management, 33(2): 262-270.

PMID

[10]
Fodness D. 1990. Consumer perceptions of tourist attractions. Journal of Travel Research, 28(4): 3-9.

[11]
Gao J, Zhang C Z, Zhou X F, et al. 2021. Chinese tourists’ perceptions and consumption of cultural heritage: A generational perspective. Asia Pacific Journal of Tourism Research, 26(7): 719-731.

[12]
Han Q C, Wu T H, Wang J, et al. 2022. Multicultural landscape perception and landscape identity in historical and cultural block in ethic areas. Journal of Arid Land Resources and Environment, 36(3): 195-201. (in Chinese)

[13]
Huang H P, Bing Z H. 2021. Study on the multi-dimensional differentiation of tourists’ cultural perception and local identity in homestay micro-space: Take Shanghai as an example. Geographical Research, 40(7): 2066-2085. (in Chinese)

[14]
Ji G M, Cheah J H, Sigala M, et al. 2023. Tell me about your culture, to predict your tourism activity preferences and evaluations: Cross-country evidence based on user-generated content. Asia Pacific Journal of Tourism Research, 28(10): 1052-1070.

[15]
Jia Y Y. 2020. Tourism culture and the historical changes in the Yellow River Basin. Beijing, China: Science Press. (in Chinese)

[16]
Jiang L, Yu L. 2020. Consumption of a literary tourism place: A perspective of embodiment. Tourism Geographies, 22(1): 127-150.

DOI

[17]
Jiang S J, Zhang H P, Wang H R. et al. 2021. Using restaurant POI data to explore regional structure of food culture based on cuisine preference. ISPRS International Journal of Geo-Information, 10(1): 38. DOI: 10.3390/ijgi10010038.

[18]
King B, Richards G, Chu A M C. 2023. Developing a tourism region through tourism and culture: Bordering, branding, placemaking and governance processes. Tourism Recreation Research, 50(1): 24-38.

[19]
Krklješ M, Nedučin D. 2023. Cultural heritage as a potential for connecting settlements along the Danube River—Case study. Proceedings of the 6th International Conference of Contemporary Affairs in Architecture and Urbanism, 14-16 June 2023. Istanbul, Turkey: Alanya University.

[20]
Lee T H. 2009. A structural model to examine how destination image, attitude, and motivation affect the future behavior of tourists. Leisure Sciences, 31(3): 215-236.

[21]
Lew A A. 2017. Tourism planning and place making: Place-making or placemaking? Tourism Geographies, 19(3): 448-466.

[22]
Li F, Zou T Q. 2021. National culture park: Logical, origins and implications. Tourism Tribune, 36(1): 14-26. (in Chinese)

[23]
Li J, Yang D H, Xiao D W. 2020. Regional differentiation and forming mechanism of cultural landscape of the traditional settlements and vernacular dwellings in Hainan Island. Urban Development Studies, 27(5): 1-8. (in Chinese)

[24]
Liu P L, Yang L G, Su X B. 2023. Tourism, feelings, and the consumption of heritage. Tourism Geographies, 25(5): 1483-1503.

[25]
Liu T T, Ma L, Bao J G. 2022. Place making in tourism: Origin, connotation and application. Human Geography, 37(2): 1-12. (in Chinese)

[26]
Lu Y H, Zhang J, Zhang H L, et al. 2022. Flow in soundscape: The conceptualization of soundscape flow experience and its relationship with soundscape perception and behaviour intention in tourism destinations. Current Issues in Tourism, 25(13): 2090-2108.

[27]
Macklin M G, Lewin J. 2015. The rivers of civilization. Quaternary Science Reviews, 114: 228-244.

[28]
Mao R Q, Liu C Y. 2006. A summary of study on tourism destination image. Tourism Tribune, (8): 40-44. (in Chinese)

[29]
Margaryan L, Prince S, Ioannides D, et al. 2022. Dancing with cranes: A humanist perspective on cultural ecosystem services of wetlands. Tourism Geographies, 24(4-5): 501-522.

[30]
Prideaux B, Cooper M. 2009. River tourism. Wallingford, UK: CABI.

[31]
Qin J, Song C, Tang M D, et al. 2019. Exploring the spatial characteristics of inbound tourist flows in China using geotagged photos. Sustainability, 11(20): 5822. DOI: 10.3390/su11205822.

[32]
Shi S X, Huang K M, Ye D Z, et al. 2014. Culture and regional economic development: Evidence from China. Papers in Regional Science, 93(2): 281-299.

[33]
Shi Y B, Li L, Wang Y G, et al. 2019. Regional surname affinity: A spatial network approach. American Journal of Physical Anthropology, 168(3): 428-437.

DOI PMID

[34]
Shrestha R K, Stein T V. 2007. Valuing nature-based recreation in public natural areas of the Apalachicola River Region, Florida. Journal of Environmental Management, 85: 977-985

PMID

[35]
Su J L, Ahmed M, Lu Y, et al. 2024. RoFormer: Enhanced transformer with rotary position embedding. Neurocomputing, 568: 127063. DOI: 10.1016/j.neucom.2023.127063.

[36]
Sun M H, Zhang X Y, Ryan C. 2015. Perceiving tourist destination landscapes through Chinese eyes: The case of South Island, New Zealand. Tourism Management, 46: 582-595.

[37]
Tang L, Jang S. 2010. The evolution from transportation to tourism:The case of the New York canal system. Tourism Geographies, 12(3): 435-459.

[38]
Viñán-Ludeña M S, de Campos L M. 2022. Discovering a tourism destination with social media data: BERT-based sentiment analysis. Journal of Hospitality and Tourism Technology, 13(5): 907-921.

[39]
Wang B Q, Meng B, Wang J, et al. 2021. Perceiving residents’ festival activities based on social media data: A case study in Beijing, China. ISPRS International Journal of Geo-Information, 10(7): 474. DOI: 10.3390/ijgi10070474.

[40]
Wang F, Xu Y Y, Zhao Y, et al. 2018. Belt or network? The spatial structure and shaping mechanism of the Great Wall cultural belt in Beijing. Journal of Mountain Science, 15(9): 2027-2042.

[41]
Wang F, Yuan C C, Li J N, et al. 2022a. What makes a place special? Research on the locality of cities in the Yellow River and Rhine River Basins based on street view images. Indoor and Built Environment, 31(2): 435-451.

[42]
Wang H R, Zhang H P, Tang G A, et al. 2022b. Inter-city association pattern recognition by constructing cultural semantic similarity network. Transactions in GIS, 26(5): 2225-2243.

[43]
Wang L, Ding J H, Chen M Z, et al. 2022c. Exploring tourists’ multilevel spatial cognition of historical town based on multi-source data—A case study of Feng Jing ancient town in Shanghai. Buildings, 12(11): 1833. DOI: 10.3390/buildings12111833.

[44]
Wang M, Jiang B T, Zhu H. 2017. The spatial perception of tourism destination based on visual methodology: The case study of Guangzhou Redtory. Tourism Tribune, 32(10): 28-38. (in Chinese)

[45]
Wang X G, Zhang X Y, Chen T. 2020. Influencing factors of tourists’ cognition of local nostalgic cultural elements: Take Huizhou region as a case study. Geographical Research, 39(3): 682-695. (in Chinese)

[46]
Wantzen K M, Ballouche A, Longuet I, et al. 2016. River Culture: An eco-social approach to mitigate the biological and cultural diversity crisis in riverscapes. Ecohydrology & Hydrobiology, 16(1): 7-18.

[47]
Wantzen K M, Tharme R, Pypaert P. 2023. River culture: Life as a dance to the rhythm of the waters. Paris, France: UNESCO Publishing.

[48]
Wei H B, Zhou M R, Kang S J, et al. 2022. Sense of place of heritage conservation districts under the tourist gaze—Case of the Shichahai heritage conservation district. Sustainability, 14(16): 10384. DOI: 10.3390/su141610384.

[49]
Weidenfeld A. 2013. Tourism and cross border regional innovation systems. Annals of Tourism Research, 42: 191-213.

[50]
Xu L L, Yu H, Zhong L S. 2023. Evolution of the landscape pattern in the Xin’an River Basin and its response to tourism activities. Science of the Total Environment, 880: 163472. DOI: 10.1016/j.scitotenv.2023.163472.

[51]
Zhang H P, Zhou X X, Tang G A, et al. 2021. Mining spatial patterns of food culture in China using restaurant POI data. Transactions in GIS, 25(2): 579-601.

[52]
Zhang S Y, Chan C S. 2016. Nature-based tourism development in Hong Kong: Importance-performance perceptions of local residents and tourists. Tourism Management Perspectives, 20: 38-46.

[53]
Zhang S Y, Liu J M, Pei T, et al. 2023a. Perception in cultural heritage tourism: An analysis of tourists to the Beijing-Hangzhou Grand Canal, China. Journal of Tourism and Cultural Change, 21(5): 569-591.

[54]
Zhang S Y, Liu J M, Pei T, et al. 2023b. Tourism value assessment of linear cultural heritage: The case of the Beijing-Hangzhou Grand Canal in China. Current Issues in Tourism, 26(1): 47-69.

[55]
Zhu D, Wang J Y, Wang P, et al. 2022. How to frame destination foodscapes? A perspective of mixed food experience. Foods, 11(12): 1706. DOI: 10.3390/foods11121706.

[56]
Zou T Q, Han Q, Qin J. 2022. Pedigree identification and spatial differentiation of the “Millennium Canal” brand genes. Geographical Research, 41(3): 713-730. (in Chinese)

Outlines

/