Rural Revitalization and Agricultural Development

The Willingness to Pay for Clean Heating and Its Influencing Factors in Typical Rural Areas of Northern China

  • DU Xiaolin , 1 ,
  • YANG Xiaoming 1 ,
  • WEI Zhengzheng 1 ,
  • ZHOU Xiaoran 2 ,
  • YANG Hongmei 3 ,
  • ZHAO Mengxue , 1, *
Expand
  • 1. Policy Research Center for Environment and Economy, Ministry of Ecology and Environment of China, Beijing 100029, China
  • 2. Southwest University of Political Science and Law, Chongqing 401120, China
  • 3. Yishui County Landscaping and Environmental Sanitation Service Center, Linyi, Shandong 276499, China
* ZHAO Mengxue, E-mail:

DU Xiaolin, E-mail:

Received date: 2024-02-01

  Accepted date: 2024-06-20

  Online published: 2025-03-28

Supported by

The National Social Science Fund Youth Project(23CFX038)

Abstract

Coal burning is the prevailing way of heating in winter in rural areas of northern China, especially in Beijing, Tianjin, Hebei and their surrounding areas. Regrettably, the direct burning of large amounts of bulk coal is a major contributor to the serious air pollution and frequent heavy pollution days in winter in northern China. It is urgent to find ways for promoting the smooth implementation and sustainable development of clean heating in rural areas, while ensuring affordable heating solutions for rural residents. Conducting research on the WTP of rural residents for clean heating and its influencing factors can provide greater technical support for better promoting clean heating in rural areas. Through field visits and questionnaire surveys in rural areas of Shandong, Hebei, Henan and Shaanxi provinces, data on the willingness of rural residents to pay for clean heating was obtained. A multivariate regression model was then constructed based on the Contingent Valuation Method (CVM) to measure and analyze the willingness of residents to pay for clean heating and its influencing factors. Findings reveal that the highest willingness to pay (WTP) was in Hebei at 2388 yuan and its lowest was observed in Shandong at 1595 yuan, with Henan and Shaanxi registering 1608 yuan and 1929 yuan, respectively. WTP is significantly negatively correlated with age and financial burden of clean heating costs after retrofit. WTP is significantly positively correlated with total household heating hours per year, total household heating area, total household income in 2023, affordable price increase, satisfaction with the overall clean heating project, satisfaction with gas (electricity) prices, satisfaction with heating equipment, and satisfaction with indoor temperature.

Cite this article

DU Xiaolin , YANG Xiaoming , WEI Zhengzheng , ZHOU Xiaoran , YANG Hongmei , ZHAO Mengxue . The Willingness to Pay for Clean Heating and Its Influencing Factors in Typical Rural Areas of Northern China[J]. Journal of Resources and Ecology, 2025 , 16(2) : 447 -456 . DOI: 10.5814/j.issn.1674-764x.2025.02.014

1 Introduction

To strengthen the management of bulk coal for civil uses, in late 2016, Chinese government called for moving forward with the adoption of clean energy sources for winter heating in northern China. Since then, a number of policy initiatives have been introduced. In March 2017, the Report on the Work of the Government called for replacing the use of coal with electricity and natural gas in more than 3 million households. In the same year, ten ministries and commissions, including the National Development and Reform Commission, the National Energy Administration, the Ministry of Ecology and Environment, and the Ministry of Housing and Urban-rural Development, jointly issued the Clean Winter Heating Plan for Northern China (2017- 2021), which clarifies the definition, boundary, targets and path of clean heating. In May 2017, four ministries and commissions, including the Ministry of Finance, issued the Notice on Launching the Pilot Work of Central Finance to Support Clean Heating in Winter in Northern Regions, unveiling the pilot work of clean heating in China. Pilot cities were supported by central finance to adopt clean heating in lieu of bulk coal burning. The demonstration period was three years, with 1 billion yuan allocated to municipalities, 700 million yuan to provincial capitals, and 500 million yuan to prefecture-level cities per year. In March 2021, the General Office of the Ministry of Finance, the General Office of the Ministry of Housing and Urban-Rural Development, the General Office of the Ministry of Ecology and Environment, and the General Administration Department of the National Energy Administration jointly issued the Notice on Organizing the Application for the Clean Heating Project in Winter in Northern Regions (C. B. Z. H. [2021] No. 19), marking that China’s clean heating work has entered a stage of promotion. In addition to the 4 batches of 63 clean heating pilots carried out in the period of 2017-2021, 25 and 12 new pilot cities were launched in 2022 and 2023 respectively.
In recent years, significant progress has been made in clean heating. However, a range of limitations such as high clean heating costs and unavailable subsidies added to the financial burden on farmers, so they were less positive for clean heating retrofit. As a result, the heating effect fell short of expectations, with some regions even experiencing undesirable consequences such as bulk coal re-burning. The clean heating work becomes more challenging in rural areas with poor infrastructure, insufficient financial support and limited economic income of residents.

2 Methodology

2.1 Contingent Valuation Method

The Contingent Valuation Method (CVM), also known as the weighted-variable valuation method and the survey evaluation method, constructs a simulated market and directly asks respondents about their maximum Willingness to Pay (WTP) for the improvement of benefit from environmental goods or the minimum Willingness to Accept (WTA) for the deterioration of environmental quality. Economic value of the improvement of environmental benefit or the loss of environmental quality is finally estimated according to the WTP or WTA results from respondents. Xue (1997) was the first to apply CVM to analyze and evaluate the indirect use value, non-use value and tourism value of biodiversity in Changbaishan Mountain Nature Reserve, thereby vigorously promoting the research work in China. Zhang and Fan (2004), Cai and Zheng (2007) evaluated the economic value of loss of atmospheric pollution and improvement of environmental quality by means of CVM. Cui (2002) and Xu et al. (2004) evaluated the non-use value of Zhalong Wetland and Yaoluoping Nature Reserve, respectively. Liang et al. (2005), Yang and Zhao (2005), Zhao and Yang (2005), Zhang and Liu (2007) evaluated the economic value of river ecosystem restoration and water quality improvement. Liu and Li (2006), Li and Yang (2009) and other scholars exploringly applied CVM to assess the economic loss of environmental pollution in resource exploitation sites. The studies, relevant to this paper, mainly center on WTP for clean energy (Li, 2016; Zhao et al., 2018), as well as WTP for environmental goods and services (Lu et al., 2018). Conditional Logit is also usually used to analyze the influencing factors for WTP of residents for energy efficiency improvement or environmental governance (Wang et al., 2020). In addition, other methods, such as Discrete Choice Model and Comprehensive Analysis Method, are also applied to measure the WTP level and influencing factors (Deng and Xing, 2018), etc. Zhang et al. (2021) studied the willingness to pay for clean heating and its influencing factors in the Beijing-Tianjin-Hebei region, and this paper is broader in scope, choosing four provinces in the northern region.
In this paper, WTP is set as an option with an initial value of 1000 yuan and an additive interval of 1000 yuan, with a maximum of 8000 yuan. The maximum value of the interval is taken as WTP of rural residents for clean heating at the time of measurement, ranging from 1000, 2000 and 3000 yuan. The data related to the factors of such model are accessed as independent variables through questionnaire surveys, and a multiple linear regression equation is established (Eq. 1):
$y=f({{x}_{1}},{{x}_{2}},{{x}_{3}}\cdots {{x}_{i}})$
where dependent variable y indicates WTP of rural residents for clean heating; independent variables x1, x2,$\cdots $, xi indicate the influencing factors for WTP of rural residents for clean heating, such as satisfaction with the current subsidy standard, satisfaction with the current clean heating effect, income level, meteorological factor, etc.
The data analysis consists of three parts, namely descriptive statistics, numerical calculation of willingness to pay and regression analysis of influencing factors. Logit Model is the earliest discrete choice model and the most widely used at present. Therefore, Logit Model is mainly applied to analyze influencing factors. As WTP values present the consecutive dependent variables, multiple linear regression is applied to analyze and obtain the significance level of WTP estimates and influencing factors.

2.2 Questionnaire design and survey

The questionnaire covers basic information on respondents, heating, clean heating, cost, subsidy and satisfaction evaluation. The survey results are used to probe into the current situations of clean winter heating in typical areas of northern China and provide a realistic basis for the promotion and adjustment of the subsequent clean heating policies. The four provinces were chosen because they cover the eastern, central and western heating areas of northern China. A total of 710 valid questionnaires are collected in the questionnaire surveys for respondents with different genders, ages, places of residence and income levels in typical heating areas of northern China. These questionnaires demonstrate representativeness and extensiveness, while the sample data are worthy of in-depth analysis.

3 Results and discussion

3.1 Data sample statistics

Respondents are mainly distributed in Shandong, Hebei, Henan and Shaanxi. Among them, the respondents from Shandong, Hebei, Henan and Shaanxi account for 37.89%, 17.89%, 24.65% and 17.75%, respectively. The male respondents are in the majority, accounting for 59.72%, while the female respondents take the remaining 40.28%. The age distribution of respondents is quite balanced, with the largest proportion of respondents aged 30-40, accounting for 35.49%, followed by respondents aged 40-50, accounting for 29.3%. The proportions of respondents aged 50-60, 19-30 and above 60 successively decrease.

3.1.1 Basic situation of household heating

(1) Heating area
The household heating area distribution of respondents is quite balanced, with 80-100 m2 in the majority, accounting for 28.87%; household heating area of 50-80 m2 and 100-120 m2 hold similar proportions of over 20%; while household heating area of less than 50 m2 and more than 120 m2 account for 10.28% and 16.34%, respectively.
(2) Heating duration
80% of the respondents’ households use heating for three or four months every year. 16.9% of the respondents use heating for less than two months every year, and 3.1% of the respondents use heating for more than five months every year.
(3) Heating methods
Current heating methods: The heating methods, mainly adopted by the respondents, are central heating, wall-mounted gas stove heating and electric heating (such as warm air blower, electric blanket, air conditioner and electrical oil heater). Among these three methods, electric heating accounts for the highest proportion of 25.07%, followed by central heating, 20.85%, and wall-mounted gas stove, 19.58%. Boiler heating and household electric heating hold slightly low proportions of 12.68% and 11.55%, respectively. 3.38% of the respondents adopt water underfloor heating. About 1% of the respondents adopt central air conditioning system and electric underfloor heating (Figure 1). 5.21% of the respondents answer that they have no heating, users who do not use heating are still included in our study.
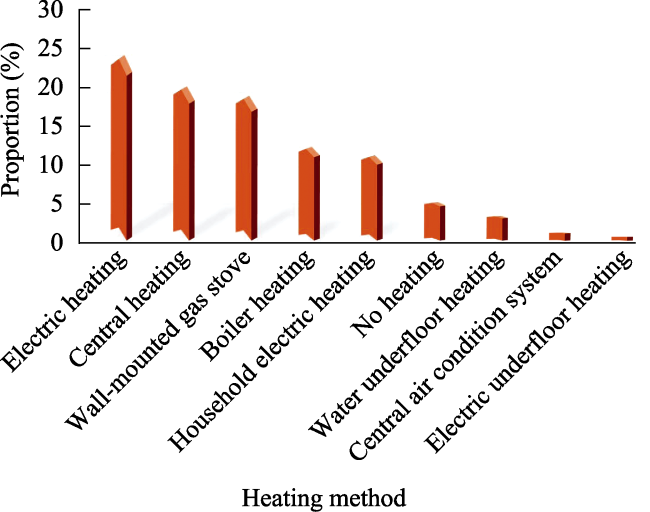
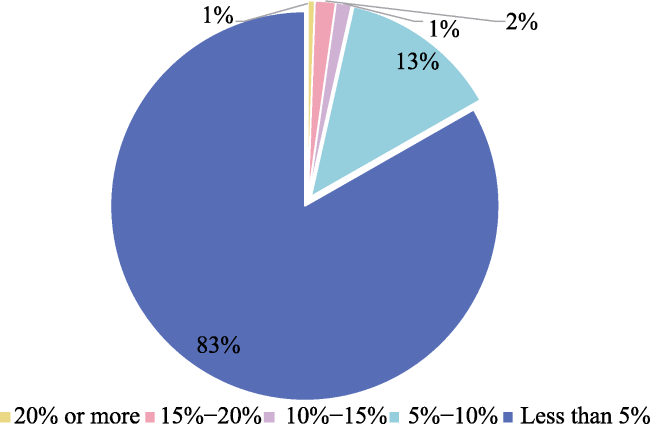
Figure 1 Heating methods of respondents
Reasons for respondents’ choice for heating methods: According to the survey results of the respondents’ reasons for choosing heating methods, “Cleanliness and Environment-friendliness” is the overriding reason, accounting for 59.86%, while “Appropriate price” is also an important consideration for heating methods, accounting for 47.89%. “National requirements” and “Security assurance” account for 29.44% and 27.32%, respectively. In addition, the proportions of “Mandatory use” and “Others” range from 6% to 8% (Figure 2).
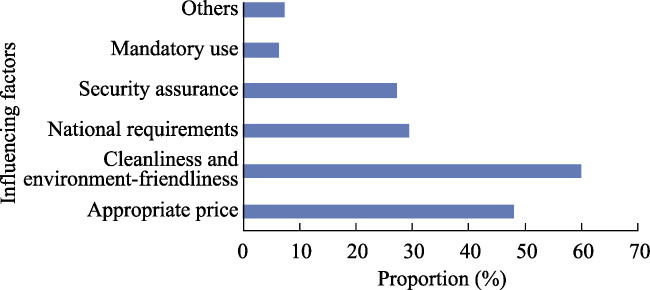
Figure 2 Reasons for respondents’ choice for heating methods
Concerns about heating methods: In terms of concerns about heating methods, the respondents are most concerned about the price factor, accounting for 72.11%. More than 60% of the respondents are also concerned about the heating effect, accounting for 65.92%. In addition, 43%-45% of the respondents are concerned about government subsidies and energy saving, environmental protection and cleanliness, respectively. 31.83% of the respondents are concerned about comfort level. 24.93% of the respondents are concerned about convenience of access. 3.52% of the respondents are concerned about factors other than the above (Figure 3).
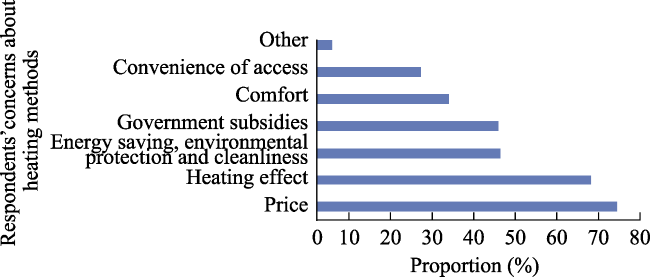
Figure 3 Respondents’ concerns about heating methods
Preferred heating methods: In terms of preferred heating methods, the largest number of the respondents choose natural gas heating, accounting for 40%, which is much higher than the proportion of any other heating method. The respondents, who choose coal-fueled heating and solar heating successively decrease, accounting for 14.23% and 13.38%, respectively. 10%-12% of the respondents choose electric radiator, electric heating equipment and other heating methods, respectively. 8.87% of the respondents choose air conditioner-assisted heating. 1.55% of the respondents choose Chinese kang (heated brick bed) for heating.

3.1.2 Costs and subsidies

(1) Heating costs
Current household heating costs: According to survey results of respondents’ household heating costs, the largest number of the respondents assume the annual household heating costs of more than 2000 yuan, accounting for 30.14%. The proportions of the respondents whose annual heating costs are 500-1000 yuan, 1000-1500 yuan and 1500-2000 yuan successively decrease, accounting for 18%-22%. The smallest number of the respondents assume annual heating costs of lower than 500 yuan, accounting for only 9.15% (Figure 4).
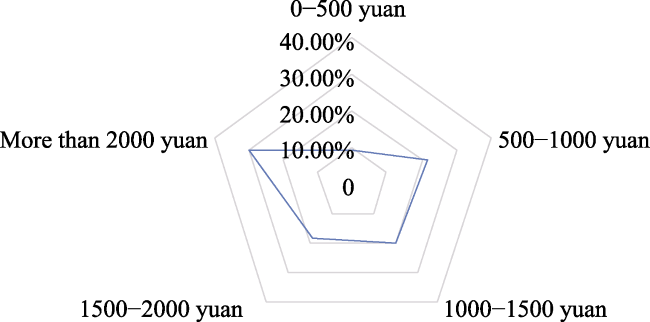
Figure 4 Respondents’ household heating costs
Economic pressure from clean heating retrofit affordability of increasing heating costs: In the surveys, 50.7% of the respondents answer that they have some economic pressures to carry out clean heating retrofit. 22.82% of the respondents answer that they have high economic pressures, outnumbering those who answer that there is no pressure (accounting for 18.45%). 8.03% of the respondents are not sure about the economic pressure from clean heating retrofit.
When asked about affordable price increase, 83% of the respondents choose the smallest of the options, i.e., less than 5%. 13% of the respondents answer that they can afford price increase by 5%-10%. Less than 4% of the respondents can afford a price increase by over 10% (Figure 5).
Figure 5 Affordable price increase of the respondents
(2) Heating subsidies
Attitudes toward government subsidies: When asked about “whether the Government should provide price subsidies for clean heating retrofit projects”, 56.62% of the respondents give a positive answer, 35.35% of the respondents are not sure, and 8.03% of the respondents answer that no price subsidy is given by the Government for this purpose.
Impacts under the scenario of cancelled subsidies: According to survey results of the changes in heating methods that respondents might adopt if heating subsidies are cancelled, the largest number of the respondents choose not to change heating methods, accounting for 42.82%. 34.79% of the respondents answer that they will shorten the heating duration. A similar proportion of the respondents said they will increase other auxiliary heating equipment and use raw coal combustion for heating, accounting for 17%-20%, respectively. In addition, 15.49% of the respondents choose to reduce the temperature of the heating equipment. 10.42% of the respondents answer that they will carry out house insulation renovation, and 8.31% of the respondents choose other ways to pass the warm winter (Figure 6).
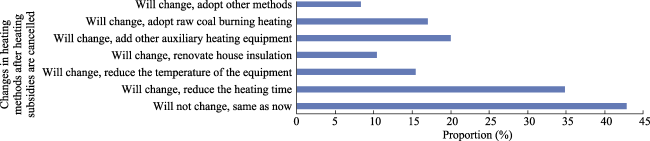
Figure 6 Changes in heating methods after heating subsidies are cancelled
According to survey results of raw coal after the cancellation of heating subsidies, that the largest number of respondents intend to buy raw coal for heating, accounting for 41.97%. Respondents who will not use raw coal are slightly few, accounting for 30.28%. 27.75% of the respondents are not sure about whether they will use raw coal and choose to wait and see before decision making.

3.2 Willingness to pay and influencing factors

In terms of attitudes towards clean heating project, 90.80% of the respondents express their support, whereas only 9.20% of them raise objection. In terms of the effectiveness of clean heating, 88.88% of the respondents feel satisfied that it will be useful to improve the environment, while 11.12% of the respondents express dissatisfaction with the improvement effects.
In terms of the ways to influence the awareness of clean heating, when asked about “whether the government should provide price subsidies for clean heating retrofit project”, 56.62% of the respondents give a positive answer, 35.35% of the respondents are not sure. 8.03% of the respondents argue that the government doesn’t provide price subsidies for this purpose.
In the surveys, 9.20% of the respondents express unwillingness to pay for clean heating for the following reasons: 8% of them argue that the costs increase after clean heating is adopted and they assume financial pressure, 0.70% of them believe that clean heating cannot make a difference, 0.30% of them express unaffordability, and 0.20% of them are merely unwilling to pay.
90.8% of the respondents express willingness to pay for clean heating, and expect improvement in the following aspects by paying related fees: 39.44% of them wish that the living environment (air quality) will become better, 31.41% of them wish that the indoor temperature will be higher and the heating effect will go better, 34.23% of them expect more appropriate maintenance and post-management of heating equipment, and 29.15% of them expect more reasonable price of natural gas or electricity usage.
Correlation analysis is applied to screen the factors, and then regression analysis is applied to analyze the influencing factors of WTP for clean heating. The results are as shown in the Tables as below.

3.2.1 Reliability test

Generally speaking, the Alpha (α) Coefficient should be greater than or equal to 0.6. The higher value of this coefficient implies the better reliability. As can be seen from the table, the reliability coefficients of the scale questions are high. It is argued that measurement indicators of variables herein demonstrate a certain degree of internal consistency reliability and the survey data are relatively authentic (Table 1).
Table 1 Reliability statistics
Statistical content Cronbach’s Alpha Cronbach’s Alpha based on standardized terms
Questionnaire 0.771 0.781

3.2.2 Validity test

Validity is tested by KMO and Bartlett’s Sphericity Test. Validity test is used to verify whether the variables are independent of each other through the sphericity test. According to its measurement criteria, the KMO value is greater than 0.8, while the significance of the statistical value of Bartlett’s Sphericity Test is less than 0.001. Good validity of the data is supposed (Table 2).
Table 2 KMO and Bartlett’s sphericity test
KMO measure of sampling adequacy Bartlett’s sphericity test
Approximate chi-square Degree of freedom P-value
0.836 2284.322 15 <0.001

3.2.3 Difference analysis

In this paper, the amount of residents' willingness to pay is measured by contingent valuation method, and the average amount respondents pay for clean heating is 1803 yuan/month.
The proportions of the annual amount the respondents are willing to pay are given as follows: ≤1000 yuan, accounting for 9.15%; 1000-2000 yuan, accounting for 55%; 2000-3000 yuan, accounting for 30.25%; 3000-4000 yuan, accounting for 3.30%; 4000-5000 yuan, accounting for 2.10%; 5000-6000 yuan, accounting for 0.20%; and more than 6000 yuan, accounting for zero.
Differential analysis is made on subjects from different provinces. Significance of less than 0.05 indicates significant difference. The highest and lowest scores of WTP are registered in Hebei (mean value of 2388 yuan) and Shandong (1595 yuan), respectively. The scores of WTP are 1608 yuan and 1929 yuan in Henan and Shaanxi, respectively, as shown in Table 3 and Table 4.
Table 3 Description of willingness to pay
Province Number of cases Mean value Standard deviation Standard error 95% of the mean value confidence interval Minimum value Maximum value
Lower limit Upper limit
Hebei 127 2388.19 434.13 38.52 2311.95 2464.42 525.00 3125.00
Henan 175 1608.00 681.62 51.53 1506.30 1709.69 525.00 2750.00
Shandong 269 1595.17 678.15 41.35 1513.76 1676.57 525.00 3125.00
Shaanxi 126 1928.97 719.13 64.07 1802.17 2055.76 525.00 3125.00
Total 697 1803.23 715.44 27.10 1750.02 1856.43 525.00 3125.00
Table 4 ANOVA of willingness to pay
Category Sum of squares Degrees of freedom Mean square F P-value
Inter-group 63763669.920 3 21254556.640 50.360 <0.001
Intra-group 292482816.800 693 422053.127
Total 356246486.700 696

3.2.4 Correlation analysis

This paper further conducts a correlation analysis of the factors influencing the cost of paying for clean heating, as shown in the Table 5.
Table 5 Correlation analysis
Factors Correlation and Significance Willingness to pay
Age Correlation -0.085*
Significance 0.024
Annual total household heating duration Correlation 0.342**
Significance <0.001
Total household heating area Correlation 0.396**
Significance <0.001
Total household income in 2023 Correlation 0.216**
Significance <0.001
Affordable price increase Correlation 0.090*
Significance 0.018
Financial pressure to bear heating cost after the clean heating retrofit, Yes or No? Correlation -0.135**
Significance <0.001
Satisfaction with the overall clean heating projects Correlation 0.122**
Significance 0.001
Satisfaction with raw coal heating Correlation -0.043
Significance 0.260
Satisfaction with the natural gas (electricity) price Correlation 0.259**
Significance <0.001
Satisfaction with heating equipment Correlation 0.221**
Significance <0.001
Satisfaction with indoor temperature Correlation 0.210**
Significance <0.001

Note: *, ** indicates that the correlation are significant at the 0.05, 0.01 level, respectively.

Correlation analysis refers to a process of describing and analyzing the nature of the interrelationship between two or more variables and their degree of correlation. If the correlation coefficient is higher than 0, this indicates positive correlation between two variables. If the correlation coefficient is lower than 0, this indicates negative correlation between two variables.
Therefore, it can be seen from the above table that willingness to pay is significantly and negatively correlated with age, financial pressure to bear the heating cost after clean heating retrofit. Willingness to pay is significantly and positively correlated with annual total heating duration, total household heating area, total household income in 2023, affordable price increase, satisfaction with the overall clean heating project, satisfaction with natural gas (electricity) price, satisfaction with heating equipment, and satisfaction with indoor temperature.

3.2.5 Regression analysis

As proved above, willingness to pay is significantly and negatively correlated with age, financial pressure to bear the heating cost after clean heating retrofit. Willingness to pay is significantly and positively correlated with annual total heating duration, total household heating area, total household income in 2023, affordable price increase, satisfaction with the overall clean heating project, satisfaction with natural gas (electricity) price, satisfaction with heating equipment, and satisfaction with indoor temperature. Therefore, further regression analysis is made (Tables 6-8).
Table 6 Model summary
Model R R2 Adjusted R2 Error of standard estimation
Goodness-of-fit test 0.552a 0.305 0.295 600.820

Note: a. Dependent variable: willingness to pay.

Table 7 F test data table (ANOVAa)
Model Sum of squares Degree of freedom Mean square F P-value
Regression 108610717.400 10 10861071.740 30.087 <0.001
Residuals 247635769.400 686 360985.087
Total 356246486.700 696

Note: a. Dependent variable: willingness to pay.

Table 8 Regression model coefficient dataa
Model Unstandardized coefficient Standardized coefficient t P-value
B Standard error Beta
Constant 99.269 174.557 0.569 0.570
Age ‒4.600 22.736 ‒0.007 ‒0.202 0.840
Annual total household heating duration 262.665 31.045 0.279 8.461 <0.001
Total household heating area 147.501 21.157 0.251 6.972 <0.001
Satisfaction with natural gas (electricity) price 45.044 34.138 0.072 1.319 0.187
Satisfaction with heating equipment 73.859 49.149 0.105 1.503 0.133
Satisfaction with indoor temperature 17.213 44.850 0.026 0.384 0.701
Total household income in 2023 111.202 26.098 0.148 4.261 <0.001
Affordable price increase 134.088 38.211 0.113 3.509 <0.001
Financial pressure to bear the heating cost after clean heating retrofit ‒86.528 30.196 ‒0.102 ‒2.866 0.004
Satisfaction with the overall clean heating project 34.795 22.780 0.053 1.527 0.127

Note: a. Dependent variable: willingness to pay.

According to the results of goodness-of-fit test, R-squared is 0.305, which indicates that the portion of the dependent variable that can be explained by the regression equation is 30.5%. The significance of F-test is less than 0.05 and reaches the significance level, which indicates that the established regression model is effective.
The significance of annual total household heating duration, total household heating area, total household income in 2023 and affordable price increase are less than 0.05, and the regression coefficient is greater than 0, indicating a significant positive effect on willingness to pay. The significance of financial pressure to bear the heating cost after clean heating retrofit is less than 0.05, and the regression coefficient is less than 0, indicating a significant negative effect on willingness to pay. The significance of other variables is greater than 0.05, without significant effect on willingness to pay.
A non-standard equation is obtained when B coefficient is put into the equation:
W=262.665×A1+147.501×T1+111.202×T2+134.088×A2-86.528×F
Bringing in the Beta coefficient, a standard equation is obtained:
W=0.279×A1+0.251× T1+0.148 × T2+0.113× A2-0.102×F
where W represents willingness to pay; A1 represents annual total household heating duration; A2 represents affordable price increase; T1 represents total household heating area; T2 represents total household income in 2023; F represents financial pressure to bear the heating cost after clean heating retrofit.

4 Discussion and conclusions

4.1 Promotion and use

4.1.1 Clean energy has been gradually promoted, and sustained efforts are of great importance

From the perspective of the promotion of clean energy in the areas where the respondents are located, most of the respondents believe that “clean energy has been fully promoted”, but accounting for less than 40%. Those who believe that ““clean energy has been extensively promoted” and “partially promoted” respectively account for nearly 25%. A small number of the respondents either believe that “clean energy hasn’t been promoted”, or know nothing about the relevant situation. Evidently, promotion of clean energy has come to results and known to most respondents, but it is still necessary to expand the extent and scope of the promotion, with a view to underpinning the trend of energy mix readjustment.

4.1.2 Clean heating has played mainstream role, and clean and environment-friendly style is well recognized

At present, the respondents generally use wall-mounted gas stove, electric radiator and other gas heating approaches, as well as electric heating. Nearly 80% of the respondents use clean heating, less than 20% of the respondents use boilers for heating, and a small number of the respondents do not adopt heating. According to the results prove, the overriding reason for choosing the current heating methods is “Cleanliness and Environment-friendliness”, which is recognized by more than 50% of the respondents. Nearly 50% of the respondents choose the current heating methods because of “Appropriate Price”. 20%-30% of the respondents choose the current heating methods because of “National Requirements” and “Security Assurance”, respectively. It can be seen that even though national requirements play a role in promoting clean heating to some extent, factors related to cleanliness and price play a steering role, making clean heating recognized by the public. When it comes to “replacing coal with electricity” and “replacing coal with gas”, 51.5% of the respondents express that it is acceptable. “Acceptability” is only a basic level of acceptance, and it is conceivable that dissatisfaction at varying degrees may arise in the subsequent work. In addition, 6% of the respondents answer that they are unwilling to accept “replacing coal with electricity” or “replacing coal with gas”, implying that many preliminary explanation and clarification efforts should be made if the retrofit is to be accepted by the residents.

4.2 Costs and subsidies

4.2.1 The heating cost is still acceptable, and price increase may be impeded

The average household heating area of the respondents is 87.32 m2, which is calculated through median weighting. More than 80% of the respondents’ heating duration within 3-4 months. Evidently, the people still have great demand for heating. More than 30% of respondents bear annual household heating cost of more than 2000 yuan, more than 50% of the respondents bear annual heating cost of more than 1500 yuan. Nearly 20% of the respondents bear annual heating costs of 500-1000 yuan and 1000-1500 yuan, respectively. The median annual household heating costs of the respondents range within 1500-2000 yuan. Corresponding to heating costs, more than 70% of the respondents earn annual household income of 10000-60000 yuan, with the median annual household income of slightly above 30000 yuan. Annual household heating cost from the median perspective is about 5% of annual household income.
Nearly 50% of the respondents answer that they have some financial pressure to bear the heating cost after clean heating retrofit, and about 75% of respondents answer that they have some financial pressure and high pressure. According to the surveys of the affordable price increase of clean heating, more than 80% of the respondents only choose the smallest value of the options, that is, less than 5%. It can be seen that for the respondents, the current heating costs are still acceptable, but the acceptance of price increase is quite limited.

4.2.2 There is a general acceptance that the government provides subsidies, and multiple countermeasures will be taken if such subsidies are cancelled

In the surveys of respondents' attitudes toward government subsidies for clean heating, except for nearly 50% of the respondents who know nothing about the relevant situation, about five out of six respondents believe that the Government should provide subsidies. Evidently, the Government is endowed with great responsibility by the public to provide subsidies in the promotion of clean heating retrofit.
Even if the clean heating subsidies are cancelled, nearly 40% of the respondents answer that they will not change heating methods, and the people will generally cut heating expenses by reducing heating duration, increasing heating equipment and adjusting heating temperature. If subsidies are cancelled, the respondents take into account using raw coal for heating, refuse to use raw coal for heating, and are not sure about whether to use raw coal under wait-and-see attitude account for the one-third, respectively. Evidently, even if clean heating subsidies are cancelled, respondents' tendency to use raw coal will be also weaker than that before the promotion of clean heating.

4.3 Satisfaction and tendency

4.3.1 Heating price is the weakness factor in satisfaction assessment

Since winter heating represents a type of inelastic demand of household life in typical Northern China, the people are highly concerned about price factor. In the multi-factor satisfaction assessment of clean heating, natural gas/electricity price registers the lowest score and becomes the weakness factor in the satisfaction assessment of clean heating.

4.3.2 Heating effect satisfaction still needs to be improved, and insulation retrofit project may be promotable

In addition to the heating price, satisfaction assessment of heating effect is still unsatisfactory. Whether it is warm is also such a core issue that respondents pay close attention to. The heating effect is related to heating equipment and the heat insulation property of the family houses. Although the respondents are slightly satisfied with the heating equipment, there is still room for improvement. According to the survey results, nearly 25% of respondents have currently carried out heat insulation retrofit for their houses. 75% of the respondents have not carried out heat insulation retrofit in their houses as yet. The heating effect may be improved in future by promoting and implementing the approaches to heat insulation retrofit.

4.4 Summary of household clean heating retrofit

4.4.1 Fruitful retrofit on the whole

With holistic insights into clean heating in typical Northern China, this paper has reaped significant outcomes. Firstly, most of the respondents, who have carried out clean heating retrofit, positively evaluate clean heating retrofit. Positive evaluations are dominant in all aspects of retrofit. In other words, such retrofit has met the needs of households in typical Northern China for clean heating retrofit on the whole.

4.4.2 Heating prices and effectiveness need to be further improved

At present, clean heating retrofit has been generally accepted by residents in Northern China, with recognized advantages of cleanliness, convenience and safety. Prices and subsidies are still emphasized by residents. How to make residents pass the warm winter at an acceptable cost is still the core issue for competent authorities in the coming days. According to the survey results it is unadvised to raise heating prices due to the potential high resistance. In case of shrinking subsidy coverage or gradually reduced subsidies, residents may resort to coal for winter heating again.
With a view to promoting the long-term maintenance of the effectiveness of clean heating work in Northern China, in addition to adjusting the relevant costs and subsidies, heat insulation retrofit for houses can be promoted when necessary, achieving more desirable heating effect under the same energy consumption measurements.

5 Implicaitons

5.1 To continue to promote surveys of household clean heating retrofit

For the problems revealed by the respondents in the surveys, such as equipment vulnerability, high price and poor heating effect, the pertinent solutions need to be developed for subsequent implementation. In response to equipment vulnerability and poor heating effect, on one hand, feedbacks are given to the corresponding manufacturers who are requested resolve quality problems poor heating effect of the products. On the other hand, the products with satisfying feedback will be promoted. In response to high price, efforts will be made to analyze realistic expenditure, develop the solutions and dispel doubts at the time of the household clean heating retrofit.
With the continuous introduction of national policies, new funds, technologies and talents are flooding into the clean heating industry, boosting the rapid popularization of clean heating in China and injecting new vitality to related industries. However, improper management, substandard products and poor operation and maintenance services are also often found in some enterprises, hindering residents' winter heating. It is advised to strengthen market supervision of the clean heating industry in various regions, enforce stricter market access criteria, steer the formation of a standardized and orderly upstream and downstream integrated industry chain, propel the endogenous growth of the industry, and robustly underpin high-quality and sustainable development of clean heating.

5.2 Continuous follow-up of the effects of clean heating retrofit

The follow-up effect of the clean heating retrofit will come out in the winter heating period of each subsequent year. After the installation, new problems will continue to arise in the equipment use and maintenance, the heating temperature adjustment, subsidies, the equipment adjustment after house retrofit and the changes in heating requirements after family structure adjustment, etc. Therefore, in order to guarantee the good follow-up effect of clean heating retrofit, on one hand, adequate preparation should be made for service support, including equipment replacement and maintenance, subsidy allocation and adjustment, etc. The simple and convenient troubleshooting channels and contacts must be available for all possible problems. On the other hand, a regular census of residents needs to be done so as to summarize and give feedback on the retrofit effects and problems. Only by solving the problems of clean heating retrofit in a long-acting manner can the favorable project effect will be achieved in the long term.

5.3 Stage-by-stage planning of subsidy policy

During the clean heating retrofit, the subsidies are quite high in various regions, which substantially reduces the vast majority of rural residents’ expenses for winter heating. From the perspective of the current income structure of the respondents, such cost savings have a great impact on the rural residents themselves. Therefore, maintaining equity in project promotion can effectively alleviate resistance to the project, but if subsidy adjustment under “one-size-fits-all approach” is adopted at the subsequent subsidy policy adjustment phase, a large number of rural households will inevitably return to the “coal-fired heating” due to the great adverse impact on the actual work. Therefore, it is completely important to analyze the affordability of heating costs for different groups, the impact of heating subsidy policy adjustment on each household and develop more detailed and phased subsidy policies before harvesting fruits of clean heating retrofit in Northern China.
Various regions should fully assess the financial support capacity for clean heating, the cost of the engineering restructuration and operation of enterprises and the affordability of residents, and develop reasonable winter heating prices for electricity and natural gas usage and the appropriate subsidy policies. While fully stimulating enthusiasm of enterprises, as the clean heating work as is concerned, it is also necessary to set the price within the affordable range of residents, ensure the continuity of the clean heating policies, and prevent residents from abandoning clean heating equipment and using bulk coal again.
[1]
Cai C G, Zheng X Y. 2007. Willingness to pay for health losses from air pollution in Beijing. Economic Science, (1): 107-115. (in Chinese)

[2]
Cui L J. 2002. Evaluation of monetization of wetland value in Zhalong, Journal of Natural Resources, 17(4): 451-456. (in Chinese)

[3]
Deng Q H, Xing C B. 2018. Willingness to pay for air quality: An econometric approach based on migration decision-making. Studies in Labor Economics, 6(6): 23-43. (in Chinese)

[4]
Li G P, Yang Y. 2009. User cost of the exploitation of coal and oil & natural gas resource and value compensation in China. Journal of China University of Geosciences (Social Sciences Edition), 9(5): 36-42. (in Chinese)

[5]
Li T. 2016. The public’s willingness to pay for different clean energies: Evidence from a contingent valuation survey in Shandong Province, Diss., Jinan, China: Shandong University. (in Chinese)

[6]
Liang Y, Cheng S K, Min Q W. 2005. Residents’ willingness to pay for improving urban water environment. Journal of Hydraulic Engineering, 36(5): 613-623. (in Chinese)

[7]
Liu Z G, Li G P. 2006. The environmental damage and economic value in nonrenewable energy resources exploitation in northern Shaanxi. Statistical Research, (3): 61-66. (in Chinese)

[8]
Lu Y Q, Li Y, Xue Q. 2018. Influencing factors of farmers’ willingness to pay for rural soil pollution prevention and control in eight cities in Hebei Province based on the CVM. Journal of Hebei Engineering University (Social Science Edition), 35(2): 13-15. (in Chinese)

[9]
Wang L F, Wu Y D, Zhang Y X. 2020. Improving energy efficiency vs developing new energy: Public environmental policy preferences and willingness to pay. Productivity Research, (5): 102-106, 110. (in Chinese)

[10]
Xu H, Jiang M K, Qian Y. 2004. Assessment of the non-use value of Yaoluoping National Nature Reserve. Rural Eco-Environment, 20(4): l-5. (in Chinese)

[11]
Xu Y H, Li C, Zhang W T, et al. 2020. Current status and implication of clean energy heating: Field survey in typical areas of rural Northern China. Journal of Agriculture, 10(3): 31-37. (in Chinese)

DOI

[12]
Xue D Y. 1997. Economic valuation of biodiversity—A case study on Changbaishan Mountain Biosphere Reserve in Northeast China. Beijing, China: China Environmental Press. (in Chinese)

[13]
Yang K, Zhao J. 2005. Study on the ecosystem services value of urban river using CVM and bias analysis of the results. Acta Ecologica Sinica, 25(6): 1391-1396. (in Chinese)

[14]
Zhang B L, Luo H, Lv L H, et al. 2021. The willingness to pay for clean heating and its influencing factors in the Beijing-Tianjin-Hebei Region. China Environmental Science, 41(1): 490-496. (in Chinese)

[15]
Zhang M J, Fan J F. 2004. Assessment of total economic value of improving atmospheric quality of Lanzhou. Journal of Arid Land Resources & Environment, 18(3): 28-32. (in Chinese)

[16]
Zhang Y F, Liu Y H. 2007. The output research of restoring ecosystem services in urban landscape river and the validity and reliability testing: A case study of CVM applied in water quality improvement of urban river in Shanghai. Journal of China University of Geosciences (Social Sciences Edition), 7(2): 39-44. (in Chinese)

[17]
Zhao J, Yang K. 2005. Willingness to pay for ecosystem services of urban river in Shanghai. Environmental Science, 26(2): 5-10. (in Chinese)

[18]
Zhao W, Fang Z, Yin Y Z. 2018. Research on the willingness to pay for clean energy consumption of urban residents in Tianjin City. Economic Research Guide, (11): 50-53. (in Chinese)

Outlines

/