Rural Revitalization and Agricultural Development

Rural Multifunctionality Evaluation and Interaction Relationships: A Case Study of Henan Province

  • YU Hu , 1 ,
  • XU Linlin 1, 3 ,
  • XIAO Lianlian , 2, * ,
  • ZHOU Yongkang 1, 3
Expand
  • 1. Institute of Geographic Sciences and Natural Resources Research, Chinese Academy of Sciences, Beijing 100101, China
  • 2. China Women’s University, Beijing 100105, China
  • 3. College of Resources and Environment, University of Chinese Academy of Sciences, Beijing 100049, China
* XIAO Lianlian, E-mail:

YU Hu, E-mail:

Received date: 2023-11-20

  Accepted date: 2024-05-10

  Online published: 2025-03-28

Supported by

The 2022 Think Tank Research Project(22SZK06)

The National Natural Science Foundation of China(42101313)

Abstract

Improving rural multifunctionality (RM) is crucial for achieving the Sustainable Development Goals (SDGs) target of sustainable consumption and production. This study establishes a clear link between functional composition, interaction and urban-rural integration, constructs a system of indicators for evaluating RM, and examines the interactions between functions using Spearman’s rank correlation coefficient to determine the dominant function type. The results show that: (1) Villages in most counties in Henan Province are in the polarized or dominant development type. Only a few villages dominated by non-agricultural production are able to realize comprehensive and balanced development. (2) Functional and spatial differentiation exists in rural areas of different types of counties. The non-agricultural production function is more prominent in villages around cities, while villages in mountainous and hilly areas emphasize the ecological conservation function. The development of villages in plains and remote areas focuses on agricultural production function. (3) The relationship between RM is complex and diverse. Agricultural production often constrains other functions. The development of non-agricultural production functions has a positive effect on the improvement of social security functions. Cultural tourism and ecological conservation functions are mutually reinforcing. This study enhances the understanding of overall pattern and type differences of RM and provides valuable insights for formulating more targeted regional economic development policies in the future.

Cite this article

YU Hu , XU Linlin , XIAO Lianlian , ZHOU Yongkang . Rural Multifunctionality Evaluation and Interaction Relationships: A Case Study of Henan Province[J]. Journal of Resources and Ecology, 2025 , 16(2) : 415 -426 . DOI: 10.5814/j.issn.1674-764x.2025.02.011

1 Introduction

Rural development transformation is a crucial aspect of global economic development, representing a substantial stride towards achieving sustainable agriculture, stable growth, thriving rural industries, full employment, and overall well-being, in alignment with the Sustainable Development Goals (SDGs). To address the challenges of sustainable rural development, numerous countries have implemented strategies such as rural renewal, revitalization, and restructuring (Shortall and Warner, 2012; Kasimis and Papadopoulos, 2013). The phenomenon of “rural decline” leading to the “modernization trap” has become an una-voidable challenge faced by countries worldwide (Lukyanova et al., 2021). Issues such as aging populations, rural depopulation, environmental degradation, and cultural erosion have emerged as significant obstacles hindering agricultural and rural modernization, as well as rural revitalization (Liu and Li, 2017). Both developed and developing countries need to identify their development directions within the current economic and social environment, with a particular emphasis on understanding the multifunctional transformation of rural areas. Since the late 1990s, multifunctionality has emerged as a new paradigm in European rural development, characterized by the shift towards “post-productivism” in agriculture and rural development (Van der Ploeg et al., 2000). In recent years, rural China has also transitioned from a single-function focus to a multifunctional approach, propelled by rapid economic development (Long et al., 2022; Liu et al., 2023a). Undoubtedly, this transition contributes to breaking away from traditional single-model agricultural development and promotes the coordinated development of rural society, economy, and environment (Li et al., 2021a).
Rural areas in China, with a population of nearly 500 million, have predominantly centered around agricultural production, contributing to the nation’s renowned agricultural prowess. However, China faces substantial challenges related to the “three rural” issues, encompassing agriculture, rural areas, and farmers, crucial to national development and people’s livelihoods (Xie, 2020). Rapid urbanization and industrialization have catalyzed socioeconomic changes in both urban and rural realms, prompting a notable shift in the functions of rural areas. Instead of the traditional singular focus on agriculture, rural areas are now characterized by multiple functions, including agriculture, industry, culture, leisure, and ecology. This transition exhibits distinct spatial variations (Evans, 2010). The multifunctionality of rural areas is a fundamental characteristic of their spatial property, promoting diversified development and maximizing spatial value. It serves as a core force driving rural transformation (Gu et al., 2019). In 2017, China introduced the strategy of rural revitalization, aiming to integrate rural resources, explore new functions and values, optimize spaces for production, living, and ecology, and nurture new industries and business models. Currently, rural regions in China are undergoing a transformation from a traditional agricultural cultivation economy to a diversified industrial growth pattern. However, this process entails coupling and conflicts between different types of spaces, necessitating the creation of high-quality functional spaces while preserving fundamental regional functions. To determine appropriate development types and optimization paths for different regions accurately, further analysis of the spatial characteristics and types of RM is necessary. Additionally, it is important to identify dominant functions and their relationships in diverse rural areas. This approach will help uncover the value of RM, stimulate rural vitality, and create a competitive value system.
The county level is the fundamental administrative unit for coordinating urban-rural development in China, and rural areas are mainly distributed within counties. The ultimate realization of the goals of rural revitalization strategy rests at the county level (Chen et al., 2021). In 2022, Henan Province had a rural population of up to 42.39 million people and a total grain production of one-tenth of China (Han and Zhong, 2022). Taking into account the availability of data, the county was chosen as the basic analysis unit. This study aims to uncover the spatial characteristics and differentiated types of RM, explore the development paths of dominant functions in different rural areas, and provide guidance for the integrated development of RM.

2 Literature review and research framework

2.1 Rural multifunctionality (RM)

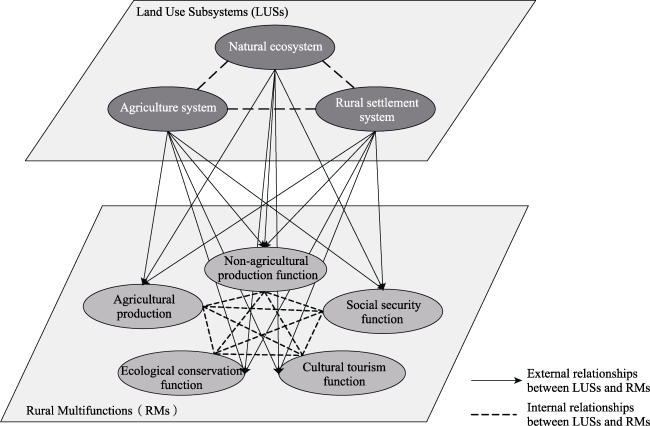
The concept of multifunction originated in the agricultural sector and has evolved into a new model for rural development in Europe since the 1990s (Van der Ploeg and Roep, 2003). Initially, multifunction emerged as a response to the changing rural landscapes in Europe and later gained widespread application in industrialized countries (Domínguez and Soliño, 2011). The governments of France and Italy actively promote the adoption and development of multifunctionality as a territorial-based approach to diversify agricultural activities (Rossing et al., 2007). In terms of the classification of multifunctionality, RM primarily revolves around four aspects: landscape management, water management, rural culture and historical development, and food security (Jongeneel et al., 2012). In China, research on multifunctionality often focuses on the “three rural” space, employing a tripartite division of RM into production, living, and ecological functions (Shi et al., 2022). Additionally, for rural areas near cities, there are studies that classify functions into economic, residential, agricultural production, ecological, and leisure dimensions (Gu et al., 2019). The rural land system is a complex functional system that encompasses agricultural land, residential land, and natural ecosystems (Tu and Long, 2017). With the diverse value of rural land and the emergence of new rural economies, RM has expanded further based on the production-living- ecology framework (Geoff, 2009). Moreover, ecological regions and agricultural regions can also provide leisure and tourism services while fulfilling their primary functions. Figure 1 illustrates the diversity of the rural land system, where the same land serves multiple functions that can have harmonious or conflicting relationships (Slee, 2007).
Figure 1 Relationship between land use system and rural multifunctionality

2.2 RM’s evaluation

The complexity of rural development necessitates a comprehensive measurement of RM across multiple dimensions (Zhou et al., 2019). The evaluation of RM originated in the 1980s. Stola (1980) utilized eight indicators, including employment structure and land use, to evaluate the agricultural and non-agricultural functions of rural areas. Since then, developed countries in Europe and America have conducted evaluations and positioning studies on RM from various perspectives such as rural ecology, social culture, economic development, and ecological environment, based on their respective development frameworks (John, 2008; Pinto and Breman, 2009; Willemen et al., 2010; Serra et al., 2014). RM exhibits hierarchy, diversity, and spatial variations due to changes in rural land use and resource allocation, resulting in functional differences within the same region under different evaluation spatial systems (Luo et al., 2016). From the perspective of rural spatial regions, RM can be categorized into functions such as socio-economic development, agricultural production, ecological conservation, and cultural exhibition (Mander et al., 2007), and the functions carried by different types of spaces exhibit “overlaying” characteristics (Holmes, 2008). However, existing evaluation systems have predominantly focused on the traditional functions, but they have paid insufficient attention to the potential functions such as rural cultural heritage and leisure tourism that cater to modern lifestyle (Gu et al., 2019; Jiang et al., 2022). This limitation hinders a comprehensive evaluation of RM and the realization of rural regional value.

3 Research design

3.1 Study area

Henan Province exhibits a west-to-east elevation gradient, with the central and eastern parts encompassing the Huang-Huai-Hai alluvial plain, while the southwest part includes the Nanyang Basin. Renowned as one of China’s major grain production centers, Henan Province yielded 65.442 million t of grain in 2021, accounting for 9.58% of the country’s total grain output. In 2021, the province’s urbanization rate reached 57.7%, which was 7 percentage points lower than the national average (NBSPRC, 2022). In recent years, Henan Province has witnessed notable advancements in the living standards of rural residents, rural infrastructure, and public services. However, rural development still faces challenges such as growing constraints on agricultural resources and the environment, declining efficiency in grain production, and limited industrial integration. This study classified the 103 counties in Henan Province into three distinct categories: mountainous areas (16 counties), peri-urban areas (30 counties), and plain outlying areas (57 counties), based on their topographical features and relative distances to cities.

3.2 Data sources

This study relies on socio-economic statistical data and land use data from various sources. The statistical data sources used in this study include the “Henan Investigation Yearbook”, “China County Statistical Yearbook 2019 (County Volume)”, and statistical bulletins on national economic and social development for each county in 2020. When specific data were unavailable, the adjacent-year interpolation method was utilized to estimate the missing values. The land use data used in this study is derived from the China Land Cover Dataset 2020. To ensure data consistency and research validity, urban districts with higher urbanization levels were excluded based on the administrative division adjustment implemented in Henan Province in June 2021. Consequently, the study focused on the remaining 103 county-level units as the subjects of research.

3.3 Method

3.3.1 Evaluation index system

3.3.1.1 Index selection

According to the research framework, a multidimensional evaluation index system was developed to assess RM. The system consists of five dimensions: agricultural production, non-agricultural production, ecological conservation, social security, and cultural tourism (Table 1). The selection of these indicators is justified as follows:
Table 1 Evaluation index system of RM
Criterion layer Indicator Weight Direction Calculation method or data source
Agricultural production function (APF) Grain yield per unit farmland area (kg ha-1) 0.173 + Total grain production/Area sown to grain
Per capita arable land (ha person-1) 0.245 + Arable land area/Total rural population
Land reclamation rate (%) 0.136 + Arable land area/Total regional land area
Agricultural mechanization level (kW ha-1) 0.139 + Total power of agricultural machinery/Arable land area
Farmland potential productivity (kg ha-1) 0.119 + Resource and Environment Science and Data Center, Chinese Academy of Sciences
Share of primary industry (%) 0.188 + Output value of primary industry/GDP
Non-agricultural production function (NPF) Proportion of non-agricultural employment (%) 0.093 + Employment in secondary and tertiary sectors/Total employment
Average per person financial revenue (yuan person-1) 0.414 + Total financial revenue/Total population
Proportion of secondary and tertiary industries (%) 0.039 + Output value of secondary and tertiary industries/GDP
Per capita output value of secondary and tertiary
industries (yuan person-1)
0.169 + Output value of secondary and tertiary industries/Total population
Distribution density of enterprises above designated size (Pcs ha-1) 0.285 + Number of enterprises above designated size/Total regional land area
Ecological conservation function (ECF) Average ecological services value (yuan ha-1) 0.427 + Total ecological services value/Total regional land area
Forest coverage (%) 0.388 + Forestry area/Total regional land area
Average use of pesticides (kg ha-1) 0.070 - Volume of pesticides/Arable land area
Average use of chemical fertilizers (kg ha-1) 0.088 - Volume of chemical fertilizers/Arable land area
Average use of mulch (kg ha-1) 0.027 - Volume of mulch/Arable land area
Social security function (SSF) Per capita disposable income of rural residents (yuan person-1) 0.146 + 2019 Henan Statistical Yearbook
Retail sales of consumption goods per capita (yuan person-1) 0.073 + Total retail sales of consumption goods/Total population
Per capita savings deposit (yuan person-1) 0.050 + Total resident savings deposits/Total population
Number of beds in health institutions owned by 10000 people (Pcs 10000 person-1) 0.042 + Number of beds in health institutions/Total population
Number of students instructed by a teacher (person) 0.032 - Number of students in primary and secondary schools/ Number of teachers in primary and secondary schools
Local public expenditure per capita (10000 yuan
person-1)
0.087 + Local public expenditure/Total population
Rural electricity facilities (kW h person-1) 0.570 + Rural electricity use/Rural population
Cultural tourism function (CTF) Annual tourist reception (10000 people) 0.219 + Data from 2019 Culture and Tourism Development of Henan Province
Tourism revenue (10000 yuan) 0.263 + Data from 2019 Culture and Tourism Development of Henan Province
Competitiveness of A-class tourist attractions 0.148 + Sum of A-class tourist attractions
Number of characteristic tourist villages (Pcs) 0.186 + Data from 2019 Culture and Tourism Development of Henan Province
Density of key cultural heritage protection units
(Pcs ha-1)
0.184 + Key cultural relics above provincial level Total regional land area
(1) Agricultural production function (APF). The APF encompasses the capacity of rural areas to provide society with agricultural products, including food, meat, and oilseeds. It plays a crucial role in ensuring national food security and serves as the fundamental source of employment and livelihood for local residents, thereby constituting the cornerstone of rural regions. This function primarily takes into account the economic effects and the quality of cultivated land. Based on the studies of Jia et al. (2020) and Long et al. (2022), the selection of indicators are as follows: The economic impacts of agricultural production are reflected through indicators such as grain yield per unit farmland area and share of primary industry. Agricultural technology is represented by the level of agricultural technology. The quality of cultivated land is assessed using indicators such as per capita arable land, land reclamation rate, and agricultural production potential.
(2) Non-agricultural production function (NPF). The NPF pertains to the capacity of rural areas to foster the development of non-agricultural industries, including industry and services. It plays a crucial role in absorbing a significant number of surplus rural labor forces and serves as a vital driver for the economic advancement of rural regions. This function primarily focuses on the dynamism of industrial development and the economic contribution of non-agricultural production. Based on the indicators used in studies such as Li et al. (2021b) and Xu and Fang (2019), the dynamism of industrial development is assessed through indicators such as the proportion of secondary and tertiary industries and the distribution density of enterprises above designated size.
(3) Ecological conservation function (ECF). Rural regions encompass extensive areas of forests, grasslands, and water areas, serving as vital ecological barriers and providers of ecosystem services. However, with the advancement of agricultural modernization and the rise in residents’ consumption levels, human activities are increasingly exerting adverse impacts on the rural ecological environment. Hence, the evaluation of the ECF of rural areas should consider both the baseline conditions of the ecological environment and the effects of human activities. Referring to indicators used in literature such as Zou et al. (2020) and Cui et al. (2023), the former is indicated by two positive indicators: average value of ecological services and forest coverage. A higher value of these indicators signifies a stronger ECF of the region. The latter is represented by three negative indicators: average use of pesticides, chemical fertilizers and mulch. A higher value of these indicators implies a weaker ECF of the region.
(4) Social security function (SSF). Rural regions are the space where rural residents reside, work, live, and engage in consumption activities. The presence of public and service facilities in rural areas plays a crucial role in ensuring a high quality of life for residents and fostering social stability. The assessment of the SSF primarily focuses on the living standards and the provision of public services. The living standards reflect the economic perspective of rural residents’ income and consumption levels, which are represented by three indicators. Referring to indicators used in literature such as Mei and Lin (2023) and Long et al. (2022), three indicators are selected to reflect the economic perspective, representing the living standards of rural residents through income and consumption levels. Additionally, four indicators are chosen to evaluate the levels of public services, including education and healthcare.
(5) Cultural tourism function (CTF). Rural regions hold significant importance as bearers of agricultural civilization and traditional culture, serving as essential platforms for cultural inheritance, tourism, and leisure activities (Oostindie, 2018). The integration of traditional cultural resources and the development of the tourism industry prove beneficial in meeting people’s aspirations for an improved life quality. Moreover, this integration serves as a crucial pathway for exploring the inherent development potential of rural areas and promoting diversified rural development. To evaluate this function, five indicators have been selected (Liu et al., 2023b).

3.3.1.2 Entropy evaluation method

To eliminate dimensional discrepancies resulting from variations in unit measurements among indicators, this study utilized the extreme value method to standardize the indicator data. The entropy evaluation method was employed to determine the weights of indicators, while the weighted summation method was applied to calculate the evaluation value of each function.
(1) It eliminates the dimensional differences between different indicators, making the data fall within the range of [0,1], thus ensuring comparability. The formulas for standardizing positive and negative indicators are as follows, respectively:
$Yij$=$\left[ {{x}_{ij}}-\text{min}\left( {{x}_{j}} \right) \right]/\left[ \text{max}\left( {{x}_{j}} \right)-\text{min}\left( {{x}_{j}} \right) \right]$ (Positive)
$Yij$=$\left[ \text{max}\left( {{x}_{j}} \right)-{{x}_{ij}} \right]/\left[ \text{max}\left( {{x}_{j}} \right)-\text{min}\left( {{x}_{j}} \right) \right]$ (Negative)
where Yij is the original value of the j-th indicator for the i-th county. max(xj) and min(xj) represent the maximum and minimum values of the j-th indicator for all counties, respectively.
(2) Calculate the weight of the j-th indicator for the i-th county:
${{P}_{ij}}$=${{Y}_{ij}}$/$\underset{i=1}{\overset{m}{\mathop \sum }}\,{{Y}_{ij}}$,$0\le {{P}_{ij}}\le 1$
(3) Calculate the entropy value of the j-th indicator ${{E}_{j}}$:
${{E}_{j}}$=$-k\underset{i=1}{\overset{m}{\mathop \sum }}\,{{P}_{ij}}\text{ln}{{P}_{ij}}$
where $k>0$, ln is the natural logarithm, and the constant k is related to the number of counties m. Generally, k=1/lnm, then $0\le {{E}_{j}}\le 1$.
(4) Calculate the coefficient of variation for the j-th indicator Dj. The coefficient of variation indicates the role played by the indicator on the object of study, with larger values indicating a greater impact on the object of study.
${{D}_{j}}\text{ }\!\!~\!\!\text{ }$=$1-{{E}_{j}}$
(5) Determine the weight of the j-th indicator Wj. Calculate the weight based on the coefficient of variability of the information of the indicator; the greater the coefficient of variability, the greater the weight it carries.
${{W}_{j}}\text{ }\!\!~\!\!\text{ }={{D}_{j}}$/$\text{ }\!\!~\!\!\text{ }\underset{j=1}{\overset{\text{n}}{\mathop \sum }}\,{{D}_{j}}$
(6) Calculate the composite evaluation index ${{U}_{i}}$ by weighted summation:
${{U}_{i}}=\underset{j=1}{\overset{n}{\mathop \sum }}\,{{Y}_{ij}}{{W}_{j}}$
where n is the number of indicators. The larger the value of U, the higher the comprehensive evaluation index and the better the evaluation effect. The weightings of various indicators in APF were relatively balanced, with the highest importance given to per capita arable land area.

3.3.2 RM’s correlation analysis

RM interact spatially in three types of interactions: conflict, synergy and compatibility (Liu et al., 2011). Conflict refers to the competition between two functions, synergy refers to the mutual promotion and enhancement of two functions, and compatibility refers to the coexistence of two functions that do not enhance or diminish each other’s functions. In this paper, Spearman’s rank correlation coefficient is used to classify the types of interactions between RM in Henan Province, and to provide a reference for the development paths formulated for villages with different dominant function types. The formula is:
ρ=$\frac{\sum\limits_{i=1}^{n}{({{x}_{i}}-\bar{x})({{y}_{i}}-\bar{y})}}{\sqrt{\sum\limits_{i=1}^{n}{{{({{x}_{i}}-\bar{x})}^{2}}}\sum\limits_{i=1}^{n}{{{({{y}_{i}}-\bar{y})}^{2}}}}}$
where ρ represents the correlation coefficient, x and y respectively represents converted rank values of each territorial function, n represents the number of counties. Values of ρ range from -1 to 1. ρ<0 indicates a negative correlation, which means functions are conflict; ρ>0 indicates a positive correlation, which means functions are synergistically correlated; ρ=0 indicates no correlation, which means one function is compatible with another.

3.3.3 Identification of leading function

Despite the multifunctionality in rural areas, the level and status of each function vary due to differences in resource endowments and development stages, thus affecting the development of rural areas. The dominant functions provide directions for characteristic modes of development in rural areas, while lagged functions should be remedied in rural development. Therefore, identifying the dominant functions of rural areas is conducive to stimulating differentiated development in rural areas. This paper identifies rural dominant and lagged function by employing the method of Long et al. (2009) and Zhang et al. (2019), and the formula is:
${{y}_{ip}}=\frac{{{Z}_{ip}}}{{{M}_{p}}+{{S}_{p}}}$
where Zip is the value of the p-th function in the i-th county, Mp is the mean value of the p-th function, Sp is the standard deviation of p-th function. When yip≥0.75, it indicates that the p-th function is the dominant function in the i-th county; when yip∈[0.5, 0.75), it indicates that the p-th function is the non-dominant function of the county; when yip<0.5, it indicates the p-th function is the lagged function in the i-th county.
Based on the calculation results using Formula (9), the development type of each county is classified following the guidelines presented in Table 2. If all five functions are dominant simultaneously, the county is classified as comprehensive development. If fewer than five functions are dominant, the county is categorized as polarized development or dominant development, with further sub-categories determined based on a comparison between the value of dominant functions and lagged functions. If there are no dominant functions but some lagged functions, the county is classified as lagging development, with sub-categories determined by the value of lagged functions. Finally, if there are neither dominant nor lagged functions present, the county is classified as balanced development.
Table 2 Classification of rural multifunction development in Henan Province
Presence of dominant function Presence of lagged
function
Number of dominant
function (N)
Development type Rules of classifying sub-categories
of development
Yes Yes 0<N<5 Polarization development Dominant-lagged function
No N=5 Comprehensive development No more subdivision
No 0<N<5 Dominant development Subdivision by dominant function
No Yes N=0 Lagging development Subdivision by lagged function
No N=0 Balanced development No more subdivision

4 Results

4.1 Identification of four rural development type

By applying Formula (9), the dominant and weak functions of each county can be identified. Using the criteria outlined in Table 2 and considering the interactive relationships among different regional types, the rural development types in Henan Province can be determined, and the corresponding percentage calculated (Table 3). Among them, the comprehensive development type and balanced development type account for only 7.77% of the total, a relatively modest proportion compared to the total of 103 counties. Counties classified as the comprehensive development type exhibited superior natural environment, location conditions, relatively well-developed infrastructure, and high levels in various functions. The balanced development type counties lack prominent weak functions or dominant functions, lacking a core growth pole to drive county-level development.
Table 3 Number and proportion of multifunctional types in Henan Province
Development type Subtype Number Proportion (%)
Comprehensive development - 8 7.77
Balanced development - 8 7.77
Dominant development A-oriented type 15 14.56
N-oriented type 11 10.68
E-oriented type 6 5.83
S-oriented type 2 1.94
Polarization development A-oriented-C-lagged type 7 6.80
A-oriented-E-lagged type 9 8.74
A-oriented-S-lagged type 5 4.85
A-oriented-N-lagged type 15 14.56
C-oriented-E-lagged type 1 0.97
E-oriented-N-lagged type 14 13.59
S-oriented-A-lagged type 1 0.97
S-oriented-E-lagged type 1 0.97

Note: A: Agricultural production function; N: Non-agricultural production function; E: Ecological conservation function; S: Social security function; C: Cultural tourism function. The same below.

There were 34 dominant development counties, constituting 33.01% of the total. Among them, the highest proportion was observed in A-oriented counties, accounting for nearly half of the dominant development counties. N-oriented mainly distributed in the periphery of large cities, accounting for 10.68%, to undertake the industrial transfer of urban core areas. E-oriented mainly distributed in the mountainous hilly areas of west and southwest Henan, accounting for 5.83%, with outstanding ECF. S-oriented counties were limited to only two, relying on abundant cultural tourism resources and having well-developed infrastructure and public service systems.
The largest number of counties fell under the polarized development type, comprising 51.46% of the total. Among them, the A-oriented-N-lagged type and E-oriented-N-lagged type were the most common, accounting for 14.56% and 13.59%, respectively. These counties faced significant challenges in achieving coupling and coordination between APF and NPF. Conflicts arose between ECF and the development of NPF, and the issue of “green poverty” resulting from ecological protection needed to be addressed.

4.2 The characteristics of RM

4.2.1 Overall distribution characteristics of RM

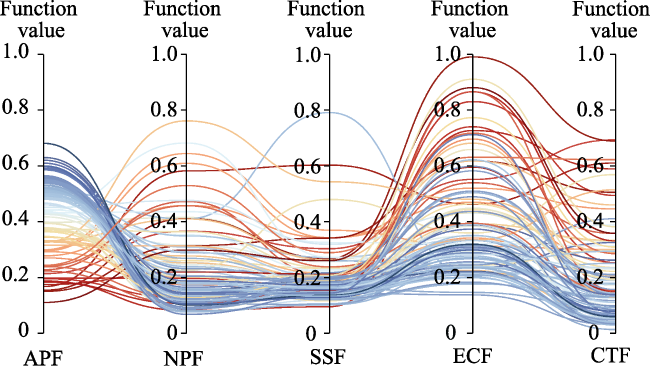
Utilizing a parallel map (Figure 2) based on the functional values of the 103 counties, we can explore the overall distribution pattern of RM across these counties. SSF scores were concentrated in a low-value area, followed by CTF and NPF, while ECF and APF scores were relatively dispersed. Regarding the functional score range, ECF had the highest upper limit, reaching 1.0, while APF and CTF had the lowest upper limit, only 0.7. In terms of the trend of the line segments, a trade-off was observed between NPF and APF. Most counties dominated by APF were relatively weak in NPF and SSF, with a higher proportion of such counties mainly distributed in the Huang-Huai-Hai alluvial plain and Nanyang Basin. Areas with higher NPF were mainly concentrated in the urban areas within the metropolitan region centered around the provincial capital, Zhengzhou.
Figure 2 Parallel map of multifunctions of counties in Henan Province

4.2.2 Differences in RM across rural development types

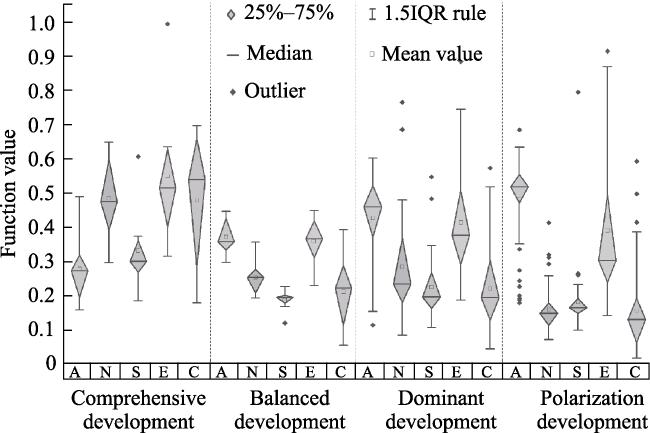
Upon conducting within-group comparisons of different county types (Figure 3), it was observed that only NPF in comprehensive development type counties surpassed APF. The median score for CTF was the highest, while its dispersion exhibited the greatest variation among all functions. Outliers were identified in ECF and SSF. For instance, Luanchuan County exhibited a high score in ECF (0.99), along with a relatively high score in CTF (0.69), but a low score in APF (0.15). In balanced development type, dominant development type, and polarized development type counties, the scores for APF and ECF were relatively high. Due to the predominant role of agriculture in polarized development type counties, the average score for APF reached 0.478, accompanied by a high degree of data dispersion. For instance, the score range for ECF displayed the greatest variation, ranging from 0.14 in Qi County to 0.91 in Xin County. SSF was identified as a critical weak function impeding the development of all county types.
Figure 3 The multifunction level of each type of counties in Henan Province
When comparing the functional scores among different development types, it became evident that the median and mean scores for APF increased progressively from comprehensive development type to balanced development type, dominant development type, and polarized development type (the median increased from 0.269 to 0.514, and the mean increased from 0.273 to 0.478). In contrast, the median scores for CTF, NPF, and SSF continuously decreased, with CTF experiencing a drop from 0.535 to 0.125. Regarding the differences among the development types, there was relatively little variation in SSF, with median scores ranging from 0.160 to 0.296 and a fluctuation range of 0.136. Due to the presence of different dominant and weak functions in various counties, the polarized development type exhibited high data dispersion and the most outliers, while the comprehensive development type and balanced development type showed relatively clustered data distributions.

4.2.3 Functional differentiation in diverse geographical spaces

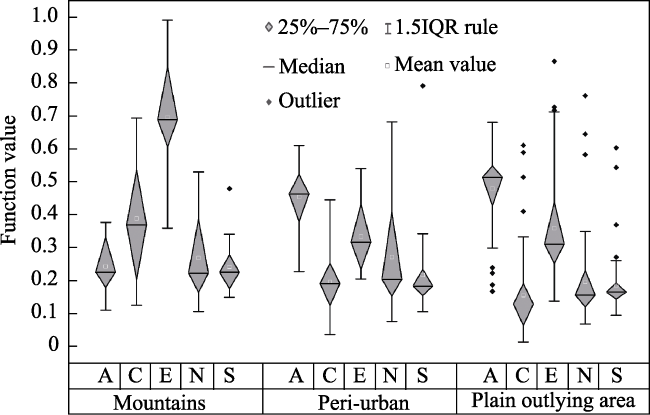
Analysis of Figure 4 revealed that the mountainous and hilly areas exhibited the highest scores for ECF and CTF, with a mean score of 0.70 for ECF and 0.39 for CTF. Conversely, the APF demonstrated the lowest score (0.24). This pattern can be attributed to the presence of large protected areas, high forest coverage, and abundant wildlife and plant resources in the mountainous and hilly regions of western Henan Province. These areas played a crucial role in ecological conservation and the preservation of biodiversity. Additionally, the favorable ecological environment contributed to the presence of scenic resources that had strong tourism appeal. Despite the unfavorable natural conditions, such as terrain and soil, for agricultural production, the development of cultural tourism had provided an ecologically friendly and sustainable pathway for these counties. Furthermore, these areas had relatively mature tourism development, leading to the establishment of well-developed supporting infrastructure.
Figure 4 Box line map of rural multifunction of counties in Henan Province by region
In the urban outskirts, counties exhibited higher scores for NPF with a mean score of 0.27. These counties also had the highest upper limit, reaching 0.61. Primarily distributed within the urban agglomeration centered around Zhengzhou, they were significantly influenced by urban radiation and played a vital role in accommodating industrial transfers from urban regions. However, their ECF scores were relatively low, with a mean score of 0.33. The development of the secondary industry had resulted in ecological pollution, and urbanization had caused some degree of damage to the ecological environment in these areas.
Counties located in the far suburbs of the plains demonstrated the highest APF, with a mean score of 0.48. Characterized by gentle terrain and abundant arable land resources, these areas served as the primary grain production base and a significant region for specialty agricultural products in Henan Province. However, they experienced lower levels of economic development and relatively delayed infrastructure construction, resulting in weaker SSF, with a mean score of 0.19. Additionally, CTF was relatively low in these areas, with a mean score of 0.16. They possessed limited natural and cultural tourism resources, leading to a less attractive environment for tourism development.

4.3 Synergy, compatibility, and conflict among functions

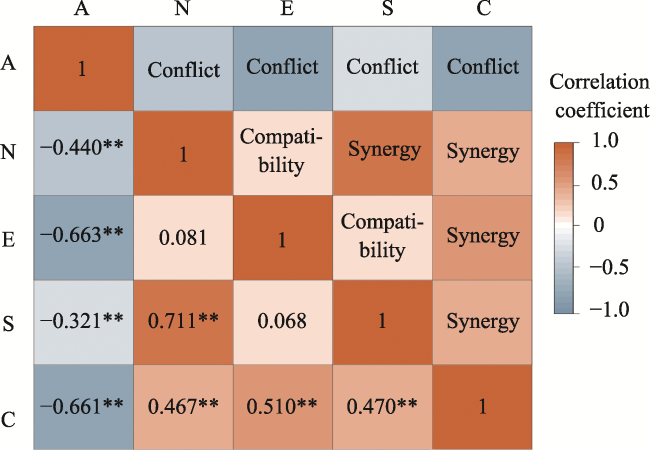
The Spearman correlation analysis of RM revealed significant negative correlations between the APF and the other four types of functionalities (Figure 5). The development of non-agricultural industries, promoting industrialization and urbanization, resulted in the reduction of agricultural production land as it was converted for other purposes. Additionally, rural labor migration to urban areas, leading to decreased agricultural input and constraints on agricultural development. The excessive use of fertilizers, pesticides, and plastic mulch in agricultural production can cause pollution in agro-ecosystems, while excessive land reclamation results in a decline in biodiversity and habitat quality. Furthermore, improper agricultural irrigation can lead to soil salinization, compromising the ECF. Regions with stronger APF often have underdeveloped town economies, insufficient public fiscal expenditures, and inadequate public services such as healthcare and education, which restricted the improvement of residents’ quality of life. Therefore, a conflicting relationship existed between APF and SSF. Areas with higher APF were mainly concentrated in traditional plain agricultural areas, where traditional agricultural production modes were deeply ingrained. Consequently, it became challenging to transform agricultural resources into tourism resources, and there was a lack of corresponding supporting facilities and services, resulting in a conflicting effect with CTF.
Figure 5 Spearman’s correlation coefficients and types of interactions for each function in Henan Province

Note: ** indicates statistically significance at 1%.

The NPF exhibited positive synergistic effects with SSF and CTF, with correlation coefficients of 0.711 and 0.467, respectively. Regions with stronger NPF were significantly influenced by urban areas, with developed secondary and tertiary industries capable of supporting a larger population. These regions also possessed better infrastructure and public services, resulting in an improvement in SSF. Rural areas with higher NPF had well-developed cultural tourism industries and reception facilities. The concentration of population in these areas created a strong demand for cultural tourism, contributing to the enhancement of CTF. The ECF exhibited a positive and significant correlation with CTF, with a correlation coefficient of 0.510. Regions with strong ECF boasted abundant natural and cultural resources, making them highly valuable for sightseeing and suitable for the development of high-quality tourist attractions. This created a synergistic effect between ECF and CTF. Regions with strong SSF had a sufficient labor force and well-established social public facilities, providing a solid foundation for the development of cultural tourism. In turn, the rational development of cultural tourism contributed to the improvement of residents’ quality of life. Therefore, SSF and CTF exhibited a synergistic effect. There is a positive synergy between SSF and NPF. The development of NPF was conducive to population agglomeration, as well as to the improvement of public services and the living standard of the residents. SSF and ECF were in compatibility. A relative balance was achieved between the constraints of ecological conservation and the residents’ demand for quality of life.

5 Discussion

Firstly, this study identified distinct regional characteristics in RM, and explored their influencing factors. With regard to the factors influencing spatial differentiation, economic development level, spatial location, natural geographical features, and historical conditions played a significant role in the differential development of different functions. Particularly in mountainous and hilly areas, the influence of natural geographical conditions became more prominent. On the one hand, this may be attributed to the spatial morphology of settlements being influenced by the gradient of mountain-hill-plain topography (He et al., 2013). On the other hand, it was constrained by the development restrictions imposed by China’s ecological civilization construction in ecologically fragile areas. However, the results indicated that ecological and rural tourism development in mountainous and hilly areas prevented ecological resources from becoming a “resource curse” leading to green poverty. These areas fully utilized tourism resources, thereby contributing to local economic growth and community well- being, while protecting the ecological environment and enhancing local SSF.
Secondly, this study explored the regional characteristics and interactive effects of CTF, revealing a strong coupling with ECF and SSF. This indirectly illustrated the significance of rural tourism for the rural areas. Etxano et al. (2018) noted that the multifunctional products offered by rural spaces often clash with one another, making it challenging to simultaneously achieve multifunctions. A study on land multifunctionality in Spain also indicated that rural areas cannot simultaneously achieve high values in all functionalities and that one or two functionalities typically dominate the others (Gómez-Sal and González, 2007). Our study confirmed this observation. The uniqueness and novelty of our research lay in the fact, while most counties were dominated by a few functionalities, there were also a small number of counties that exhibited a comprehensive and balanced development across multiple functionalities. A common characteristic was a NPF level significantly higher than that of other types of counties, driven by the development of non-agricultural industries such as manufacturing, modern food production, trade and logistics, and cultural tourism. Therefore, the diversified transformation of rural functional areas was beneficial for breaking away from dependence on traditional agriculture, promoting the coordinated development of social, economic, and environmental aspects while facilitating the development of multiple functionalities.
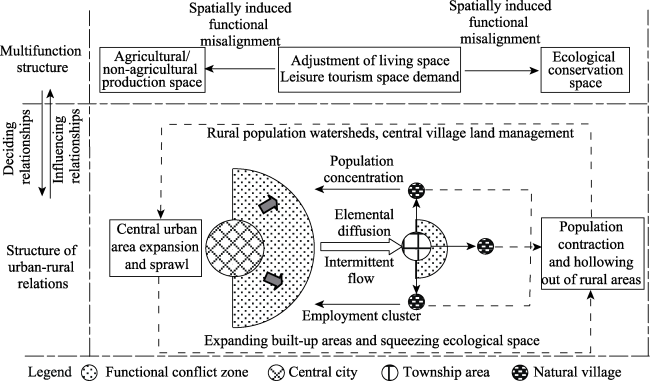
Thirdly, rural agricultural transformation and upgrading have emerged as the primary driving force for rural economic growth and rural transformation in China, reflecting a manifestation of post-productivist transition (PPT) (Liu et al., 2022). Our study further explored the urban-rural relationship and its implications. As depicted in Figure 6, different functional spaces would have an appropriate distribution of settlements and production systems in an ideal scenario. However, due to the presence of the production scale curve in central urban areas, various production factors tend to concentrate from surrounding towns towards the core area, leading to the continuous expansion of central urban or town areas. This process involved three interactions: 1) Production and tourist flows: Central urban areas generate both permanent and temporary outflows of production factors and seasonal tourist populations. This contributes to the development of surrounding towns and rural areas, impacting the transformation of rural functional areas. 2) Migration of residents to central urban areas: People move from rural villages to central urban areas seeking better living conditions and opportunities. This migration leads to the expansion of urban construction and the modernization of rural functional areas. 3) Depopulation effects: The migration from rural areas leads to depopulation and the hollowing out of rural areas. This demographic decline negatively impacts social security, agricultural production, and other non-agricultural activities in rural areas. Mismatched interactions between urban and rural areas can cause spatial disparities and disorder among different functional types, leading to broader regional development challenges.
Figure 6 The transmission mechanism of multifunction to the development of urban-rural structural system

6 Conclusions

Based on the “production-living-ecology” research framework, this article extended the evaluation system of RM by incorporating the CTF. It introduced a novel five-dimensional evaluation system for RM. The study analyzed the distinguishing features and functional interactions of RM and categorized dominant functional types based on advantageous combinations of functions. The specific findings were summarized as follows:
Firstly, it is observed that in most counties of Henan Province, there is a prevalence of polarization development or dominant development types. Only 15.5% of counties can achieve comprehensive and balanced development, with NPF as the main growth pole. Secondly, counties of different types exhibit varying functionality levels and spatial differentiation. Non-agricultural production serves as the industrial support for comprehensive development counties, with greater prominence in areas surrounding cities. In mountainous and hilly regions, the emphasis lies on maintaining ECF and realizing CTF through eco-tourism resources. Thirdly, conflicts and coordination patterns emerge among different functions. APF poses constraints on other functions. Rural areas that have not achieved the transformation into agricultural multifunctional development are often limited by low input-output ratios. The strong correlation between NPF and SSF indirectly indicates the impact of production structure on public welfare. The relationship between CTF and ECF is mutually complementary and mutually reinforcing. Finally, the interaction among RM is complex and diverse. The ultimate objective is to reduce conflicts among functions, guide the coordinated development and promote sustainable agriculture and eco-friendly rural development.
Given the differentiation characteristics of RM, future rural development policy formulation should focus on the following aspects: Firstly, there is a need to spatially categorize land use to achieve the regulation of rural functions with multiple purposes. It is necessary to strictly consider the resource environment, functional positioning, and land structure in different types of areas such as plains, hills, and mountains. This entails taking into strict consideration the resource environment, functional positioning, and land structure in various types of areas such as plains, hills, and mountains. Furthermore, it is crucial to consider the geographical distribution patterns of terrain and river systems, as well as the layout of towns and villages, their capacity to support populations and industries, in order to promote the revitalization of rural areas in an organized and categorized manner. Secondly, it is essential to strengthen control over the total amount of construction land, coordinate urban and rural planning layouts, and foster the integrated development of urban and rural spatial distribution. This involves establishing rational development goals and optimization measures for the rural multifunctional system, while establishing a coordinated development system that connects both urban and rural areas. Thirdly, optimizing the spatial layout of rural production and leveraging the comparative advantages of different towns is crucial. This can be achieved by establishing demonstration areas for the production of characteristic agricultural products and developing agricultural industrial parks with distinct features. By promoting the concentration of major agricultural products in advantageous regions, facilitating the transformation of agricultural production towards large-scale operations, and focusing on adjusting the agricultural industry structure, significant progress can be made.
In future research, there is an opportunity to extend our current findings by conducting a longitudinal analysis to unveil dynamic temporal patterns. While our current analysis focuses exclusively on the county scale, there is potential for enhancing data precision by delving into analyses at the township and village levels. Moreover, a deeper exploration into the multifunctional linkages within rural areas at different spatial scales could provide valuable insights. This expansion in both temporal and spatial dimensions will contribute to a more accurate and robust assessment of the complex dynamics within RM.
[1]
Chen Y S, Wu C Q, Zhang H P. 2021. Country centered rural revitalization: Evolution of urban-rural relationship and county economic development. South China Journal of Economics, 8: 35-47. (in Chinese)

[2]
Cui X, Deng X Y, Wang Y S. 2023. Evolution characteristics and driving factors of rural regional functions in the farming-pastoral ecotone of northern China. Journal of Geographical Sciences, 33(10): 1989-2010.

[3]
Domínguez-Torreiro M, Soliño M. 2011. Provided and perceived status quo in choice experiments: Implications for valuing the outputs of multifunctional rural areas. Ecological Economics, 70(12): 2523-2531.

[4]
Etxano I, Barinaga-Rementeria I, Garcia O. 2018. Conflicting values in rural planning: A multifunctionality approach through social multi-criteria evaluation. Sustainability, 10(5): 1431. DOI: 10.3390/su10051431.

[5]
Evans N. 2010. Multifunctional agriculture: A transition theory perspective. Journal of Rural Studies, 26(1): 81-82.

[6]
Gómez-Sal A, González G A. 2007. A comprehensive assessment of multifunctional agricultural land-use systems in Spain using a multi-dimensional evaluative model. Agriculture, Ecosystems & Environment, 120(1): 82-91.

[7]
Geoff A Wilson. 2009. The spatiality of multi-functional agriculture: A human geography perspective. Geoforum, 40(2): 269-280.

[8]
Gu X, Xie B, Zhang Z, et al. 2019. Rural multifunction in Shanghai suburbs: Evaluation and spatial characteristics based on villages. Habitat International, 92: 102041. DOI: 10.1016/j.habitatint.2019.102041.

[9]
Han D, Zhong Y. 2022. Issues and path selection of grain industry development in Henan under the new development pattern. Journal of Henan University of Technology (Social Science Edition), 38(6): 17-24. (in Chinese)

[10]
He Y H, Zeng S S, Tang C L, et al. 2013. Differentiation characteristics and forming mechanism of rural settlements in Central China. Acta Geographica Sinica, 68(12): 1643-1656. (in Chinese)

DOI

[11]
Holmes J. 2008. Impulses towards a multifunctional transition in rural Australia: Interpreting regional dynamics in landscapes, lifestyles and livelihoods. Landscape Research, 33(2): 211-223.

[12]
Jia K Y, Qiao W F, Chai Y B, et al. 2020. Spatial distribution characteristics of rural settlements under diversified rural production functions: A case of Taizhou, China. Habitat International, 102: 102201. DOI: 10.1016/j.habitatint.2020.102201.

[13]
Jiang Y F, Long H L, Ives C D, et al. 2022. Modes and practices of rural vitalisation promoted by land consolidation in a rapidly urbanising China: A perspective of multifunctionality. Habitat International, 121: 102514. DOI: 10.1016/j.habitatint.2022.102514.

[14]
John H. 2008. Impulses towards a multifunctional transition in rural Australia: Interpreting regional dynamics in landscapes, lifestyles and livelihoods. Landscape Research, 33(2): 211-223.

[15]
Jongeneel R, Polman N, Slangen L. 2012. Changing rural landscapes: Demand and supply of public services. In: Brouwer F, Van der Heide C M (eds.). Multifunctional rural land management: Economics and policies. London, UK: Routledge.

[16]
Kasimis C, Papadopoulos A G. 2013. Rural transformations and family farming in contemporary Greece. In: Miranda D O, Alegre E V A, Faus A M M (eds.). Agriculture in Mediterranean Europe: Between old and new paradigms. London, UK: Emerald Group Publishing Limited.

[17]
Li J T, Liu Y S, Yang Y Y, et al. 2021a. County-rural revitalization spatial differences and model optimization in Miyun District of Beijing-Tianjin-Hebei Region. Journal of Rural Studies, 86: 724-734.

[18]
Li Y J, Kong X S, He J H, et al. 2021b. Regional function evaluation and transformation characteristics of rural areas in Hubei Province. China Land Science, 35(3): 79-87. (in Chinese)

[19]
Liu X, Kong M H, Tong D, et al. 2022. Property rights and adjustment for sustainable development during post-productivist transitions in China. Land Use Policy, 122: 106379. DOI: 10.1016/j.landusepol.2022.106379.

[20]
Liu Y, Liu Y, Chen Y. 2011. Territorial multi-functionality evaluation and decisionmaking mechanism at county scale in China. Acta Geographica Sinica, 66(10), 1379-1389.

[21]
Liu Y, Wan C Y, Xu G L, et al. 2023a. Exploring the relationship and influencing factors of cultivated land multifunction in China from the perspective of trade-off/synergy. Ecological Indicators, 149: 110171. DOI: 10.1016/j.ecolind.2023.110171.

[22]
Liu Y R, Tang C C, Wan Z W. 2023b. Multi-scenario analysis and the construction of the revitalization model of green development in tourism traditional villages. Journal of Resources and Ecology, 14(2): 239-251.

[23]
Liu Y S, Li Y H. 2017. Revitalize the world’s countryside. Nature, 548(7667): 275-277.

[24]
Long H L, Ma L, Zhang Y N, et al. 2022. Multifunctional rural development in China: Pattern, process and mechanism. Habitat International, 121: 102530. DOI: 10.1016/j.habitatint.2022.102530.

[25]
Long H L, Liu Y S, Zou J. 2009. Assessment of rural development types and their rurality in eastern coastal China. Acta Geographica Sinica, 64(4): 426-434. (in Chinese)

DOI

[26]
Lukyanova M T, Zalilova Z A, Kovshov V A, et al. 2021. Export potential in rural areas:Management issues. New York, USA: Springer International Publishing.

[27]
Luo Y, Li T, Zhang C, et al. 2016. Town territorial multi-functionality evaluation and the dominant function orientation: A case of Jinhu County. Human Geography, 31(3): 94-101. (in Chinese)

[28]
Mander Ü, Wiggering H, Helming K. 2007. Multifunctional land use-meeting future demands for landscape goods and services. Heidleberg, Germany: Springer.

[29]
Mei Y, Lin N. 2023. Internet use and the happiness of rural residents: the role of education and health. International Journal of Environmental Research and Public Health, 20(4): 3540. DOI: 10.3390/ijerph20043540.

[30]
NBSPRC (National Bureau of Statistics of China). 2022. China statistical yearbook. https://data.stats.gov.cn/easyquery.htm?cn=C01. Viewed on 2022-12-08.

[31]
Oostindie H. 2018. Unpacking Dutch multifunctional agrarian pathways as processes of peasantisation and agrarianisation. Journal of Rural Studies, 61: 255-264.

[32]
Pinto-Correia T, Breman B. 2009. New roles for farming in a differentiated countryside: The Portuguese example. Regional Environmental Change, 9(3): 143-152.

[33]
Rossing W A H, Zander P, Josien E, et al. 2007. Integrative modelling approaches for analysis of impact of multifunctional agriculture: A review for France, Germany and The Netherlands. Agriculture, Ecosystems & Environment, 120(1): 41-57.

[34]
Serra P, Vera A, Tulla A F, et al. 2014. Beyond urban-rural dichotomy: Exploring socioeconomic and land-use processes of change in Spain (1991-2011). Applied Geography, 55: 71-81.

[35]
Shi Z H, Ma L B, Zhang W B, et al. 2022. Differentiation and correlation of spatial pattern and multifunction in rural settlements considering topographic gradients: Evidence from Loess Hilly Region, China. Journal of Environmental Management, 315: 115127. DOI: 10.1016/j.jenvman.2022.115127.

[36]
Shortall S, Warner M E. 2012. Rural transformations: Conceptual and policy issues. In: Shucksmith M, Brown D L, Shortall S, et al (eds.). Rural transformations and rural policies in the US and UK. UK: Routledge.

[37]
Slee B. 2007. Social indicators of multifunctional rural land use: The case of forestry in the UK. Agriculture, Ecosystems & Environment, 120(1): 31-40.

[38]
Stola W. 1980. A funtional classification of the rural areas in the Suwatki Voivodship. Proceeding in the 4th Hunqarian-Qolish Seminar Goldap, 20-30. Cracow, Polish: Institute of Geography and Spatial Organization, Polish Academy of Sciences.

[39]
Tu S S, Long H L. 2017. Rural restructuring in China: Theory, approaches and research prospect. Journal of Geographical Sciences, 27(10): 1169-1184.

DOI

[40]
Van der Ploeg J D, Renting H, Brunori G, et al. 2000. Rural development: From practices and policies towards theory. Sociologia Ruralis, 40(4): 391-408.

[41]
Van der Ploeg J D, Roep D. 2003. Multifunctionality and rural development: The actual situation in Europe. Multifunctional Agriculture: A New Paradigm for European Agriculture and Rural Development, 3: 37-54.

[42]
Willemen L, Hein L, van Mensvoort M E F, et al. 2010. Space for people, plants, and livestock? Quantifying interactions among multiple landscape functions in a Dutch rural region. Ecological Indicators, 10(1): 62-73.

[43]
Xie L. 2020. The ideal level of urbanization in the future China and the Chinese solution for rural governance. Wuhan University Journal (Philosophy & Social Sciences), 73(3): 159-168. (in Chinese)

[44]
Xu K, Fang Y G. 2019. Spatial differentiation and type identification of rural territorial multi-functions in Liaoning Province. Geographical Research, 38(3): 482-495. (in Chinese)

[45]
Zhang L, Wang Z, Wei C, et al. 2019. Rural revitalization strategy based on the perspective of rural multifunctions: A case of the mountainous areas in Yunyang District of Shiyan City, western Hubei Province. Resources Science, 41(9): 1703-1713. (in Chinese)

[46]
Zhou Y, Guo Y, Liu Y. 2019. Areal types and their development paths in rural China. Geographical Research, 38(3): 467-481. (in Chinese)

[47]
Zou L, Liu Y, Yang J, et al. 2020. Quantitative identification and spatial analysis of land use ecological-production-living functions in rural areas on China’s southeast coast. Habitat International, 100: 102182. DOI: 10.1016/j.habitatint.2020.102182.

Outlines

/