
Journal of Resources and Ecology >
Integrating Accessibility and Green View Index for Human-scale Street Greening Initiatives: A Case Study within Chengdu’s Fourth Ring Road
|
HUANG Zhongshan, E-mail: hzs342601@gmail.com |
Received date: 2024-04-25
Accepted date: 2024-07-20
Online published: 2025-03-28
Supported by
The Philosophy and Social Science Foundation Project of Sichuan Province(SCJJ23ND494)
The Fundamental Research Funds for the Central Universities-Scientific Innovation Project(XJ2023009801)
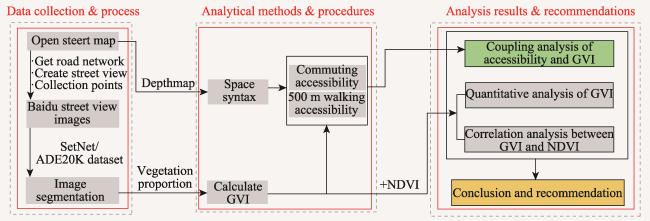
Street greening is a popular topic in urban design research. Traditionally, assessments for urban greening levels using Normalised Difference Vegetation Index (NDVI) from satellite remote sensing images, often overlooking street greening from a human-scale perspective. This study combined spatial syntax, machine learning techniques, streetscape images, and remote sensing data to comprehensively assess thoroughly analyse street greening levels in Chengdu’s Fourth Ring Road. Additionally, by integrating accessibility analysis with Green View Index (GVI), this study identified areas that should be prioritised for street greening interventions. The results indicate that: (1) Streets in the western and southern regions of Chengdu City’s Fourth Ring Road possessed higher GVI. (2) There is a significant difference in the overall distributions of GVI and NDVI, particularly in the central and eastern regions. (3) Streets with “high commuting and walking accessibility (low GVI) overlapped in the area east of Shuncheng Avenue. The methodology presented in this study can serve as a reference for human-scale street greening in Chengdu and other cities.
HUANG Zhongshan , LUO Shixian , CAI Yiqing , LU Zhengyan . Integrating Accessibility and Green View Index for Human-scale Street Greening Initiatives: A Case Study within Chengdu’s Fourth Ring Road[J]. Journal of Resources and Ecology, 2025 , 16(2) : 356 -367 . DOI: 10.5814/j.issn.1674-764x.2025.02.006
Figure 1 Research framework |
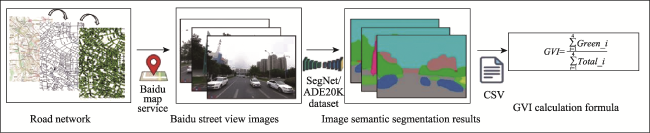
Figure 2 GVI calculation process using SegNet semantic segmentation |
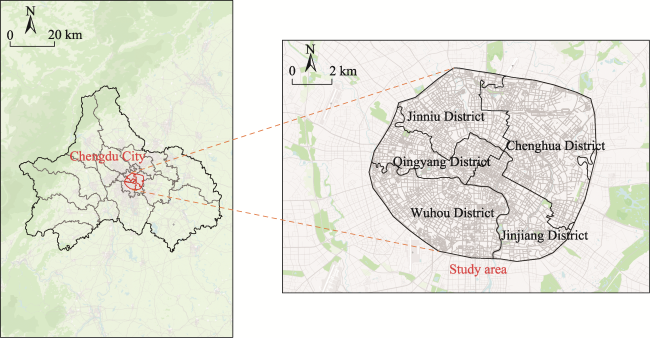
Figure 3 Study area |
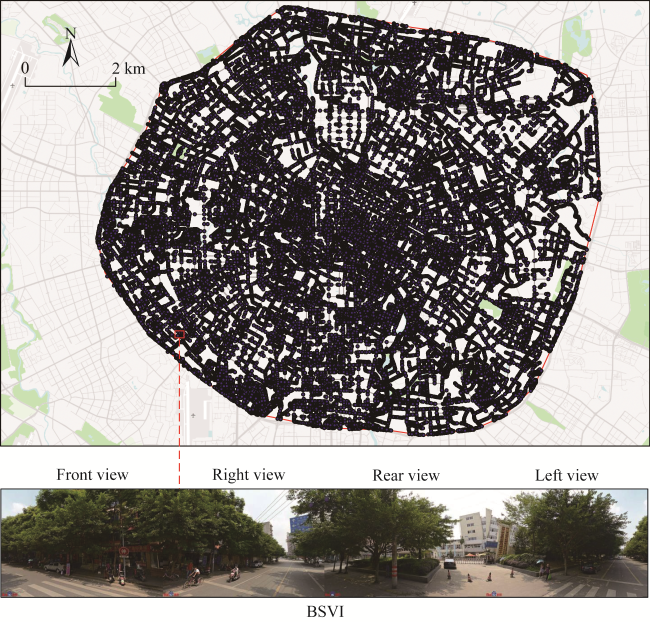
Figure 4 Results of Baidu Street View image collectionNote: The downside figure is an example of a street view map. |
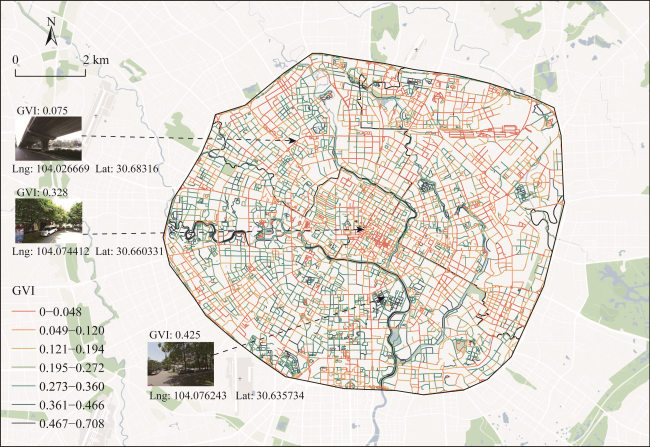
Figure 5 Street level distribution of GVI in the study area |
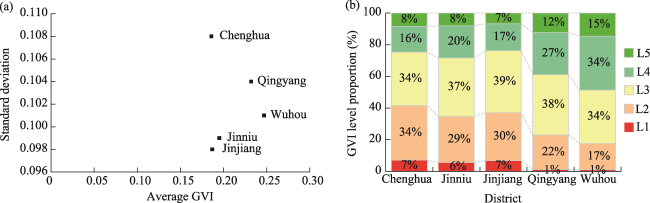
Figure 6 Distribution of GVI in different zones (a) Mean and standard deviation of GVI in each zone; (b) Proportion of five GVI levels in five zones, with levels including L1 (0-0.05), L2 (0.05-0.15), L3 (0.15-0.25), L4 (0.25-0.35) and L5 (0.35-1) |
Table 1 Summary statistics of green visual index (GVI) for different land use types |
| Land use function | Average value | Standard deviation | Minimum value | Maximum value |
|---|---|---|---|---|
| Residential land (R) | 0.182 | 0.139 | 0.000 | 0.539 |
| Land for commercial service facilities (B) | 0.118 | 0.125 | 0.000 | 0.607 |
| Industrial land (M) | 0.082 | 0.108 | 0.000 | 0.401 |
| Land for roads and transportation facilities (S) | 0.127 | 0.081 | 0.000 | 0.245 |
| Public management and public service land (A) | 0.201 | 0.158 | 0.000 | 0.615 |
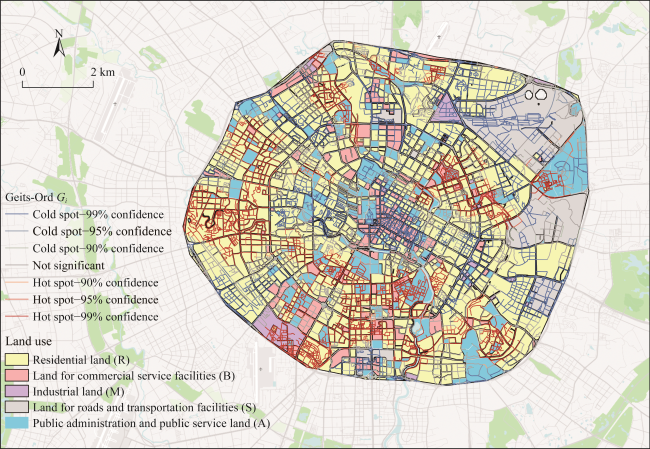
Figure 7 Overlay map of hotspot analysis and urban construction land types |
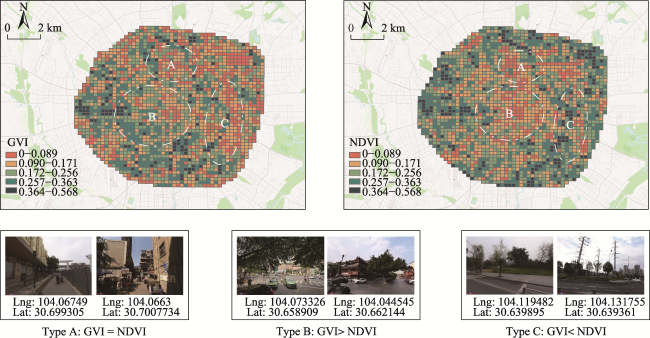
Figure 8 Distribution differences between the GVI and NDVI |
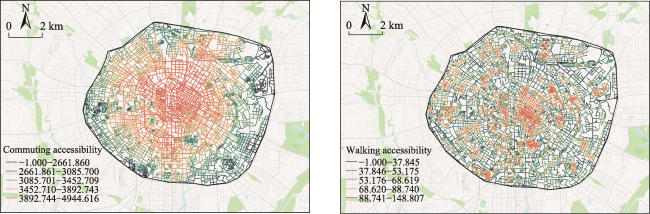
Figure 9 Commuting and walking accessibility at the street level in the study area |
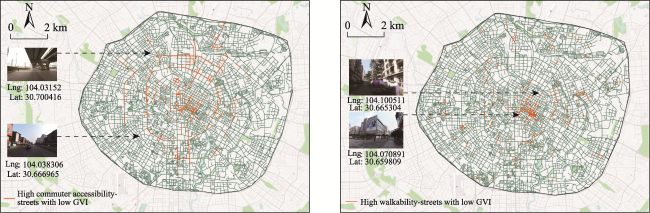
Figure 10 Streets with high accessibility and low GVI |
| [1] |
|
| [2] |
|
| [3] |
|
| [4] |
|
| [5] |
|
| [6] |
|
| [7] |
|
| [8] |
|
| [9] |
|
| [10] |
|
| [11] |
|
| [12] |
|
| [13] |
|
| [14] |
|
| [15] |
|
| [16] |
|
| [17] |
|
| [18] |
|
| [19] |
|
| [20] |
|
| [21] |
|
| [22] |
|
| [23] |
|
| [24] |
|
| [25] |
|
| [26] |
|
| [27] |
|
| [28] |
|
| [29] |
|
| [30] |
|
| [31] |
|
| [32] |
|
| [33] |
|
| [34] |
|
| [35] |
|
/
| 〈 |
|
〉 |