
Journal of Resources and Ecology >
Characterization of Spatial-temporal Evolution of Landscape Ecological Risk in the Three-River Source Region
|
LI Hui, E-mail: lihui_2012@126.com |
Received date: 2024-04-20
Accepted date: 2024-07-30
Online published: 2025-03-28
Supported by
The National Natural Science Foundation of China(42171223)
The National Social Science Foundation of China(19BJY205)
The Department of Education Youth Science and Technology Talent Growth Fund of Guizhou([2022]107)
The Mountain Discipline Construction Project of Minzu Normal University of Xingyi(XKJS202332)
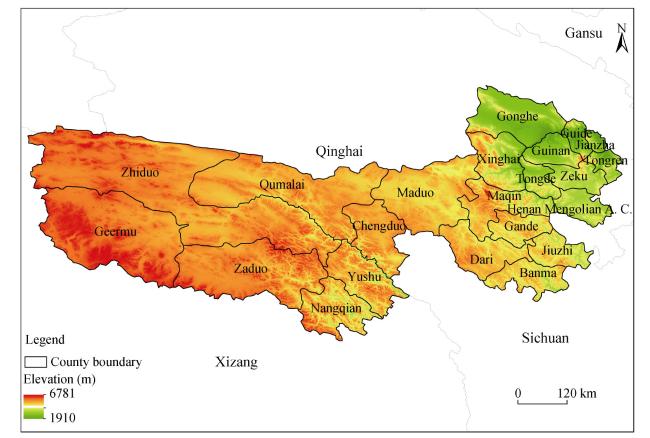
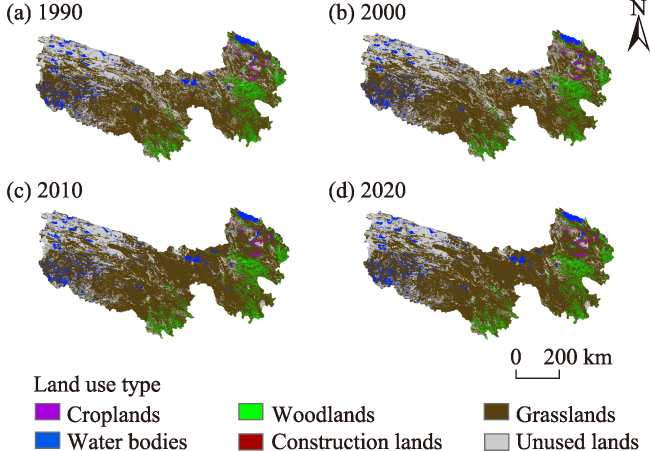
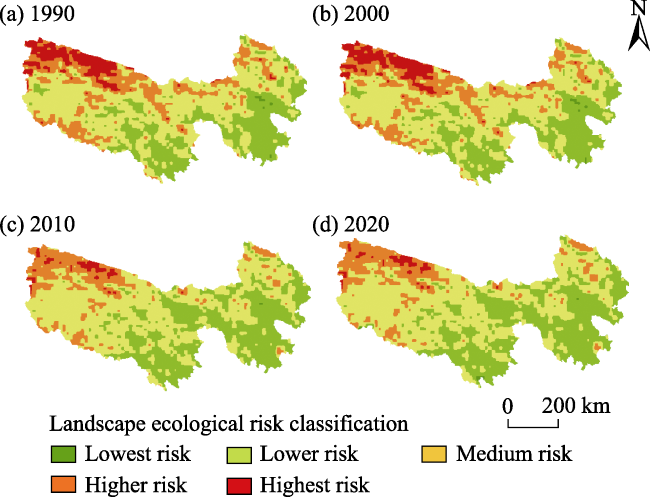
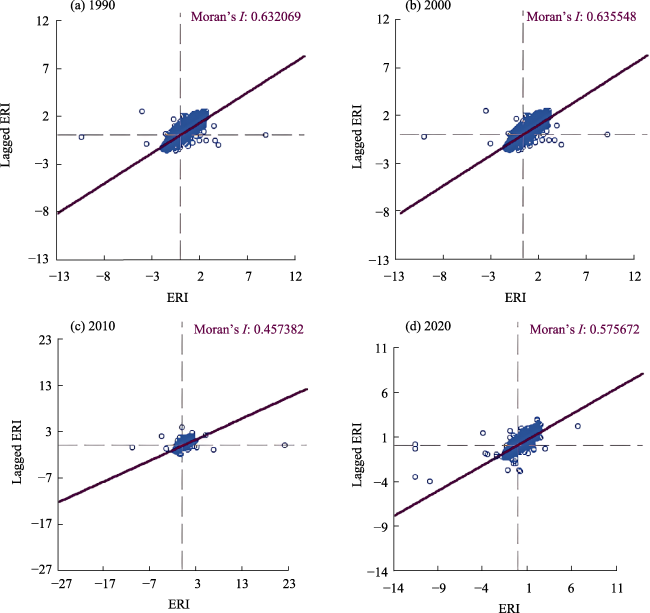
The Three-River Source Region is an important ecological security barrier in China. Revealing the spatiotemporal evolution characteristics of its landscape types and ecological risks is of great significance for promoting ecological restoration and landscape pattern optimization in the Three-River Source Region. Selecting the Three-River Source Region for a case study and applying the land-use data from four periods (the 1990, 2000, 2010, and 2020), we constructed a landscape ecological risk assessment model for the region based on the landscape pattern index. We then quantitatively assessed the ecological risks and determined the characteristics of their spatial-temporal evolution. The results showed that: (1) The overall landscape ecological risk in the Three- River Source Region tended to decrease from northwest to southeast, and the distribution of landscape ecological risk was closely related to the natural plateau zones and the changes in land cover. (2) From 1990 to 2020, the areas covered by grasslands, water bodies, croplands, and construction land in the Three-River Source Region increased, while the areas of woodlands and unused land decreased. The spatial-temporal changes in the ecological landscape risk were consistent with the characteristics of the changes in the landscape types. The areas categorized as highest, higher, medium, lower and lowest risk areas, while highest and higher risk areas decreased by 9.76%, medium risk areas increased by 1.03%, lower risk areas increased by 8.99%, and lowest risk areas decreased by 0.26%, respectively. (3) Overall, the Three-River Source Region was dominated by very low to medium ecological risk, the areas of which accounted for more than 70% of the entire study area. Overall ecological risks are decreasing, and there is positive spatial autocorrelation of landscape ecological risks in adjacent evaluation units.
LI Hui , ZHOU Bin , WU Xiaoying . Characterization of Spatial-temporal Evolution of Landscape Ecological Risk in the Three-River Source Region[J]. Journal of Resources and Ecology, 2025 , 16(2) : 326 -339 . DOI: 10.5814/j.issn.1674-764x.2025.02.004
Figure 1 Location of the Three-River Source RegionNote: Henan Mongolian A. C. in the figure represents Henan Mongolian Autonomous County. |
Table 1 Landscape pattern indices and their ecological definitions |
| Landscape pattern index | Formula | Description |
|---|---|---|
| Landscape fragmentation index (Ci) | ${{C}_{i}}={{n}_{i}}/{{A}_{i}}$ | Ci denotes the fragmentation index of landscape type i, with larger values representing less internal landscape stability; ni indicates the number of patches of landscape type i; Ai denotes the area of landscape type i (Zhang et al., 2018) |
| Landscape segmentation index (Ni) | ${{N}_{i}}=\sqrt{\frac{{{n}_{i}}}{A}}\times \frac{A}{2{{A}_{i}}}$ | Ni indicates the degree of spatial segmentation of patches of landscape type i, with larger values representing a more complex spatial distribution of various patches of the landscape; ni indicates the number of patches for the type of landscape i; A denotes the total area of the entire landscape; Ai denotes the area of landscape type i (Qu et al., 2022) |
| Landscape dominance index (Fi) | ${{F}_{i}}=\frac{{{M}_{i}}+{{L}_{i}}+{{P}_{i}}}{3}$ | Fi denotes the degree of landscape dominance, with larger values representing higher importance of the patch in the landscape; Mi denotes the patch frequency; Li denotes the patch density; Pi denotes the proportion of patches (Xie, 2008); |
| Landscape disturbance index (Ei) | ${{E}_{i}}=a{{C}_{i}}$+$b{{N}_{i}}$+$c{{F}_{i}}$ | Ei denotes the degree of disturbance of regional ecosystems; a, b, c are the weights of the landscape fragmentation index, landscape segmentation index, and landscape dominance index, respectively,$a+b+c=1$ The values of 0.5, 0.3, and 0.2 were assigned based on the results of prior studies and the actual situation in the study area (Xie, 2013); |
| Landscape vulnerability (Di) | Unused lands = 6; water bodies = 5; croplands= 4; grasslands = 3; woodlands = 2; construction lands = 1; normalized | Di denotes the resistance of different landscapes to external interference; Landscape vulnerability indicates the ability of different landscape types to resist external risks and disturbances. Larger values represent increased sensitivity and less resistance to disturbances (Qu et al., 2022) |
| Landscape loss index (Ri) | ${{R}_{i}}=\sqrt{{{E}_{i}}/{{D}_{i}}}$ | Ri indicates the landscape loss index (Zhang et al., 2018) |
| Landscape ecological risk index (ERIk) | $ER{{I}_{k}}=\underset{i=1}{\overset{n}{\mathop \sum }}\,\frac{{{A}_{ki}}}{{{A}_{k}}}\times {{R}_{i}}$ | ERIk denotes the landscape ERI of the k-th assessment unit; n is the number of landscape types; Aki is the area of the landscape type i in the risk communities of risk k; and Ak is the total area of the risk communities (Zhang et al., 2018) |
Figure 2 Land use types of the Three-River Source Region from 1990 to 2020 |
Table 2 Transfer of land use types in the Three-River Source Region from 1990 to 2020 (unit: km2) |
| Transfer of land use types | 1990-2000 | 2000-2010 | 2010-2020 |
|---|---|---|---|
| Croplands→Woodlands | 0.03 | 0.92 | 2.97 |
| Croplands→Grasslands | 1.15 | 118.96 | 54.19 |
| Croplands→Water bodies | 12.52 | 18.97 | 10.71 |
| Croplands→Construction lands | 4.80 | 5.99 | 9.49 |
| Croplands→Unused lands | 5.92 | 0.66 | 3.65 |
| Woodlands→Croplands | 7.30 | 0.91 | 3.69 |
| Woodlands→Grasslands | 38.21 | 271.76 | 768.03 |
| Woodlands→Water bodies | 5.81 | 7.83 | 10.06 |
| Woodlands→Construction lands | 0.04 | 0.62 | 1.51 |
| Woodlands→Unused lands | 0.25 | 9.16 | 15.37 |
| Grasslands→Croplands | 120.09 | 348.34 | 53.41 |
| Grasslands→Woodlands | 50.94 | 203.14 | 771.93 |
| Grasslands→Water bodies | 109.40 | 276.82 | 539.95 |
| Grasslands→Construction lands | 5.47 | 24.35 | 71.47 |
| Grasslands→Unused lands | 246.84 | 4487.29 | 1183.75 |
| Water bodies→Croplands | 6.69 | 4.09 | 8.75 |
| Water bodies→Woodlands | 0.46 | 2.10 | 7.51 |
| Water bodies→Grasslands | 133.72 | 101.05 | 591.62 |
| Water bodies→Construction lands | 0.10 | 0.08 | 2.32 |
| Water bodies→Unused lands | 114.13 | 80.35 | 239.33 |
| Construction lands→Croplands | 0.04 | 1.50 | 7.01 |
| Construction lands→Woodlands | 0.00 | 0.08 | 0.42 |
| Construction lands→Grasslands | 0.02 | 1.14 | 15.49 |
| Construction lands→Water bodies | 0.00 | 1.52 | 0.74 |
| Construction lands→Unused lands | 0.00 | 0.05 | 0.38 |
| Unused lands→Woodlands | 0.50 | 24.89 | 17.22 |
| Unused lands→Grasslands | 146.85 | 20077.32 | 1165.47 |
| Unused lands→Water bodies | 49.55 | 924.53 | 332.27 |
| Unused lands→Construction lands | 0.02 | 3.34 | 6.88 |
| Unused lands→Croplands | 6.72 | 7.04 | 4.38 |
Figure 3 ERI Distribution in the Three-River Source Region |
Table 3 Landscape ecological risk area and proportion in the Three-River Source Region from 1990 to 2020 |
| Year | Lowest risk | Lower risk | Medium risk | Higher risk | Highest risk | |||||
|---|---|---|---|---|---|---|---|---|---|---|
| Area (103 km2) | Proportion (%) | Area (103 km2) | Proportion (%) | Area (103 km2) | Proportion (%) | Area (103 km2) | Proportion (%) | Area (103 km2) | Proportion (%) | |
| 1990 | 1.58 | 0.41% | 104.57 | 27.35 | 174.93 | 45.74 | 71.22 | 18.62 | 30.12 | 7.88 |
| 2000 | 1.77 | 0.46% | 106.93 | 27.96 | 172.76 | 45.18 | 71.29 | 18.64 | 29.67 | 7.76 |
| 2010 | 0.23 | 0.06% | 137.38 | 35.92 | 180.12 | 47.10 | 55.46 | 14.50 | 9.23 | 2.41 |
| 2020 | 0.57 | 0.15% | 138.97 | 36.34 | 178.86 | 46.77 | 55.71 | 14.57 | 8.31 | 2.17 |
Figure 4 Moran’s I of ERI in the Three-River Source Region |
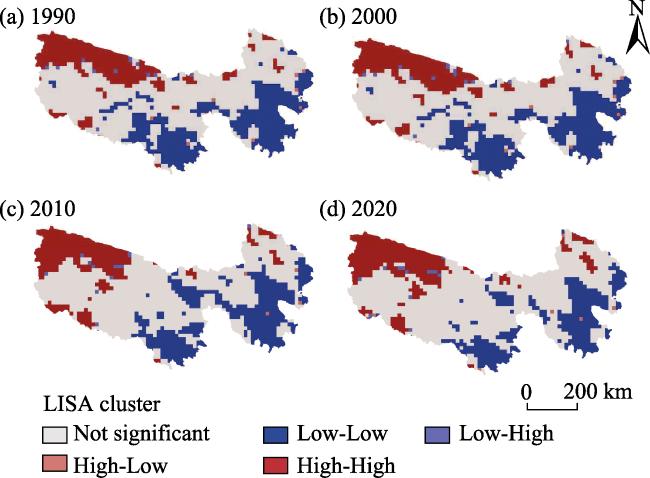
Figure 5 LISA distribution of ERI in the Three-River Source Region |
| [1] |
|
| [2] |
|
| [3] |
|
| [4] |
|
| [5] |
|
| [6] |
|
| [7] |
|
| [8] |
|
| [9] |
|
| [10] |
|
| [11] |
|
| [12] |
|
| [13] |
|
| [14] |
|
| [15] |
|
| [16] |
|
| [17] |
|
| [18] |
|
| [19] |
|
| [20] |
|
| [21] |
|
| [22] |
|
| [23] |
|
| [24] |
|
| [25] |
|
| [26] |
|
| [27] |
|
| [28] |
|
| [29] |
|
| [30] |
|
| [31] |
|
| [32] |
|
| [33] |
|
| [34] |
|
| [35] |
|
| [36] |
|
| [37] |
|
| [38] |
|
| [39] |
|
| [40] |
|
| [41] |
|
| [42] |
|
| [43] |
|
| [44] |
|
| [45] |
|
| [46] |
|
| [47] |
|
| [48] |
|
| [49] |
|
| [50] |
|
| [51] |
|
| [52] |
|
| [53] |
|
| [54] |
|
| [55] |
|
| [56] |
|
| [57] |
|
| [58] |
|
| [59] |
|
| [60] |
|
| [61] |
|
| [62] |
|
| [63] |
|
| [64] |
|
| [65] |
|
| [66] |
|
| [67] |
|
| [68] |
|
| [69] |
|
| [70] |
|
| [71] |
|
| [72] |
|
| [73] |
|
/
| 〈 |
|
〉 |