
Journal of Resources and Ecology >
Spatial-temporal Evolution and Driving Factors of Habitat Quality Based on Different Topographic Gradients in Zhaotong City, Yunnan Province
|
CHEN Hongmin, E-mail: 424792081@qq.com |
Received date: 2024-04-15
Accepted date: 2024-08-10
Online published: 2025-03-28
Supported by
The Scientific Research Fund Project of Yunnan Education Department(2024J0634)
The Talent Project of Yunnan University of Finance and Economics(2022D13)
The Foundation of Yunnan Key Laboratory of Service Computing(YNSC24305)
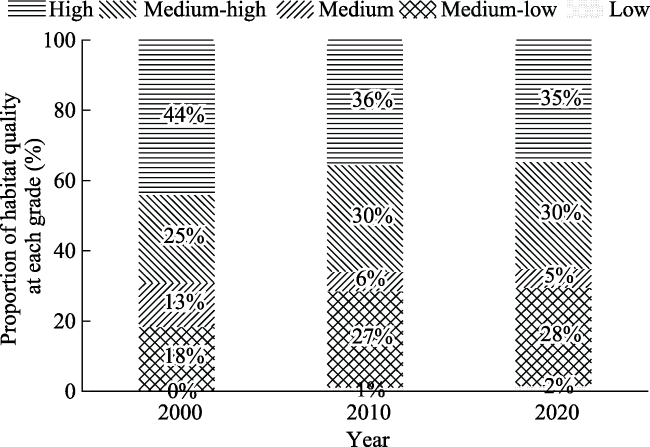
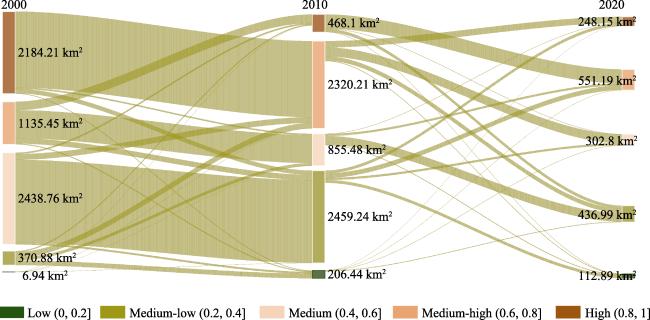
Habitat quality plays a crucial role in enhancing the regional ecological environment and safeguarding biodiversity, with topography being a key element influencing the structure and function of ecosystem services. This research aims to assess habitat suitability across various topographic gradients, analyze the spatial heterogeneity of habitat quality between 2000 and 2020, and explore the relationship between influencing factors and habitat quality. InVEST model is used to evaluate the spatial-temporal evolution characteristics of habitat quality in Zhaotong City, focusing on how topographic gradients impact habitat quality distribution. The study also delves into the factors affecting habitat quality in Zhaotong City, including land use patterns, elevation, slope, average annual temperature and other variables. The results indicate three key aspects of this system. (1) During the study period, the land use types were mainly forest land, farmland and grassland, with construction land experiencing the most significant increase. (2) From 2000 to 2020, the quality areas of high and medium habitats in Zhaotong City decreased, while the quality areas of medium-high, medium-low and low habitats increased. (3) The study revealed a notable topographic gradient effect on habitat quality, with the primary driver shifting from GDP to land use type and subsequently to average annual precipitation in Zhaotong City. The transfer between different grades of habitat quality mainly presents the characteristics of “descending” transfer, with medium-low quality habitats typically found on medium-low topographic gradients and medium-high quality habitats on medium-high gradients. Cross-detection results show that land use type exhibited the strongest correlation with other influencing factors. Therefore, this study can provide a scientific basis for policy makers to protect biodiversity, enhance ecosystem services and promote regional economic development.
Key words: habitat quality; InVEST model; topographic gradients; Geo-detector; Zhaotong City
CHEN Hongmin , LIU Fenglian , YANG Bowen , LUO Qinqin . Spatial-temporal Evolution and Driving Factors of Habitat Quality Based on Different Topographic Gradients in Zhaotong City, Yunnan Province[J]. Journal of Resources and Ecology, 2025 , 16(2) : 306 -325 . DOI: 10.5814/j.issn.1674-764x.2025.02.003
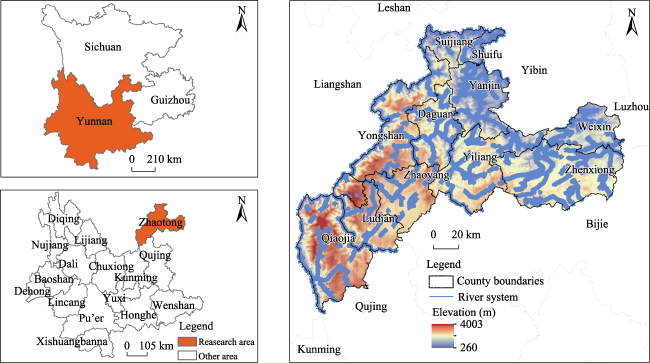
Figure 1 Location of the study area |
Table 1 Threat factor weights and maximum impact distances |
| Stress factors | Maximum stress distance | Weight | Spatial attenuation mode |
|---|---|---|---|
| Farmland | 5 | 0.7 | Linear decay |
| Construction land | 10 | 1.0 | Exponential decay |
| National highway | 7 | 0.5 | Linear decay |
| Provincial highway | 4 | 0.4 | Linear decay |
Table 2 Habitat suitability and sensitivity to threat factors for different land use types |
| Land use type | Habitat suitability | Stress factor | |||
|---|---|---|---|---|---|
| Farmland | Construction land | National highway | Provincial highway | ||
| Farmland | 0.4 | 0 | 0.8 | 0.2 | 0.2 |
| Forest land | 1 | 0.4 | 0.7 | 0.4 | 0.45 |
| Grassland | 0.75 | 0.4 | 0.6 | 0.4 | 0.6 |
| Water area | 0.9 | 0.7 | 0.8 | 0.35 | 0.5 |
| Construction | 0 | 0 | 0 | 0 | 0 |
| Unutilized land | 0 | 0 | 0 | 0 | 0 |
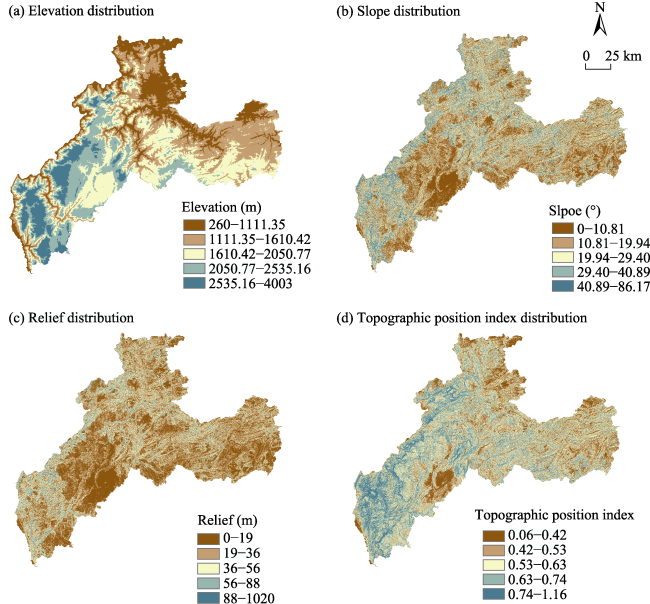
Table 3 Standards of elevation, slope, topographic relief and topographic position index |
| Grade | Elevation (m) | Slope (°) | Topographic relief (m) | Topographic position index |
|---|---|---|---|---|
| $\text{I}$ | [260, 1111.35] | [0, 10.81] | [0, 19] | [0.06, 0.42] |
| II | (1111.35, 1610.42] | (10.81, 19.94] | (19, 36] | (0.42, 0.53] |
| $\text{III}$ | (1610.42, 2050.77] | (19.94, 29.40] | (36, 56] | (0.53, 0.63] |
| IV | (2050.77, 2535.16] | (29.40, 40.89] | (56, 88] | (0.63, 0.74] |
| V | (2535.16, 4003] | (40.89, 86.17] | (88, 1020] | (0.74, 1.16] |
Table 4 Types of two-factor interactions |
| Basis of judgment | Interaction |
|---|---|
| q(X1$\cap$X2)<min[q(X1),(X2)] | Nonlinearity attenuation |
| min[q(X1),(X2)]<q(X1$\cap$X2)<max[q(X1),(X2)] | Reduced single-factor nonlinearity |
| q(X1$\cap$X2)> max[q(X1),(X2)] | Two-factor enhancement |
| q(X1$\cap$X2)= q(X1)+q(X2) | Independent |
| q(X1$\cap$X2)> q(X1)+q(X2) | Nonlinear enhancement |
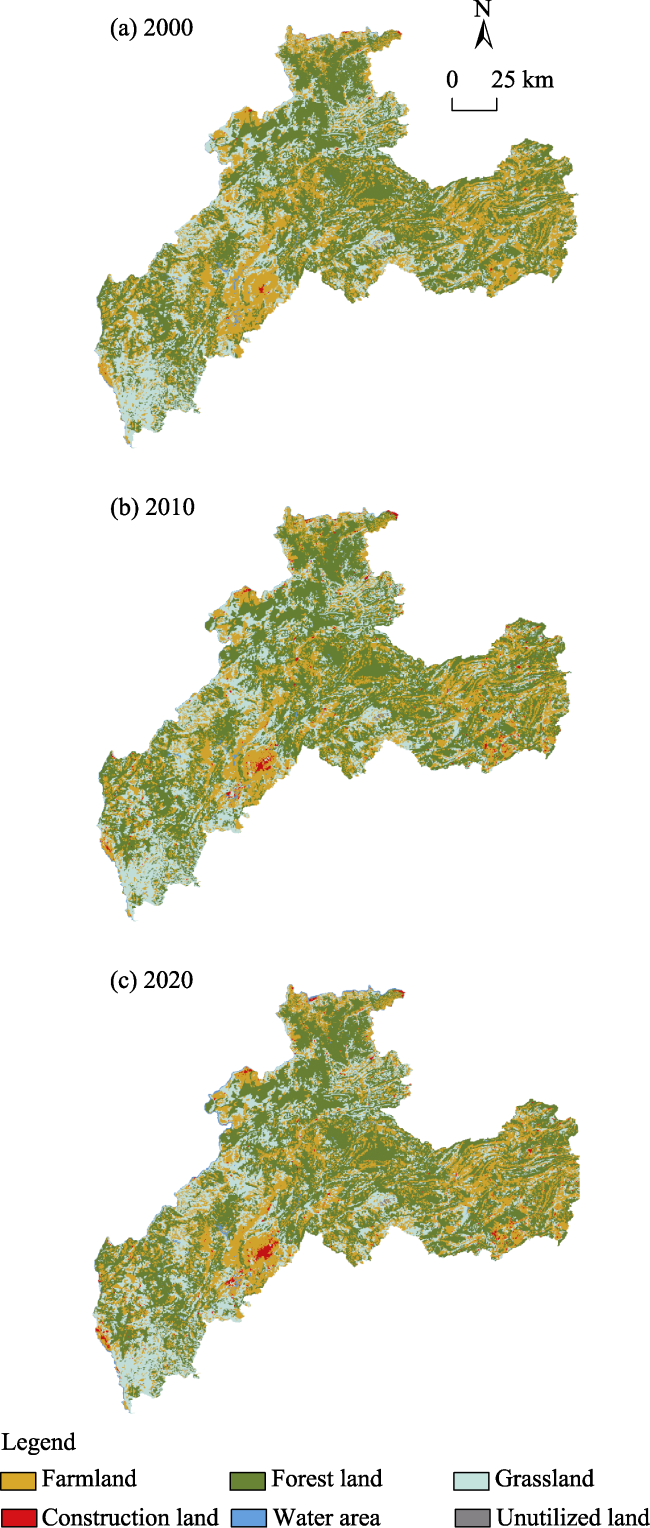
Figure 2 Land use in Zhaotong City in 2000, 2010, 2020 |
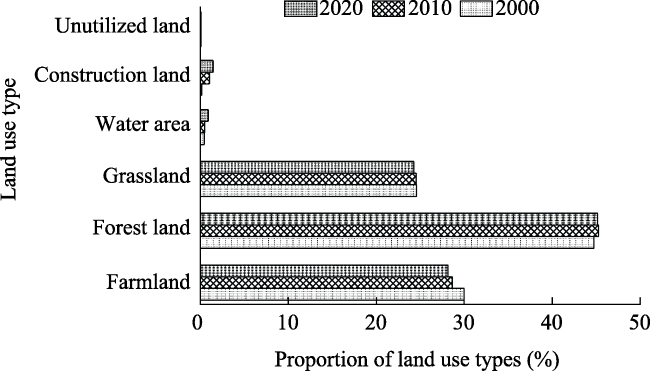
Figure 3 Area proportion of land use types in Zhaotong City |
Table 5 Dynamic degree of land use types in Zhaotong City |
| Land use types | 2000-2010 | 2010-2020 | 2000-2020 | |||
|---|---|---|---|---|---|---|
| Range of change (km2) | Single dynamic degree (%) | Range of change (km2) | Single dynamic degree (%) | Range of change (km2) | Single dynamic degree (%) | |
| Farmland | -309.13 | -0.46 | -102.29 | -0.16 | -411.42 | -0.31 |
| Forest land | 116.04 | 0.12 | -25.53 | -0.03 | 90.51 | 0.05 |
| Grassland | -15.76 | -0.03 | -55.57 | -0.10 | -71.32 | -0.06 |
| Construction land | 201.80 | 58.98 | 91.29 | 3.87 | 293.09 | 42.83 |
| Water area | 9.38 | 0.94 | 92.35 | 8.44 | 101.73 | 5.08 |
| Unutilized land | -2.30 | -1.36 | -1.66 | -1.13 | -3.96 | 1.17 |
| Comprehensive dynamic degree (%) | 0.15 | 0.08 | 0.11 | |||
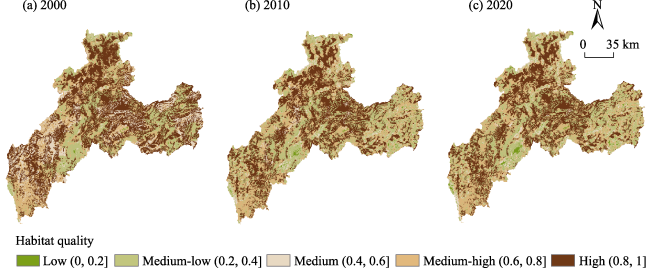
Figure 4 Spatial distribution of habitat quality in Zhaotong City |
Figure 5 Habitat quality at different grades |
Figure 6 Sankey map of habitat quality transfer |
Figure 7 Terrain feature of Zhaotong City |
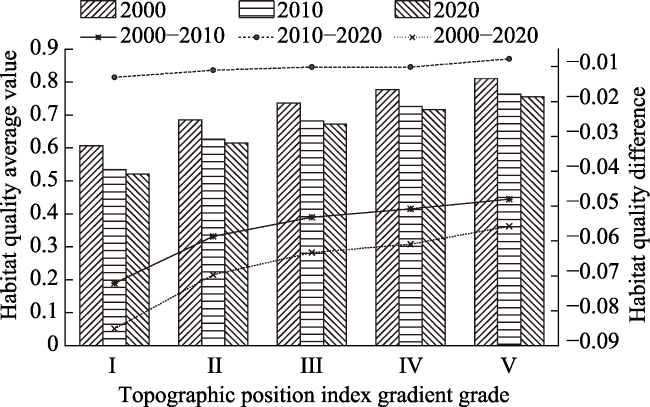
Figure 8 Average value and difference of HQ at different topographic gradients |
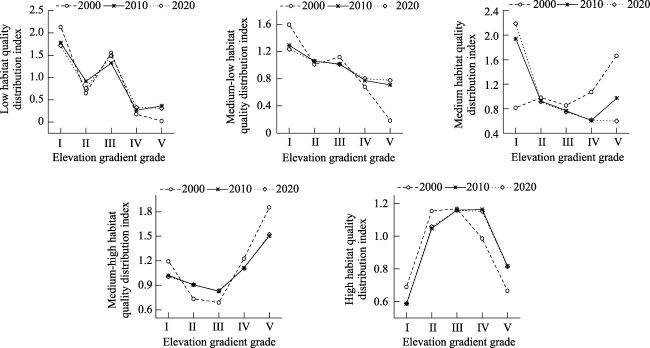
Figure 9 Distribution of habitat quality on elevation gradients |
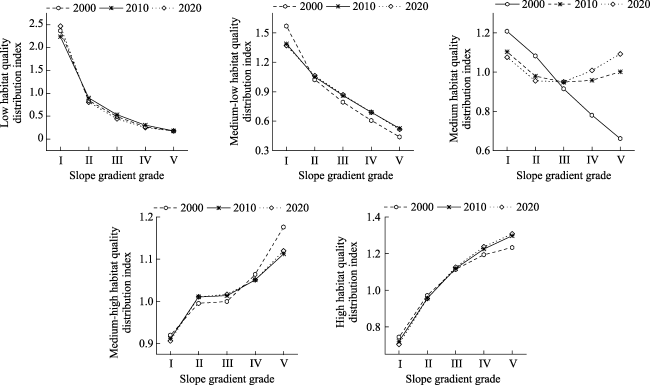
Figure 10 Habitat quality distribution on slope gradients |
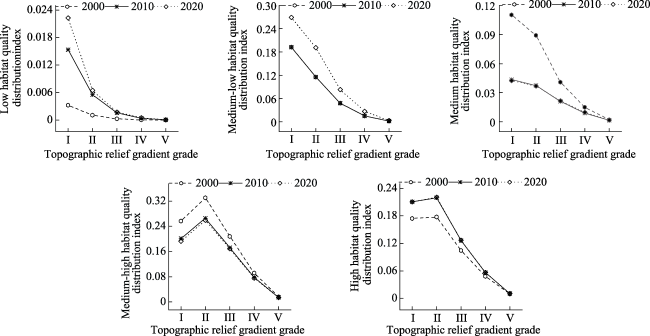
Figure 11 Distribution of habitat quality on topographic relief gradients |
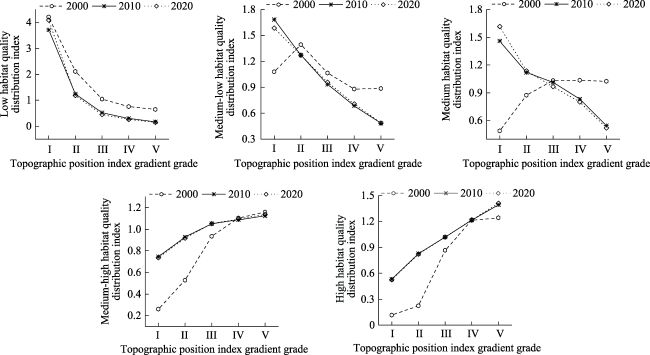
Figure 12 Distribution of habitat quality at topographic position index gradients |
Table 6 Detection results of factors affecting HQ |
| Driving factors | q value | ||
|---|---|---|---|
| 2000 | 2010 | 2020 | |
| Average annual temperature | 0.4282 | 0.4411 | 0.4508 |
| Average annual precipitation | 0.3662 | 0.4397 | 0.5935 |
| GDP | 0.8157 | 0.3793 | 0.5037 |
| Population density | 0.3539 | 0.5073 | 0.5639 |
| Elevation | 0.2089 | 0.3080 | 0.3033 |
| Slope | 0.4989 | 0.2141 | 0.3822 |
| NDVI | 0.4551 | 0.2465 | 0.5693 |
| NPP | 0.5385 | 0.5885 | 0.3844 |
| Land use type | 0.5614 | 0.8362 | 0.4615 |
| Topographic relief | 0.4165 | 0.2410 | 0.3587 |
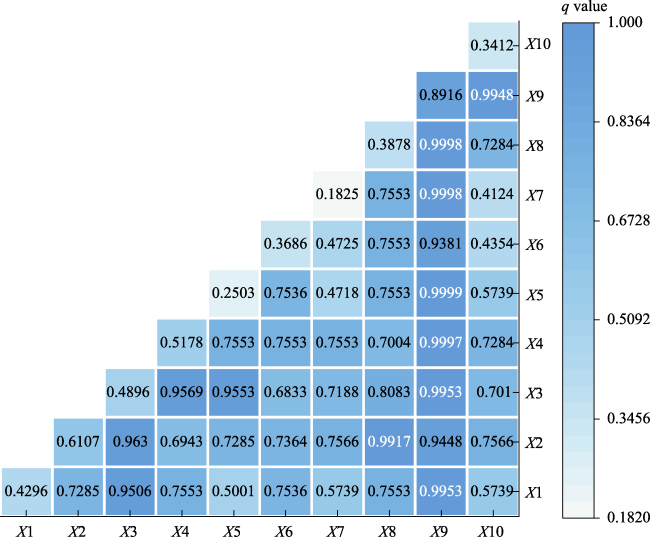
Figure 13 Interactive detection results of habitat quality |
Table 7 Land use change and dynamic degree in Zhaotong City from 2000 to 2020 |
| County/District | Farmland | Forest land | Grassland | Construction land | ||||
|---|---|---|---|---|---|---|---|---|
| Area of change (km2) | Dynamic degree (%) | Area of change (km2) | Dynamic degree (%) | Area of change (km2) | Dynamic degree (%) | Area of change (km2) | Dynamic degree (%) | |
| Ludian | -120.70 | -1.10 | -36.51 | -0.32 | 84.19 | 1.91 | 25.47 | 4.72 |
| Zhaoyang | -53.11 | -0.28 | 21.05 | 0.16 | 74.16 | -0.35 | 69.62 | 4.46 |
| Zhenxiong | -70.60 | -0.26 | -1.19 | 0.00 | 69.42 | 0.06 | 61.85 | 4.70 |
| Yiliang | 5.62 | 0.04 | -18.84 | -0.06 | -24.46 | 0.04 | 9.26 | 4.53 |
| Weixin | -28.88 | -0.29 | -4.06 | -0.03 | 24.83 | 0.22 | 24.48 | 4.66 |
| Daguan | -18.38 | -0.20 | 5.73 | 0.03 | 24.10 | 0.06 | 5.87 | 4.45 |
| Yanjin | 6.62 | 0.09 | -7.89 | -0.04 | -14.51 | -0.25 | 16.69 | 4.37 |
| Yongshan | -44.22 | -0.32 | 34.75 | 0.16 | 78.96 | -0.24 | 16.38 | 3.91 |
| Shuifu | -14.35 | -0.60 | 1.09 | 0.02 | 15.44 | -0.31 | 7.44 | 3.50 |
| Suijiang | -25.37 | -0.47 | 10.29 | 0.15 | 35.66 | -0.70 | 10.41 | 3.46 |
| Qiaojia | -46.56 | -0.33 | 86.04 | 0.36 | 132.60 | -0.37 | 45.59 | 4.79 |
Table 8 Average value of habitat quality at different topographic locations in Zhaotong City |
| Topographic position index grade | Average habitat quality | 2000-2020 change value | ||
|---|---|---|---|---|
| 2000 | 2010 | 2020 | ||
| I | 0.6066 | 0.5345 | 0.5213 | -0.0852 |
| II | 0.6852 | 0.6265 | 0.6156 | -0.0696 |
| III | 0.7357 | 0.6825 | 0.6725 | -0.0632 |
| IV | 0.7775 | 0.7266 | 0.7165 | -0.0610 |
| V | 0.8114 | 0.7633 | 0.7555 | -0.0559 |
Table 9 Structural characteristics of land use types at different topographic locations |
| Topographic position index grade | Proportion by land use type 2000/2010/2020 (%) | |||||
|---|---|---|---|---|---|---|
| Farmland | Forest land | Grassland | Water area | Construction land | Unutilized land | |
| I | 20.53/20.23/19.53 | 12.17/12.67/12.59 | 7.44/7.66/7.32 | 0.87/1.04/1.91 | 0.34/1.74/2.68 | 0.05/0.06/0.05 |
| II | 30.54/30.50/30.78 | 32.20/33.82/34.12 | 17.49/18.79/18.84 | 0.31/0.32/0.68 | 0.11/1.10/1.48 | 0.08/0.08/0.07 |
| III | 27.21/27.36/27.73 | 43.98/46.54/47.19 | 24.57/26.00/26.30 | 0.14/0.14/0.32 | 0.03/0.53/0.64 | 0.07/0.06/0.06 |
| IV | 16.22/16.40/16.52 | 40.20/42.76/43.52 | 21.21/21.98/22.31 | 0.06/0.07/0.13 | 0.02/0.24/0.29 | 0.03/0.02/0.02 |
| V | 5.49/5.50/5.44 | 20.53/22.27/22.78 | 11.27/11.26/11.42 | 0.05/0.05/0.06 | 0.00/0.07/0.08 | 0.01/0.01/0.01 |
Table 10 Main land use changes and contribution rates leading to HQ degradation in Zhaotong City |
| Driving factors | Type of land use transfer | Total transfer area (km2) | Contribution (%) |
|---|---|---|---|
| Construction occupancy | Farmland→Construction land | 298.7478 | -0.0883 |
| Forest land→Construction land | |||
| Grassland → Construction land | |||
| Water area → Construction land | |||
| Unutilized land → Construction land | |||
| Reclamation (conversion of regional ecological land to farmland) | Forest land → Farmland | 438.1236 | -0.1294 |
| Grassland → Farmland | |||
| Water area → Farmland | |||
| Land degradation | Farmland → Unutilized land | 1.6803 | -0.0005 |
| Forest land → Unutilized land | |||
| Grassland → Unutilized land | |||
| Water area → Unutilized land |
| [1] |
|
| [2] |
|
| [3] |
|
| [4] |
|
| [5] |
|
| [6] |
|
| [7] |
|
| [8] |
|
| [9] |
|
| [10] |
|
| [11] |
|
| [12] |
|
| [13] |
|
| [14] |
|
| [15] |
|
| [16] |
|
| [17] |
|
| [18] |
|
| [19] |
|
| [20] |
|
| [21] |
|
| [22] |
|
| [23] |
|
| [24] |
|
| [25] |
|
| [26] |
|
| [27] |
|
| [28] |
|
| [29] |
|
| [30] |
|
| [31] |
|
| [32] |
|
| [33] |
|
| [34] |
|
| [35] |
|
| [36] |
|
| [37] |
|
| [38] |
|
| [39] |
|
| [40] |
|
| [41] |
|
| [42] |
|
| [43] |
|
| [44] |
|
| [45] |
|
| [46] |
|
| [47] |
|
| [48] |
|
| [49] |
|
| [50] |
|
| [51] |
|
| [52] |
|
| [53] |
|
| [54] |
|
| [55] |
|
| [56] |
|
| [57] |
|
| [58] |
|
| [59] |
|
| [60] |
|
| [61] |
|
| [62] |
|
| [63] |
|
| [64] |
|
| [65] |
|
| [66] |
|
| [67] |
|
| [68] |
|
| [69] |
|
/
| 〈 |
|
〉 |