
Journal of Resources and Ecology >
The Valuation of Forest Ecosystem Service Function and Influencing Factors in Yunnan Province
|
ZOU Zaijin, E-mail: 122078129@qq.com |
Received date: 2024-03-22
Accepted date: 2024-07-10
Online published: 2025-03-28
Supported by
The Humanities and Social Sciences Research Project for Educational Co-operation among Provincial Institutes and Universities in Yunnan Province(SYSX202107)
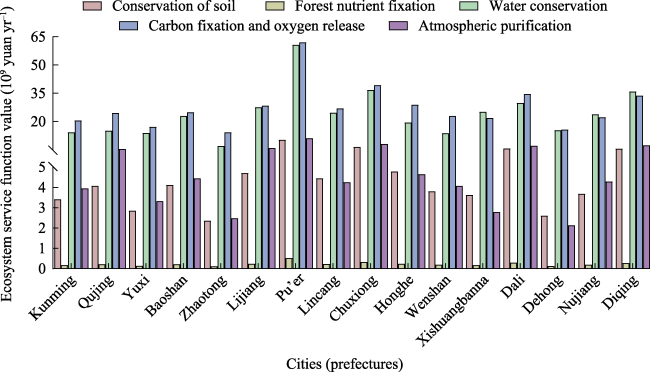
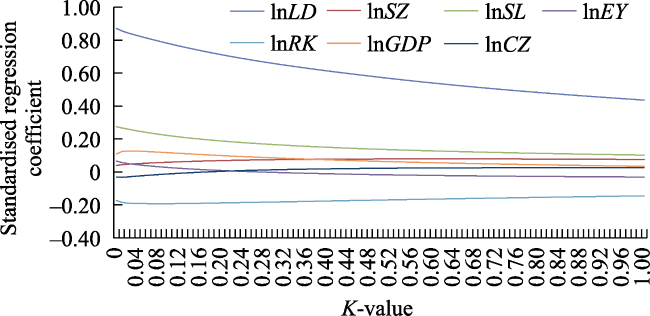
As a large province with forest resources, assessing the value of forest ecosystem services in Yunnan is of great significance to maintain the sustainable development of Yunnan’s economy. Based on the latest survey data of Yunnan Province, i.e., the forest resources type II survey data, and in accordance with the Specification for Forest Ecosystem Service Function Assessment (GB/T 38582-2020), the value of forest ecosystem service function of 16 cities (prefectures) in Yunnan was assessed, and the ridge regression method was used to study the main factors affecting the value differences among cities (prefectures). The results show that: (1) The value of forest ecosystem services in Yunnan is 982.926×10⁹ yuan yr-1, of which the value of carbon fixation and oxygen release is the largest. (2) The top four cities (prefectures) in terms of value of services are Pu’er City > Chuxiong Prefecture > Diqing Prefecture > Dali Prefecture; the bottom four cities (prefectures) are Kunming City > Yuxi City > Dehong Prefecture > Zhaotong City; (3) The main factors affecting the value of the service function of each city (prefecture) are forested land area, forest cover, GDP and population density. The findings of this study provided a reference for the sustainable development of the ecological environment in the prefectures and cities of Yunnan Province.
Key words: forest ecosystems; valuation; influencing factors; Yunnan Province
ZOU Zaijin , ZOU Yunzi . The Valuation of Forest Ecosystem Service Function and Influencing Factors in Yunnan Province[J]. Journal of Resources and Ecology, 2025 , 16(2) : 297 -305 . DOI: 10.5814/j.issn.1674-764x.2025.02.002
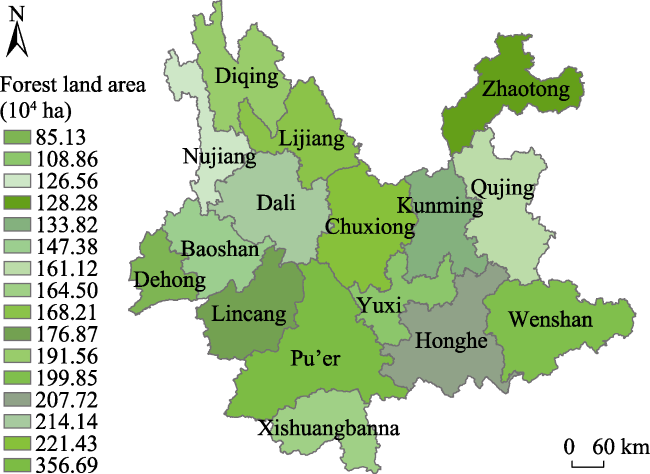
Figure 1 Spatial distribution of forest land area in cities (prefectures) of Yunnan Province, 2021 |
Table 1 Data on public social resources |
| Name | Unit | Numerical | Source |
|---|---|---|---|
| Water resources market transaction price | yuan m-3 | 6.11 | Tu et al., 2023 |
| Cost of water purification | yuan t-1 | 2.09 | |
| Diammonium phosphate fertilizer prices | yuan t-1 | 2400 | |
| Potassium chloride fertilizer prices | yuan t-1 | 2200 | |
| Price of carbon fixation | yuan t-1 | 1200 | |
| Negative ion production costs | 10-18 yuan units-1 | 5.8185 | |
| Cost for excavation and transportation of soil per unit volume | yuan m-3 | 63 | Refer to China Forest Resources Accounting Research Project Group (2015) |
| Nitrogen content of diammonium phosphate | % | 14 | |
| Phosphorus content of diammonium phosphate | % | 15.01 | |
| Potassium content of potassium chloride | % | 50 | |
| Organic matter prices | yuan t-1 | 800 | |
| Manufacturing oxygen prices | yuan t-1 | 1126 | Referring to China Forest Resources Accounting Research Project Group (2015), according to the price index (pharmaceutical manufacturing industry), the price of 1108 yuan t-1 in 2013 is converted to the current price of 1126 yuan t-1 in 2016 |
| Sulfur dioxide treatment costs | yuan kg-1 | 1.42 | Referring to China Forest Resources Accounting Research Project Group (2015), based on the China Forest Ecosystem Services Accounting Social Public Data Sheet (2013 Recommended Use Prices), with 2013 prices converted to 2016 current prices through the Industrial Producer Ex-factory Price Index |
| Fluoride treatment costs | yuan kg-1 | 0.82 | |
| Nitrogen oxide treatment costs | yuan kg-1 | 0.74 | |
| Dust abatement and clean-up costs | yuan kg-1 | 0.18 |
Table 2 Quality of forest ecosystem services in Yunnan Province |
| Cities (prefectures) | Soil conservation (104 t yr-1) | Forest nutrient fixation (104 t yr-1) | Water conservation (105 m3 yr-1) | Carbon fixation and oxygen release (104 t yr-1) | Atmospheric purification | |||||||
|---|---|---|---|---|---|---|---|---|---|---|---|---|
| Soil consolidation | Fertilizer retention | Nitrogen immobilization | Phosphorus fixation | Potassium fixation | Regulating flow | Water purification | Fixed carbon | Releasing oxygen | Provide negative ions (1025 units yr-1) | Absorbing gas pollutants (104 t yr-1) | Dust catching (104 t yr-1) | |
| Kunming | 4165.11 | 109.13 | 1.84 | 0.29 | 0.77 | 17408.52 | 17408.52 | 637.16 | 1150.82 | 1.05 | 14.18 | 2064.64 |
| Qujing | 4973.77 | 130.31 | 2.19 | 0.35 | 0.92 | 18473.39 | 18473.39 | 760.87 | 1374.26 | 1.25 | 16.93 | 2877.42 |
| Yuxi | 3482.32 | 91.24 | 1.54 | 0.24 | 0.65 | 16924.83 | 16924.83 | 532.71 | 962.17 | 0.88 | 11.85 | 1732.09 |
| Baoshan | 5023.94 | 131.63 | 2.22 | 0.35 | 0.93 | 27996.07 | 27996.07 | 768.55 | 1388.12 | 1.27 | 17.10 | 2316.60 |
| Zhaotong | 2881.64 | 75.50 | 1.27 | 0.20 | 0.54 | 8640.36 | 8640.36 | 440.82 | 796.20 | 0.73 | 9.81 | 1285.43 |
| Lijiang | 5742.76 | 150.46 | 2.53 | 0.40 | 1.07 | 33709.81 | 33709.81 | 878.51 | 1586.73 | 1.45 | 19.55 | 3156.85 |
| Pu’er | 12553.24 | 328.90 | 5.54 | 0.87 | 2.33 | 74063.78 | 74063.78 | 1920.35 | 3468.48 | 3.16 | 42.73 | 5812.74 |
| Lincang | 5436.26 | 142.43 | 2.40 | 0.38 | 1.01 | 30144.58 | 30144.58 | 831.62 | 1502.04 | 1.37 | 18.51 | 2192.48 |
| Chuxiong | 7945.26 | 208.17 | 3.51 | 0.55 | 1.48 | 44854.11 | 44854.11 | 1215.44 | 2195.29 | 2.00 | 27.05 | 4233.63 |
| Honghe | 5844.01 | 153.11 | 2.58 | 0.41 | 1.09 | 23679.29 | 23679.29 | 894.00 | 1614.71 | 1.47 | 19.89 | 2395.62 |
| Wenshan | 4644.47 | 121.69 | 2.05 | 0.32 | 0.86 | 16816.36 | 16816.36 | 710.49 | 1283.27 | 1.17 | 15.81 | 2118.78 |
| Xishuangbanna | 4437.4 | 116.26 | 1.96 | 0.31 | 0.82 | 30729.69 | 30729.69 | 678.82 | 1226.06 | 1.12 | 15.11 | 1411.49 |
| Dali | 6999.31 | 183.38 | 3.09 | 0.49 | 1.30 | 36484.01 | 36484.01 | 1070.73 | 1933.92 | 1.76 | 23.83 | 3729.36 |
| Dehong | 3184.03 | 83.42 | 1.41 | 0.22 | 0.59 | 18772.07 | 18772.07 | 487.08 | 879.75 | 0.80 | 10.84 | 1083.60 |
| Nujiang | 4493.04 | 117.72 | 1.98 | 0.31 | 0.84 | 29004.49 | 29004.49 | 687.33 | 1241.43 | 1.13 | 15.29 | 2242.97 |
| Diqing | 6817.33 | 178.61 | 3.01 | 0.48 | 1.27 | 43845.12 | 43845.12 | 1042.89 | 1883.64 | 1.72 | 23.21 | 3906.47 |
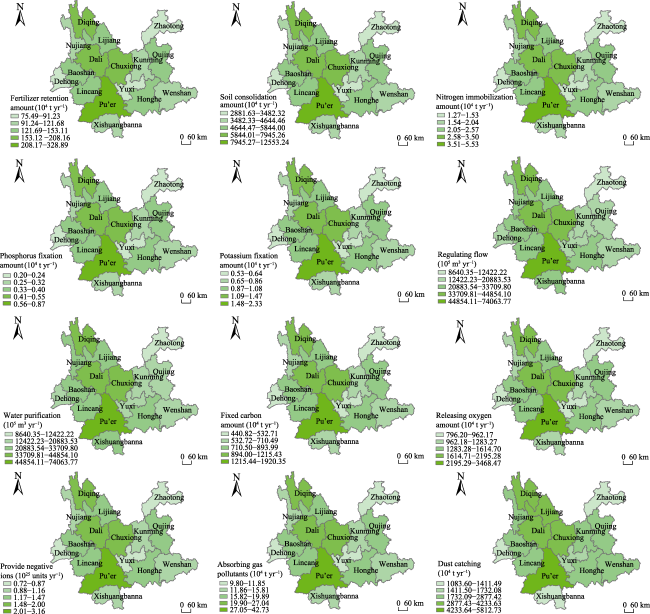
Figure 2 Spatial variation of forest ecosystem service function and quality in cities (prefectures) of Yunnan Province, 2021 |
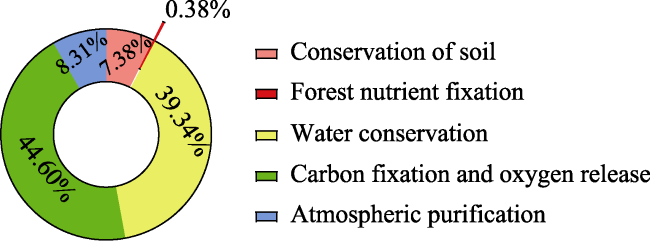
Figure 3 Value volume share of each function |
Table 3 Valuation of forest ecosystem service functions in Yunnan Province |
| Cities (prefectures) | Soil conservation (109 yuan yr-1) | Forest nutrient fixation (109 yuan yr-1) | Water conservation (109 yuan yr-1) | Carbon fixation and oxygen release (109 yuan yr-1) | Atmospheric purification (109 yuan yr-1) | ||||||
|---|---|---|---|---|---|---|---|---|---|---|---|
| Soil consolidation | Fertilizer retention | Nitrogen immobilization | Phosphorus fixation | Potassium fixation | Fixed carbon | Releasing oxygen | Provide negative ions | Absorbing gas pollutants | Dust catching | ||
| Kunming | 1.749 | 1.659 | 0.070 | 0.030 | 0.073 | 14.275 | 7.646 | 12.958 | 0.037 | 0.200 | 3.716 |
| Qujing | 2.089 | 1.981 | 0.084 | 0.036 | 0.088 | 15.148 | 9.130 | 15.474 | 0.044 | 0.238 | 5.179 |
| Yuxi | 1.463 | 1.387 | 0.059 | 0.025 | 0.061 | 13.878 | 6.393 | 10.834 | 0.031 | 0.167 | 3.118 |
| Baoshan | 2.110 | 2.001 | 0.084 | 0.036 | 0.088 | 22.957 | 9.223 | 15.630 | 0.044 | 0.241 | 4.170 |
| Zhaotong | 1.210 | 1.148 | 0.048 | 0.021 | 0.051 | 7.085 | 5.290 | 8.965 | 0.025 | 0.138 | 2.314 |
| Lijiang | 2.412 | 2.288 | 0.096 | 0.041 | 0.101 | 27.642 | 10.542 | 17.867 | 0.050 | 0.275 | 5.682 |
| Pu’er | 5.272 | 5.001 | 0.211 | 0.090 | 0.221 | 60.732 | 23.044 | 39.055 | 0.110 | 0.601 | 10.463 |
| Lincang | 2.283 | 2.166 | 0.091 | 0.039 | 0.096 | 24.719 | 9.979 | 16.913 | 0.048 | 0.260 | 3.946 |
| Chuxiong | 3.337 | 3.165 | 0.133 | 0.057 | 0.140 | 36.780 | 14.585 | 24.719 | 0.070 | 0.381 | 7.621 |
| Honghe | 2.454 | 2.328 | 0.098 | 0.042 | 0.103 | 19.417 | 10.728 | 18.182 | 0.051 | 0.280 | 4.312 |
| Wenshan | 1.951 | 1.850 | 0.078 | 0.033 | 0.082 | 13.789 | 8.526 | 14.450 | 0.041 | 0.223 | 3.814 |
| Xishuangbanna | 1.864 | 1.768 | 0.075 | 0.032 | 0.078 | 25.198 | 8.146 | 13.805 | 0.039 | 0.213 | 2.541 |
| Dali | 2.940 | 2.788 | 0.118 | 0.050 | 0.123 | 29.917 | 12.849 | 21.776 | 0.062 | 0.335 | 6.713 |
| Dehong | 1.337 | 1.268 | 0.053 | 0.023 | 0.056 | 15.393 | 5.845 | 9.906 | 0.028 | 0.153 | 1.950 |
| Nujiang | 1.887 | 1.790 | 0.075 | 0.032 | 0.079 | 23.784 | 8.248 | 13.979 | 0.039 | 0.215 | 4.037 |
| Diqing | 2.863 | 2.716 | 0.115 | 0.049 | 0.120 | 35.953 | 12.515 | 21.210 | 0.060 | 0.327 | 7.032 |
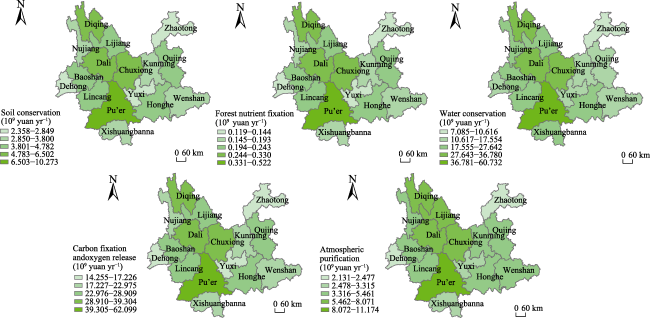
Figure 4 Spatial changes of the value of forest ecosystem services in various regions of Yunnan Province |
Figure 5 Value of forest ecosystem service functions in various regions of Yunnan Province |
Table 4 Indicators |
| Variable | Symbolic representation | Logarithmic symbol |
|---|---|---|
| Forest land area | LD | lnLD |
| Population density | RK | lnRK |
| Forest coverage | SL | lnSL |
| Sulfur dioxide emissions | EY | lnEY |
| GDP | GDP | lnGDP |
| Service function value | JZ | lnJZ |
Table 5 Regression results |
| Variable | Non-standardized coefficient | Standardized coefficient | t-value | P-value | Covariance diagnosis | ||
|---|---|---|---|---|---|---|---|
| Beta | Standard error | Beta | VIF | Tolerance | |||
| Constant | 1.494 | 0.727 | - | 2.054 | 0.067 | - | - |
| lnLD | 0.9 | 0.106 | 0.755 | 8.454 | <0.001 | 2.346 | 0.426 |
| lnRK | -0.09 | 0.092 | -0.167 | -0.978 | 0.351 | 8.545 | 0.117 |
| lnSL | 1.663 | 0.265 | 0.723 | 6.284 | <0.001 | 3.891 | 0.257 |
| lnEY | -0.02 | 0.057 | -0.056 | -0.349 | 0.734 | 7.607 | 0.131 |
| lnGDP | 0.205 | 0.081 | 0.447 | 2.532 | 0.030 | 9.162 | 0.109 |
Figure 6 Ridge trace map |
Table 6 Results of ridge regression (Dependent variable: lnJZ) |
| Variable | Non-standardized coefficient | Standardized coefficient | t-value | P-value | R² | Adjustment of R² | F-test | |
|---|---|---|---|---|---|---|---|---|
| Beta | Standard error | Beta | ||||||
| Constant | 2.754 | 0.576 | - | 4.776 | 0.001 | 0.929 | 0.894 | 26.25 |
| lnLD | 0.753 | 0.089 | 0.632 | 8.51 | <0.001 | |||
| lnRK | -0.112 | 0.047 | -0.208 | -2.398 | 0.037 | |||
| lnSL | 1.118 | 0.208 | 0.486 | 5.372 | <0.001 | |||
| lnEY | -0.008 | 0.032 | -0.023 | -0.255 | 0.804 | |||
| lnGDP | 0.113 | 0.039 | 0.247 | 2.872 | 0.017 | |||
| [1] |
|
| [2] |
China Forest Resources Accounting Research Project Group. 2015. Research on China’s forest resources accounting in the construction of ecological civilization system. Beijing, China: China Forestry Publishing House. (in Chinese)
|
| [3] |
|
| [4] |
|
| [5] |
|
| [6] |
National Forestry and Grassland Administration. 2020. Specification for forest ecosystem service function assessment (GB/T38582-2020). Beijing, China: China Standard Press. (in Chinese)
|
| [7] |
|
| [8] |
|
| [9] |
|
| [10] |
|
| [11] |
|
| [12] |
|
| [13] |
|
| [14] |
|
| [15] |
|
/
| 〈 |
|
〉 |