
Journal of Resources and Ecology >
Shifting Diets for Low-carbon Patterns Based on Multi-objective Optimization in China’s Megacities: A Case Study of Beijing and Shanghai
|
ZHANG Yan, E-mail: zyan18339606367@163.com |
Received date: 2024-06-10
Accepted date: 2024-09-09
Online published: 2025-01-21
Supported by
National Natural Science Foundation of China(42171230)
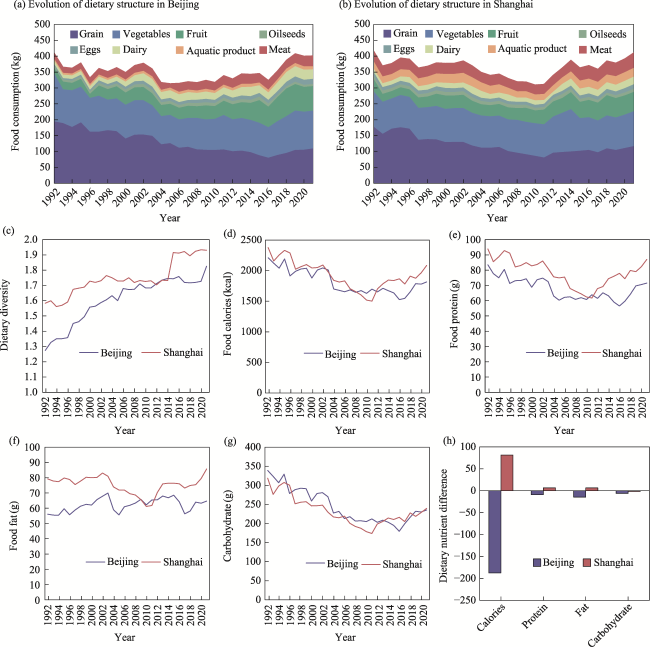
Dietary modification has been suggested as a viable path to mitigate climate change. This study explored the evolution of dietary structures in China’s megacities and quantified food-related carbon emissions using the carbon footprint method. Then, we developed a multi-objective optimization model to identify low-carbon dietary options that align with cultural preferences, economic feasibility, and nutritional requirements. We found that from 1992 to 2021, the total food consumption of residents in Beijing and Shanghai experienced a period of fluctuating decline and slow rise, respectively, with their dietary structures both shifting toward animal-based diets. Additionally, the significant increase in meat consumption led to increasing food carbon emissions in Beijing and Shanghai, with per capita emissions rising by 37.2% and 25.2%, respectively. According to the multi-objective optimization model, shifting towards reduced consumption of animal products, particularly meat, would align with culturally acceptable, economically feasible, and low carbon emission goals in Beijing and Shanghai, potentially leading to reductions of 92.14 t and 212.65 t in total food carbon emissions compared with the actual in 2021, respectively. This study enhances understanding of the changing dietary patterns in urban areas and their associated carbon emissions, and emphasizes the significance of optimizing diets as a key priority for advancing global sustainable development.
Key words: carbon footprint; diet optimization; evolutionary characteristics; China
ZHANG Yan , ZHU Yuanyuan , ZHU Xiaohua , LI Yan . Shifting Diets for Low-carbon Patterns Based on Multi-objective Optimization in China’s Megacities: A Case Study of Beijing and Shanghai[J]. Journal of Resources and Ecology, 2025 , 16(1) : 93 -104 . DOI: 10.5814/j.issn.1674-764x.2025.01.009
Table 1 Nutrients per unit mass of food |
| Food type | Energy (kcal kg-1) | Protein (g kg-1) | Fat (g kg-1) | Carbohydrates (g kg-1) |
|---|---|---|---|---|
| Grain | 2999.5 | 104.3 | 39.8 | 545.8 |
| Vegetables | 487.6 | 32.0 | 4.0 | 83.0 |
| Fruit | 685.9 | 5.0 | 6.0 | 152.0 |
| Oilseeds | 8828.9 | 0.0 | 998.0 | 2.0 |
| Eggs | 2000.5 | 147.0 | 146.0 | 29.0 |
| Dairy | 628.6 | 29.0 | 31.0 | 59.0 |
| Meat | 2782.0 | 157.0 | 218.0 | 52.0 |
| Aquatic products | 1720.8 | 194.0 | 91.0 | 30.0 |
Table 2 The balanced dietary pattern recommended by Chinese dietary guidelines 2022 |
| Food type | Lower value (g day-1) | Upper value (g day-1) | Average (g day-1) |
|---|---|---|---|
| Grain | 200.0 | 300.0 | 250.0 |
| Vegetables | 300.0 | 500.0 | 400.0 |
| Fruit | 200.0 | 350.0 | 275.0 |
| Oilseeds | 25.0 | 30.0 | 27.5 |
| Eggs | 40.0 | 75.0 | 57.5 |
| Dairy | 300.0 | 500.0 | 400.0 |
| Meat | 40.0 | 75.0 | 57.5 |
| Aquatic products | 40.0 | 75.0 | 57.5 |
Table 3 Carbon emission coefficients of various types of food |
| Food type | Carbon emission coefficient (kg CO2 eq kg-1) |
|---|---|
| Grain | 0.28 |
| Vegetables | 0.22 |
| Fruit | 0.07 |
| Oilseeds | 1.38 |
| Eggs | 0.86 |
| Dairy | 0.32 |
| Meat | 6.39 |
| Aquatic products | 1.74 |
Table 4 Dietary nutrient intake recommendations by the dietary reference intakes for China 2023 |
| Nutrient type | Lower value (kcal %E) | Upper value (kcal %E) | Average (kcal %E) |
|---|---|---|---|
| Calories | 1700 kcal | 2150 kcal | 1925 kcal |
| Protein | 10%E | 20%E | 15%E |
| Fat | 20%E | 30%E | 25%E |
| Carbohydrate | 50%E | 65%E | 55%E |
Note: E stands for energy value where 1 g of protein=4 kcal; 1 g of fat=9 kcal; and 1 g of carbohydrate=4 kcal. |
Figure 1 Evolution of the dietary structures of residents in China’s two first-tier citiesNote: c-g. Changes in food nutrients for residents of the two first-tier cities in China; h. Comparison of dietary structures and balanced dietary patterns of the residents in China’s two first-tier cities. |
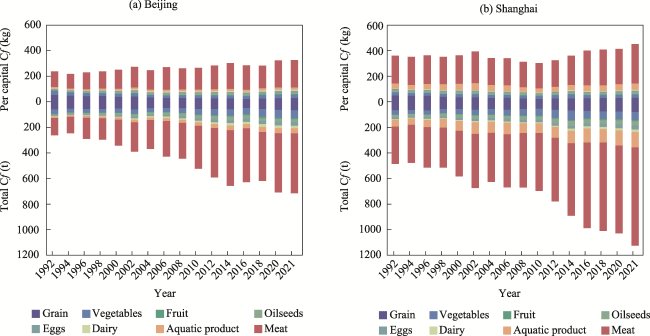
Figure 2 Food carbon emissions of residents in China's two first-tier cities (per capita and total)Note: Cf refers to food carbon emissions. |
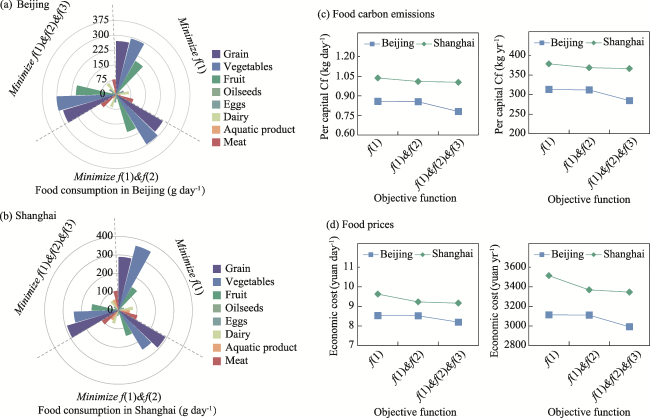
Figure 3 Dietary structure adjustment plans for the two first-tier cities in China. (a) Dietary structure adjustment plans in Beijing; (b) Dietary structure adjustment plans in Shanghai; (c) Food carbon emissions under the proposed dietary adjustment programs; d. Economic costs under the proposed dietary adjustment programs |
Table 5 Dietary structure adjustment plans for residents in the first-tier cities in China and global representative diets |
| Food type | Actual in 2021 | Adjusted | The balanced diets | The Lancet diet | Mediterranean diet | Flexitarian diet | ||
|---|---|---|---|---|---|---|---|---|
| Beijing | Shanghai | Beijing | Shanghai | |||||
| Grain (g) | 301.1 | 320.8 | 280.3 | 290.3 | 250.0 | 282.0 | 240.0 | 325.0 |
| Vegetables (g) | 326.0 | 301.9 | 302.5 | 241.8 | 400.0 | 300.0 | 600.0 | 500.0 |
| Fruit (g) | 211.5 | 166.0 | 203.3 | 145. 5 | 275.0 | 200.0 | 376.0 | 350.0 |
| Oilseeds (g) | 18.6 | 27.4 | 22.0 | 22.0 | 27.5 | 47.0 | 47.0 | 28.0 |
| Eggs (g) | 44.4 | 38.4 | 40.6 | 30.9 | 57.5 | 13.0 | 21.0 | 45.0 |
| Dairy (g) | 81.6 | 65.8 | 68.7 | 61.4 | 400.0 | 250.0 | 250.0 | 300.0 |
| Aquatic product (g) | 27.4 | 76.4 | 22.7 | 61.2 | 57.5 | 28.0 | 70.0 | 58.0 |
| Meat (g) | 91.8 | 132.3 | 77.2 | 105.9 | 57.5 | 43.0 | 34.0 | 16.0 |
| Calories (kcal) | 1814.2 | 2083.0 | 1700.4 | 1782.9 | 2001.7 | 1895.2 | 2099.5 | 2128.8 |
| Protein (g) | 71.5 | 87.1 | 64.4 | 73.6 | 80.5 | 61.4 | 75.4 | 80.7 |
| Fat (g) | 64.7 | 85.8 | 62.5 | 70.4 | 79.2 | 82.1 | 85.7 | 69.6 |
| Carbohydrate (g) | 235.3 | 239.6 | 218.9 | 212.5 | 241.5 | 227.5 | 257.3 | 293.7 |
| Cf (kg yr-1) | 326.7 | 452.1 | 284.6 | 366.6 | 313.9 | 232.9 | 266.0 | 219.9 |
Note: Globally representative dietary data refer to the study of Zhu et al. (2023c). |
| [1] |
|
| [2] |
|
| [3] |
|
| [4] |
|
| [5] |
|
| [6] |
|
| [7] |
|
| [8] |
|
| [9] |
CNS (Chinese Nutrition Society). 2022. Chinese dietary guidelines 2022. Beijing, China: People’s Medical Publishing House. (in Chinese)
|
| [10] |
CNS (Chinese Nutrition Society). 2023. Dietary reference intakes for China 2023. Beijing, China: People’s Medical Publishing House. (in Chinese)
|
| [11] |
|
| [12] |
|
| [13] |
|
| [14] |
|
| [15] |
FAO. 2016. Plates, pyramids, planet—Developments in national healthy and sustainable dietary guidelines: A state of play assessment. Rome, Italy: FAO.
|
| [16] |
|
| [17] |
|
| [18] |
|
| [19] |
GBD 2017 Diet Collaborators. 2019. Health effects of dietary risks in 195 countries, 1990-2017: A systematic analysis for the global burden of disease study 2017. Lancet, 393(10184): 1958-1972.
|
| [20] |
|
| [21] |
|
| [22] |
IPCC. 2022. Climate change 2022: Mitigation of climate change. https://www.ipcc.ch/report/ar6/wg3/. Viewed on 2024-06-05.
|
| [23] |
|
| [24] |
|
| [25] |
|
| [26] |
|
| [27] |
|
| [28] |
|
| [29] |
|
| [30] |
|
| [31] |
NDRC (Department of Price, National Development and Reform Commission). 2021. Data compilation of cost and income of national agricultural products. Beijing, China: China Statistics Press. (in Chinese)
|
| [32] |
|
| [33] |
|
| [34] |
|
| [35] |
|
| [36] |
|
| [37] |
|
| [38] |
|
| [39] |
|
| [40] |
|
| [41] |
|
| [42] |
|
| [43] |
|
| [44] |
|
| [45] |
|
| [46] |
|
| [47] |
|
| [48] |
|
| [49] |
|
| [50] |
|
| [51] |
|
| [52] |
|
| [53] |
|
| [54] |
|
| [55] |
|
| [56] |
|
| [57] |
|
| [58] |
|
| [59] |
|
| [60] |
|
| [61] |
|
/
| 〈 |
|
〉 |