
Journal of Resources and Ecology >
Can Anti-poverty Policies Improve Livelihood Sustainability? An Empirical Study from the Perspective of Farmers’ Perceptions
Received date: 2024-03-24
Accepted date: 2024-09-20
Online published: 2025-01-21
Supported by
National Natural Science Foundation of China(42001249)
In recent years, an ambitious development policy named the targeted poverty alleviation policy has been implemented in China, and it has achieved remarkable success. But whether the smallholder farmers raised out of extreme poverty due to this policy have achieved sustainable livelihoods remains uncertain. This study developed a livelihood sustainability index that can comprehensively assess farmers’ livelihoods, constructed an analytical model of the direct and indirect impacts of policy measures on livelihood sustainability using the farmer’s perceptions of those policies as a mediator, and created a policy perception elasticity factor to screen the contributions of policy measures to the improvement of livelihood sustainability. Based on these theoretical advances, a case study of an indigenous community on the Tibetan Plateau was conducted. The results show that this policy has contributed to improving farmers’ livelihood sustainability in the case areas, especially in terms of livelihood assets and livelihood outcomes, through direct encouragement and indirect influences based on the vulnerability context. In China’s era of “post-targeted poverty alleviation”, the findings from this case study indicate that relevant future policies should attach importance to institutional reform and staff management, and establish practical actions to cope with the uncertainty of the vulnerability context.
YANG Lun . Can Anti-poverty Policies Improve Livelihood Sustainability? An Empirical Study from the Perspective of Farmers’ Perceptions[J]. Journal of Resources and Ecology, 2025 , 16(1) : 62 -72 . DOI: 10.5814/j.issn.1674-764x.2025.01.006
Table 1 The evaluation indexes of livelihood sustainability |
| First-level index | Second-level index | Second-level index definition |
|---|---|---|
| Livelihood strategies sustainability index (LS) | Agriculture-oriented strategy (LSa) | Number of households that engage in agriculture-oriented activities (farming) for more than two-thirds of their working hours |
| Part-time strategy (LSp) | Number of households that engage in agriculture-oriented activities or non-agriculture-oriented activities for no more than two-thirds of their working hours | |
| Non-agriculture-oriented strategy (LSn) | Number of households that engage in non-agriculture-oriented activities (such as going out for non- farming jobs, taking part in rural tourism reception) for more than two-thirds of their working hours | |
| Livelihood assets sustainability index (LA) | Human capital (LAh) | Quantity of available labor force per household |
| Social capital (LAs) | Number of available relatives in the village per household | |
| Natural capital (LAn) | Area of available land resources per household (ha) | |
| Physical capital (LAp) | Quantity of available instruments of production per household | |
| Financial capital (LAf) | Quantity of financial or alternative savings per household (yuan) | |
| Livelihood outcomes sustainability index (LO) | Family health condition (LOh) | Prevalence of severe/moderate/mild diseases of family members per household (%) |
| Family education condition (LOe) | Average years of education of family members per household (year) | |
| Family financial condition (LOf) | Average annual income per household (yuan) |
Note: Due to the significant differences in the dimensions between the indexes, this study adopted the maximum difference normalization method to standardize the data for each index. |
Table 2 The five measures of the targeted poverty alleviation policy |
| Policy measure | Actions of the policy measure |
|---|---|
| Institutional reform measure | 1) The government encourages farmers to participate in land transfer. 2) The government guides poor households to invest their resource assets in agricultural projects. 3) The government equitably distributes the compensation funds to poor households in agricultural projects. 4) The government integrates agricultural-related funds. 5) The government publicly regularly announces the progress of various policy measures. 6) The provincial government dynamically adjusts the amount of poverty alleviation funds based on the poverty alleviation situation of each county. 7) The government uses interest discounts, guarantees, risk compensation, and premium subsidies to invest in the agricultural industry. 8) The government recruits enterprises capable of absorbing poor laborers. 9) The government reforms the policy of the poor people to settle in cities and towns |
| Staff management measure | 1) The government assigns personnel to the village to carry out the targeted poverty alleviation policy. 2) The staff formulates an operational poverty alleviation work plan. 3) The government regularly evaluates the work results of the staff. 4) The staff in the village regularly meets with the upper-level management personnel. 5) The government establishes long-term workstations in impoverished villages. 6) The government dynamically adjusts the number of staff according to the situation of impoverished villages |
| Government fund management measure | 1) The government sets a particular targeted poverty alleviation policy funding budget. 2) The government separately sets up poverty alleviation funding subjects. 3) The government regularly audits the use of poverty alleviation funds. 4) The government supervises the use of poverty alleviation funds and establishes a lifelong accountability system for poverty alleviation projects |
| Financial fund management measure | 1) Financial institutions increase financial service outlets in poor villages. 2) Financial institutions reduce loan interest rates for poor households. 3) Financial institutions establish special loan projects for the targeted poverty alleviation policy. 4) Financial institutions establish loan risk compensation measures for poor households. 5) Financial institutions simplify the loan process for poor households. 6) Financial institutions prioritize promoting micro-loan insurance to poor households. 7) Financial institutions increase the amount of agricultural insurance premium subsidies for poor households. 8) Financial institutions prioritize promoting personal accident insurance to poor households. 9) Financial institutions lead in establishing and evenly distributing village-level mutual aid funds |
| Social fund management measure | 1) The government encourages social organizations and individuals to participate in poverty alleviation work. 2) Social organizations carry out volunteer actions for poverty alleviation. 3) The government encourages government personnel to participate in the poverty alleviation activities of various NGOs. 4) Local governments actively seek “one-to-one” poverty alleviation support from central agencies. 5) Local governments seek “one-to-one” poverty alleviation support from the governments in developed regions. 6) Medical institutions carry out medical assistance in poor villages. 7) The government encourages enterprises to participate in poverty alleviation through preferential tax policies. 8) The government commends social organizations and individuals for their poverty alleviation work |
Table 3 The system of vulnerability context |
| First-level index | Second-level index | Second-level index definition |
|---|---|---|
| Natural background | Climate change | The initial value is 0. Then, if the regional annual temperature increases, add 1; if there is no increase, it remains 0 |
| Soil erosion | The initial value is 0. Then, if the regional annual incidence of soil erosion increases, add 1; if there is no increase, it remains 0 | |
| Drought | The initial value is 0. Then, if the regional annual incidence of drought increases, add 1; if there is no increase, it remains 0 | |
| Economic background | Gross domestic product | The initial value is 0. Then, if the gross domestic product increases, add 1; if there is no increase, it remains 0 |
| Gross output value of agriculture | The initial value is 0. Then, if the gross output value of agriculture increases, add 1; if there is no increase, it remains 0 | |
| Fixed asset investment | The initial value is 0. Then, if the regional fixed asset investment increases, add 1; if there is no increase, it remains 0 | |
| Community background | Community population size | The initial value is 0. Then, if the community population size increases, add 1; if there is no increase, it remains 0 |
| Community infrastructure | The initial value is 0. Then, if the community infrastructure increases, add 1; if there is no increase, it remains 0 | |
| Communal activity | The initial value is 0. Then, if the communal activity increases, add 1; if there is no increase, it remains 0 |
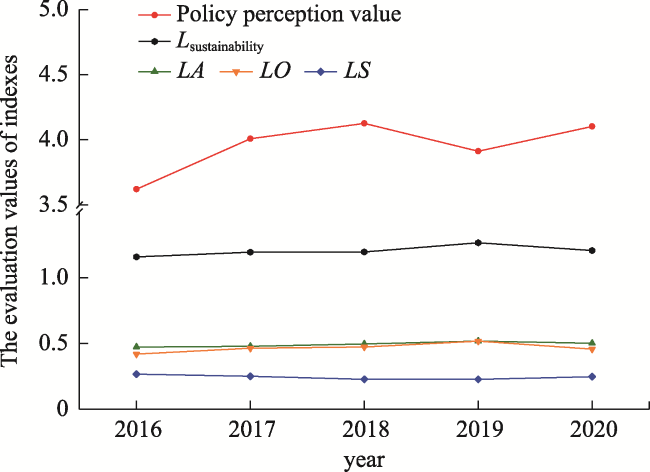
Figure 1 Changes in livelihood sustainability indexes and the policy perception value from 2016 to 2020 |
Figure 2 The scatter plot diagrams of the livelihood sustainability index, livelihood strategies sustainability index, livelihood assets sustainability index, and livelihood outcomes sustainability index versus the policy perception evaluation value |
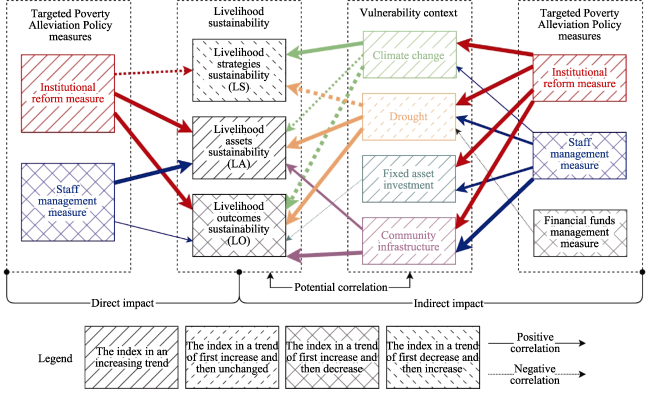
Figure 3 Schematic diagram of the impacts of the targeted poverty alleviation policy on farmers’ livelihood sustainability |
Table 4 Policy perception elasticity of the sampled farmers from 2016 to 2020 |
| Policy measure | Livelihood sustainability | Period | Average | |||
|---|---|---|---|---|---|---|
| 2016-2017 | 2017-2018 | 2018-2019 | 2019-2020 | |||
| Farmers’ perception of the targeted poverty alleviation Policy | Livelihood sustainability index | 0.28 | 0.08 | 1.12* | 0.96 | 0.43 |
| Farmers’ perception of the institutional reform measures | Livelihood strategies sustainability index | 1.33* | 1.03* | 2.13* | 1.45* | 0.31 |
| Livelihood assets sustainability index | 0.28 | 0.40 | 14.56* | 0.60 | 3.66* | |
| Livelihood outcomes sustainability index | 2.36* | 0.20 | 30.80* | 2.09* | 7.82* | |
| Farmers’ perception of the staff management measure | Livelihood strategies sustainability index | 0.38 | 4.24* | 2.13* | 1.04* | 1.95* |
| Livelihood assets sustainability index | 0.08 | 1.66* | 14.56* | 0.43 | 3.10* | |
| Livelihood outcomes sustainability index | 0.67 | 0.84 | 30.80* | 1.49* | 6.95* | |
| Farmers’ perception of the financial funds management measure | Livelihood strategies sustainability index | 0.53 | 0 | 0.09 | 0.95 | 0.08 |
| Livelihood assets sustainability index | 0.11 | 0 | 0.60 | 0.39 | 0.22 | |
| Livelihood outcomes sustainability index | 0.94 | 0 | 1.26* | 1.36* | 0.42 | |
Note: Elastic values greater than 1 are marked with an asterisk (*). |
| [1] |
|
| [2] |
|
| [3] |
|
| [4] |
|
| [5] |
|
| [6] |
|
| [7] |
DFID. 1999. Sustainable livelihoods guidance sheets. London, UK: Department for International Development.
|
| [8] |
|
| [9] |
|
| [10] |
|
| [11] |
|
| [12] |
|
| [13] |
|
| [14] |
|
| [15] |
|
| [16] |
|
| [17] |
|
| [18] |
|
| [19] |
|
| [20] |
|
| [21] |
|
| [22] |
|
| [23] |
|
| [24] |
|
| [25] |
|
| [26] |
|
| [27] |
|
| [28] |
|
| [29] |
UNESCO. 2022. Sites for sustainable development: Realizing the potential of UNESCO designated sites to advance agenda 2030. http://www.unesco.org.uk. Viewed on 2024-02-20.
|
| [30] |
|
| [31] |
|
| [32] |
|
| [33] |
|
| [34] |
|
| [35] |
|
| [36] |
|
| [37] |
|
/
| 〈 |
|
〉 |
