
Journal of Resources and Ecology >
China’s Construction of an Agricultural Powerhouse—Experience and Inspiration from Representative Countries
|
FENG He, E-mail: fh112781@163.com |
Received date: 2024-01-20
Accepted date: 2024-09-02
Online published: 2025-01-21
Supported by
National Social Science Fund of China(21&ZD093)
National Natural Science Foundation of China(41871109)
Agricultural Science and Technology Innovation Program(CAAS-CSAERD-202402)
Agricultural Science and Technology Innovation Program(10-IAED-RC-09-2024)
Agricultural Science and Technology Innovation Program(10-IAED-04-2024)
The construction of an agricultural powerhouse in China is confronted with the practical dilemma of relying mainly on small-scale farming and weak agricultural competitiveness, so an exploration of feasible paths for building an agricultural powerhouse is urgently needed. This study constructed indicator systems that reflect the level of agricultural development from three dimensions: resource endowment, output status, and urban-rural relations. On this basis, the gap between China and the world’s representative agricultural powers was analyzed, and the evolutionary characteristics of agricultural policies in the European Union, Japan, and the United States were explored, leading to relevant policy implications. This analysis found that the superficial problems of China's agricultural development lie in the relative scarcity of good resource conditions and insufficient modernization, while the underlying crux lies in the lack of obvious industrial competitive advantages, which is especially reflected in the lack of coordinated development between industry, agriculture, and urban-rural areas. The European Union, Japan, and the United States all focus on improving the international competitiveness of agriculture based on their comparative advantages, attach importance to the comprehensive development of rural areas, and have effectively constructed coordinated industry-agriculture and urban-rural relations, all of which have promoted the comprehensive development of agriculture. China’s construction of an agricultural powerhouse should be based on its national conditions and the general laws governing the building a world-class agricultural powerhouse. The strategy should include focusing on building a diversified food supply system to ensure food security; focusing on the modernization of agricultural science and technology, which will promote the process of agricultural modernization; promoting the development of the entire agricultural industry chain, which will enhance the competitiveness and risk resistance of the agricultural industry; accelerating public policy reform and continuing to promote urban-rural integration.
FENG He , CHEN Yangfen . China’s Construction of an Agricultural Powerhouse—Experience and Inspiration from Representative Countries[J]. Journal of Resources and Ecology, 2025 , 16(1) : 36 -48 . DOI: 10.5814/j.issn.1674-764x.2025.01.004
Table 1 International comparative evaluation system of the main indicators of strong agricultural countries |
| Grade 1 | Grade 2 | Method of calculation |
|---|---|---|
| Resource endowment | (I) Nominal GDP per capita | GDP/population |
| (II) Cultivated land area per capita | Cultivated land area/population | |
| (III) Gross fixed asset formation per agricultural labor | Gross fixed asset formation in agriculture/number of people working in agriculture | |
| Status of outputs | (IV) Cereal yields | Total output/sown area |
| (V) Net exports of agricultural products | Export amount- import amount | |
| (VI) Average value of agricultural labor output | Value added in agriculture/number of people working in agriculture | |
| Urban-rural relations | (VII) Ratio of output per laborer in the non-agricultural sector to the agricultural sector | Non-agricultural labor force output per labor force/agricultural labor force output per labor force |
| (VIII) Urbanization rate | Urban population/total population | |
| (IX) Percentage of agricultural workers | Number of agricultural workers/employed population | |
| (X) Share of agricultural GDP | Agricultural GDP/total GDP |
Note: Data sources: Nominal GDP per capita, cereal yields, value added in agriculture, value added in agriculture as a share of GDP, and urbanization rates were obtained from the World Bank: https://data.worldbank.org.cn/indicator/NY.GDP.PCAP.CD, https://data.worldbank.org/.Indicator/AG.YLD.CREL.KG, https://data.worldbank.org.cn/indicator/NV.AGR.TOTL.ZS, and https://data.worldbank.org/indicator/SP.URB.TOTL.IN.ZS, respectively. Cultivated land area, population size, gross fixed asset formation in agriculture, agricultural exports, agricultural imports, number of people employed in agriculture, and percentage of people employed in agriculture were obtained from FAO database: https://www.fao.org/faostat/en/#data/RL, https://www.fao.org/faostat/en/#data/OA, https://www.fao.org/faostat/zh/#data/CISP, https://www.fao.org/faostat/en/#data/TCL, and https://www.fao.org/faostat/zh/#data/OEA, respectively. |
Table 2 Comparative evaluation of the main indicators of the world’s agricultural powerhouses |
| Country | Resource endowment | Status of outputs | Urban-rural relations | |||||||
|---|---|---|---|---|---|---|---|---|---|---|
| I (USD) | II (ha per capita) | III (USD person-1) | IV (kg ha-1) | V (1000 USD) | VI (USD per capita) | VII | VIII (%) | IX (%) | X (%) | |
| United States | 70248.63 | 0.47① | 24536.03 | 8268.0 | 1289868.42 | 88201.40 | 1.60 | 82.87 | 1.70 | 0.96 |
| Canada | 51987.94 | 1.01① | 23273.74 | 3078.3 | 18871325.20 | 105731.01② | 0.80② | 81.65 | 1.30 | 1.70② |
| France* | 43658.98 | 0.28① | 20265.82 | 7170.9 | 13000797.14 | 71799.36 | 1.32 | 81.24 | 2.40 | 1.64 |
| Germany* | 51203.55 | 0.14① | 26295.15 | 6998.1 | -17840758.53 | 70056.73 | 1.41 | 77.54 | 1.20 | 0.85 |
| Australia | 60443.11 | 1.19① | 33396.65 | 2548.0 | 27214713.74 | 112625.76 | 1.00 | 86.36 | 2.40 | 2.31 |
| The Netherlands* | 57767.88 | 0.06① | 31410.99 | 7872.3 | 35409612.11 | 76390.84 | 1.38 | 92.57 | 2.20 | 1.55 |
| Israel | 52170.71 | 0.04① | 31065.93 | 3508.8 | -5735817.00 | 184829.34 | 0.62 | 92.67 | 0.90 | 1.26 |
| Japan | 39312.66 | 0.03① | 5193.65 | 6787.3 | -55607059.00 | 24710.04① | 3.02① | 91.87 | 3.10 | 1.04① |
| China | 12556.33 | 0.08① | 1030.62 | 6320.8 | -143261089.25 | 6826.03 | 4.07 | 62.51 | 23.99 | 7.26 |
Note: Indicators followed by an asterisk (*) are for EU Member States; data followed by ① are for 2020; those followed by ② are for 2018; and the rest are for 2021. The Roman numerals “I” - “X” represent the corresponding indicators in Table 1. Indicator VII, Ratio of output per laborer in the non-agricultural sector to the agricultural sector, is a ratio without units. |
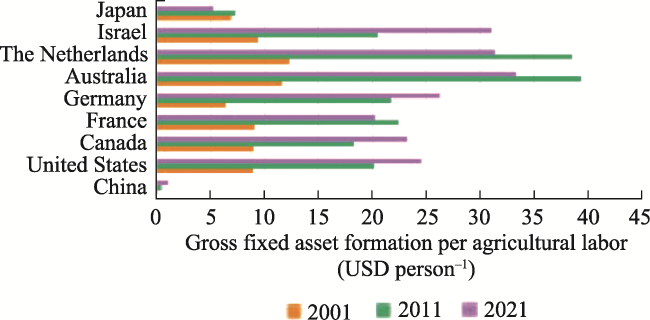
Figure 1 Gross fixed asset formation per agricultural laborer by country in 2001, 2011, and 2021 |
Table 3 Percentage of agricultural workers and the ratio of output per laborer in the non-agricultural sector to the agricultural sector by country, 2001-2021 |
| Country | China | United States | Canada | France | Germany | Australia | The Netherlands | Israel | Japan | |||||||||
|---|---|---|---|---|---|---|---|---|---|---|---|---|---|---|---|---|---|---|
| IX (%) | VII | IX (%) | VII | IX (%) | VII | IX (%) | VII | IX (%) | VII | IX (%) | VII | IX (%) | VII | IX (%) | VII | IX (%) | VII | |
| 2001 | 50.00 | 5.96 | 2.10 | 1.79 | 2.20 | 0.92 | 4.10 | 1.67 | 2.60 | 2.23 | 4.80 | 1.27 | 2.90 | 1.28 | 2.00 | 0.90 | 4.70 | 3.35 |
| 2002 | 50.00 | 6.27 | 2.00 | 1.91 | 2.10 | 0.95 | 4.10 | 1.78 | 2.50 | 2.54 | 4.40 | 1.04 | 2.70 | 1.23 | 2.00 | 0.86 | 4.50 | 3.16 |
| 2003 | 49.10 | 6.53 | 1.80 | 1.50 | 2.10 | 0.92 | 4.20 | 2.00 | 2.40 | 2.64 | 3.90 | 1.28 | 2.90 | 1.36 | 1.90 | 0.86 | 4.50 | 3.33 |
| 2004 | 46.90 | 5.67 | 1.80 | 1.29 | 2.00 | 0.84 | 3.90 | 1.84 | 2.40 | 2.22 | 3.70 | 1.15 | 3.20 | 1.61 | 2.00 | 1.00 | 4.50 | 3.51 |
| 2005 | 44.80 | 5.84 | 1.70 | 1.38 | 2.10 | 1.02 | 3.60 | 1.88 | 2.40 | 2.92 | 3.60 | 1.18 | 3.50 | 1.78 | 2.00 | 0.86 | 4.30 | 3.77 |
| 2006 | 42.60 | 5.91 | 1.70 | 1.56 | 2.10 | 1.13 | 3.70 | 2.15 | 2.30 | 2.78 | 3.40 | 1.19 | 3.50 | 1.70 | 1.80 | 0.78 | 4.20 | 3.75 |
| 2007 | 40.80 | 5.74 | 1.60 | 1.38 | 2.00 | 1.15 | 3.40 | 1.88 | 2.30 | 2.67 | 3.30 | 1.45 | 3.20 | 1.68 | 1.60 | 0.76 | 4.10 | 3.85 |
| 2008 | 39.60 | 5.54 | 1.60 | 1.42 | 1.90 | 1.00 | 2.70 | 1.58 | 1.80 | 1.97 | 3.20 | 1.32 | 3.00 | 1.75 | 1.70 | 0.79 | 4.10 | 3.83 |
| 2009 | 38.10 | 5.57 | 1.60 | 1.51 | 2.00 | 1.12 | 2.90 | 1.91 | 1.70 | 2.24 | 3.20 | 1.33 | 2.90 | 1.76 | 1.70 | 0.65 | 4.10 | 3.62 |
| 2010 | 36.70 | 5.49 | 1.70 | 1.50 | 1.80 | 1.08 | 2.90 | 1.56 | 1.60 | 1.87 | 3.20 | 1.39 | 2.80 | 1.46 | 1.60 | 0.74 | 3.90 | 3.41 |
| 2011 | 34.80 | 5.14 | 1.80 | 1.31 | 1.80 | 0.91 | 2.90 | 1.52 | 1.60 | 1.69 | 2.80 | 1.17 | 2.50 | 1.48 | 1.40 | 0.64 | 3.70 | 3.23 |
| 2012 | 33.60 | 4.93 | 1.70 | 1.33 | 1.80 | 0.87 | 2.90 | 1.53 | 1.60 | 1.73 | 2.80 | 1.17 | 2.50 | 1.38 | 1.10 | 0.66 | 3.80 | 3.25 |
| 2013 | 31.40 | 4.58 | 1.60 | 1.12 | 1.80 | 0.85 | 3.00 | 1.79 | 1.40 | 1.44 | 2.60 | 1.08 | 1.90 | 0.98 | 1.20 | 0.74 | 3.60 | 3.28 |
| 2014 | 29.50 | 4.36 | 1.70 | 1.30 | 1.70 | 0.98 | 2.80 | 1.58 | 1.40 | 1.49 | 2.80 | 1.19 | 2.10 | 1.11 | 1.10 | 0.73 | 3.50 | 3.46 |
| 2015 | 28.30 | 4.26 | 1.80 | 1.61 | 1.60 | 0.80 | 2.70 | 1.46 | 1.40 | 1.93 | 2.60 | 1.04 | 2.10 | 1.14 | 1.00 | 0.66 | 3.50 | 3.31 |
| 2016 | 32.30 | 4.35 | 1.80 | 1.77 | 1.90 | 0.95 | 2.80 | 1.73 | 1.30 | 1.78 | 2.60 | 1.03 | 2.10 | 1.09 | 1.00 | 0.65 | 3.40 | 2.95 |
| 2017 | 31.60 | 4.59 | 1.80 | 1.76 | 1.50 | 0.73 | 2.60 | 1.47 | 1.30 | 1.43 | 2.60 | 0.90 | 2.00 | 1.03 | 1.00 | 0.65 | 3.30 | 2.90 |
| 2018 | 30.70 | 4.69 | 1.70 | 1.79 | 1.50 | 0.80 | 2.50 | 1.32 | 1.20 | 1.74 | 2.60 | 1.01 | 1.90 | 1.09 | 0.90 | 0.64 | 3.40 | 3.22 |
| 2019 | 29.60 | 4.44 | 1.70 | 1.90 | 1.50 | 0.85 | 2.50 | 1.45 | 1.20 | 1.49 | 2.60 | 1.15 | 1.90 | 1.09 | 0.90 | 0.66 | 3.30 | 3.12 |
| 2020 | 28.40 | 4.10 | 1.70 | 1.65 | 1.60 | 0.84 | 2.30 | 1.32 | 1.30 | 1.66 | 2.80 | 1.29 | 1.90 | 1.10 | 0.90 | 0.62 | 3.20 | 3.02 |
| 2021 | 23.99 | 4.07 | 1.70 | 1.60 | 1.30 | 0.83 | 2.40 | 1.32 | 1.20 | 1.41 | 2.40 | 1.00 | 2.20 | 1.38 | 0.90 | 0.62 | 3.10 | 3.08 |
Note: IX represents percentage of agricultural workers; VII represents the ratio of output per laborer in the non-agricultural sector to the agricultural sector. |
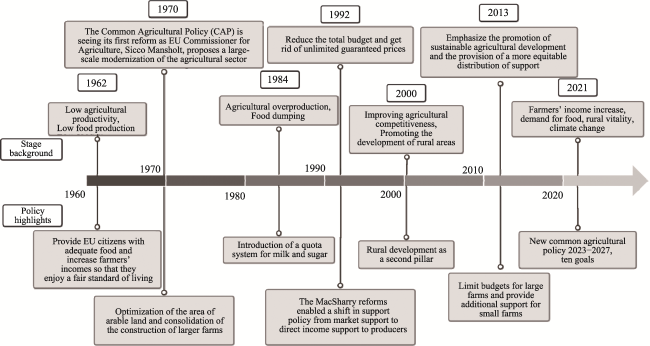
Figure 2 Review of changes in the focus of the EU common agricultural policy |
Table 4 Summary of European Agricultural Fund for Rural Development (EAFRD) allocations, 2014-2020 (Unit: 106 Euros) |
| Country | Allocation amount | Country | Allocation amount | Country | Allocation amount | Country | Allocation amount |
|---|---|---|---|---|---|---|---|
| Belgium | 648 | Greece | 4718 | Lithuania | 1613 | Portugal | 4058 |
| Bulgaria | 2367 | Spain | 8297 | Luxembourg | 101 | Romania | 8128 |
| Czech Republic | 2306 | France | 11385 | Hungary | 3431 | Slovenia | 838 |
| Denmark | 919 | Croatia | 2026 | Malta | 97 | Slovakia | 1560 |
| Germany | 9446 | Italy | 10444 | The Netherlands | 765 | Finland | 2380 |
| Estonia | 823 | Cyprus | 132 | Austria | 3938 | Sweden | 1764 |
| Ireland | 2191 | Latvia | 1076 | Poland | 8698 |
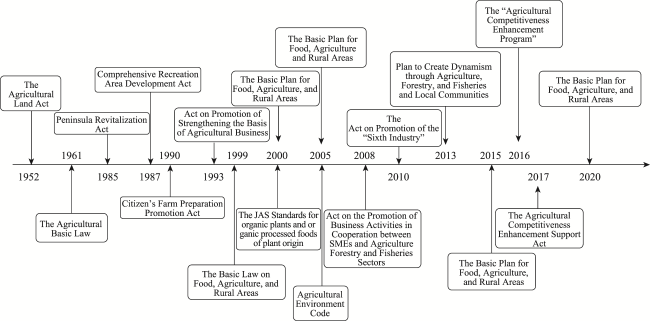
Figure 3 Timeline of the main agricultural policy developments in Japan |
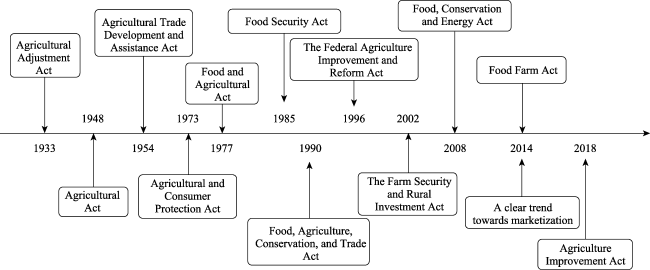
Figure 4 Timeline of major agricultural policy developments in the USA |
| [1] |
|
| [2] |
|
| [3] |
|
| [4] |
|
| [5] |
|
| [6] |
|
| [7] |
|
| [8] |
|
| [9] |
|
| [10] |
|
| [11] |
|
| [12] |
|
| [13] |
|
| [14] |
|
| [15] |
|
| [16] |
|
| [17] |
|
| [18] |
|
| [19] |
OECD/FAO. 2021. OECD-FAO agricultural outlook 2021-2030. Paris, France: OECD Publishing.
|
| [20] |
|
| [21] |
|
| [22] |
|
| [23] |
|
| [24] |
|
| [25] |
|
| [26] |
|
| [27] |
|
| [28] |
|
| [29] |
|
| [30] |
|
| [31] |
|
| [32] |
|
| [33] |
|
| [34] |
|
| [35] |
|
| [36] |
|
| [37] |
|
| [38] |
|
/
| 〈 |
|
〉 |